INTRODUCTION
Previous studies of malaria incidence and hospital admission (hereafter referred to as admission/s) rates across different countries have suggested the existence of annual and infrannual (multiannual) cycles [Reference Gomez-Elipe1, Reference Roca-Feltrer2] and some of these have been associated with the influence of cyclic factors from either the mosquito/transmission patterns or natural environment, or both [Reference Zhou3–Reference Sidyakin5]. Best available descriptions of malaria incidence and admission dynamics are important in order to better plan and evaluate the implementation of programmes to remotely monitor (targeted and time-fixed satellite observations) and control the disease, especially in endemic zones. However, not all of malaria time-series (beyond their underlying annual cycle or seasonality) have clearly defined long-term linear trends of incidence or admissions and, even if they did have, these could not be easily forecast by linear trend analysis only due to the presence of a high level of variability or multicomponent volatility. It is possible that the variations around such linear (mean values) or nonlinear trends may show regular patterns and potentially be exploited in modelling and forecasting by derivation of future estimates and their 95% confidence intervals. Therefore, due to its widespread patterns, especially in some endemic zones, malaria incidence and admissions and their temporal occurrence is of great public health and socioeconomic importance. Better forecasting of temporal variations of malaria and their peaks, leading to recommendations for better allocation of resources, are invaluable for national health systems in such zones in terms of early identification of increased risk and potentially early treatment as well as exploration of risk factors or triggers that may have contributed to the appearance and clinical progression of this vector-borne disease.
It should be noted that triggers for increases and/or cyclical variations in malaria incidence and admissions may include such factors of the natural environment as interrelated physico-chemical processes and irradiations of climatic or cosmic (space/solar or earth) origin, whereas their dynamics show clear cyclical patterns, with fluctuations of their amplitudes at various frequencies (from hours, days to months, years and tenths of years). Such natural influences may be denoted by the common term of ‘heliogeophysical activity’ (HGA) which is mainly represented by various phenomena such as sunspot activity and geomagnetic fluctuations. However, it may also refer to a number of other photic or non-photic events (e.g. solar UV radiation, solar wind, 10·7-cm solar radio flux, earth-ionosphere cavity or Schumann resonances [Reference Cherry6], etc.) all of which are indicated or described by quantitative parameters or indices (sunspot Rz index, geomagnetic aa index, ozone concentration, etc.). Most of these components or indices exhibit an established seasonality (annual cyclicity) but their chronomes are often multicomponent, with trans-year (periods longer than 12 months but shorter than 24 months) or infrannual (multiannual) cycles such as the 11-year cycle of the sunspot index (Rz index or Wolf number) which has been a consistent observation over hundreds of years [Reference Sidyakin5–Reference Halberg8]. However, whether or not such cyclical patterns in malaria incidence or admissions and HGA are interconnected, remains still to be confirmed.
Cerebral malaria (CM) is the most important course of Plasmodium falciparum infection (malaria) which complicates in about 2% of cases, with mortality rates of up to 50%. For instance, an estimated 243 million cases of malaria in 2009 led to about 863 000 deaths throughout the world, 80% of which, as estimated by the World Health Organization, were in infants and young children. Severe P. falciparum infections typically present two distinct clinical manifestations: severe malarial anaemia (SMA) or CM. Although parasitaemia and CM appear correlated, no causal relationship between degree of parasitaemia and CM has been firmly established. Many studies point to erythrocyte sequestration in the brain as important, although this has not been observed in all cases. However, the presence of infected red blood cells (RBCs) in retinal capillaries is strongly associated with CM, and fatalities putatively due to CM, but without erythrocyte sequestration, can be attributed to other infection-related causes. Cerebral clinical manifestations may arise from RBC rosettes cytoadhering to endothelium, clogging blood flow to and within the brain. Platelets may play a significant role in the attachment of infected RBCs to brain endothelium [Reference Billig9].
In this sense, a major advance in recent years has been the recognition that severe malaria, predominantly caused by P. falciparum, is a complex multi-system disorder presenting with a range of clinical features. Some surviving patients have an increased risk of neurological and cognitive deficits, behavioural difficulties and epilepsy, making CM a leading cause of childhood neurodisability in the malaria transmission area. In the current absence of a vaccine, rapid diagnosis of the disease, efficient treatment, correct management and nursing care are the only weapons to control mortality due to P. falciparum [Reference Gay10]. In particular, this is a rapidly fatal disease characterized by headache, seizures, and coma, with diffuse cerebral oedema and only very rarely by focal features such as hemiplegia, aphasia, hemianopia, or cerebellar ataxia. Cerebral capillaries and venules are packed with parasitized erythrocytes and the brain is dotted with small foci of necrosis surrounded by glia (the so-called ‘Durck nodes’). These findings have been the basis of several hypotheses (one of which attributes the cerebral symptoms to mechanical obstruction of the vessels), but no hypothesis is entirely satisfactory. Moreover, it appears unlikely that a disorder of immune mechanisms is directly involved in this pathogenesis. Usually the neurological symptoms appear during weeks 2–3 of the infection, but they may be the initial manifestation. It should be noted that children in hyperendemic regions are those most susceptible to CM. Among adults, only pregnant women and non-immune individuals who discontinue prophylactic medication are liable to involvement of the central nervous system. Useful laboratory findings are anaemia and parasitized RBCs. Cerebrospinal fluid may be under increased pressure and occasionally contain a few white blood cells, while the glucose content is normal. With Plasmodium vivax infections, there may be drowsiness, confusion, and seizures without invasion of the brain by the parasite. The clinical criteria for CM diagnosis consists of unarousable coma, exclusion of other encephalopathies and confirmation of a P. falciparum infection. Besides unarousable coma, in up to 80% of CM cases epileptic seizures are also observed. Other organs are frequently involved, with parallel dysfunction.
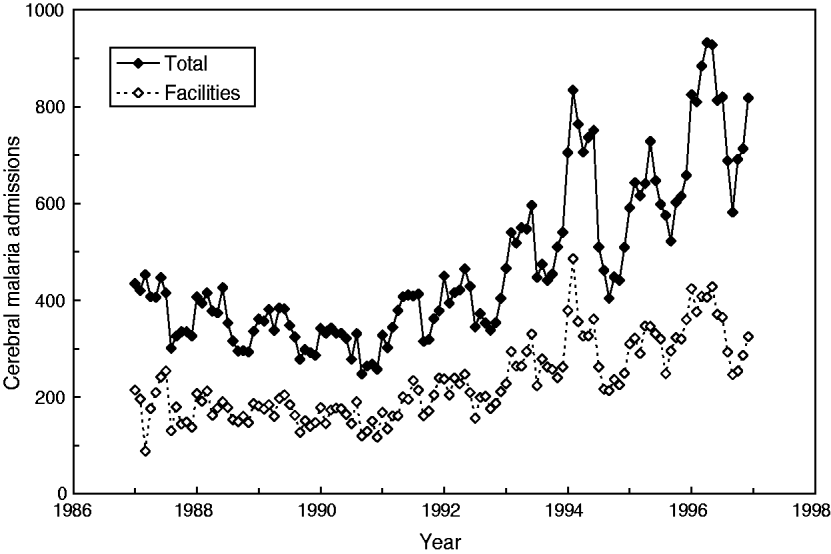
Interestingly, a report by Cibulskis and colleagues [Reference Cibulskis11] on monthly data from Papua New Guinea (1987–1996, latitude 6°S) presented data showing an increasing trend in the number of total CM admissions as well as admissions to selected health facilities (hereafter referred to as facilities) (Fig. 1). But neither trend nor any periodic oscillations were described by these authors. Owing to environmental interactions, it is likely that seasonal variations of malaria admissions (e.g. 12-month cycle) as well as trans-year or infrannual (multiannual) cyclicity might also be present and eventually be described over this interval of 120 months. Indeed, our own preliminary analysis [Reference Dimitrov and Atanassova12] on monthly malaria incidence from Burundi indicated that beyond the 6-month cyclicity (and, eventually, seasonality), a multicomponent, infrannual cyclic pattern with period T > 12 months (e.g. 17·5–18·0, 27·5, 65·0–65·5 months, all at P < 0·05) might exist over the interval 1997–2003 (n = 60 months).

Fig. 1. Cerebral malaria admissions in Papua New Guinea from January 1987 to December 1996.
Beyond the particular approach in these previous studies on CM admissions in Papua New Guinea [Reference Cibulskis11, Reference Dimitrov and Atanassova12], other more specific and accurate quantitative approaches in analysing and modelling the number of malaria admissions are needed [Reference Dimitrov, Komitov and Dimitrova13–Reference Cazelles17]. Malaria dynamics and climate forcing may play complementary and interacting roles at different temporal scales. Thus, these mechanisms and temporal relationships should not be viewed only as an alternative forecasting approach – their interactions should be integrated into the development of all future predictive models. Such additional, appropriate methods, with minimal requirements for a specific algorithm and 95% confidence intervals for the derived estimates and statistical parameters [Reference Dimitrov, Komitov and Dimitrova13–Reference Dimitrov, Atanassova and Rachkova16], as in the case of malaria admission data exploited here, should be the following: (1) Description, analysis and decomposition of the temporal dynamics; linear and nonlinear regression modelling as well as regression modelling of periodic modes over time and wavelet approach [Reference Cazelles17, Reference Dimitrov18], with, finally, a reconstruction and derivation of cyclical estimates for modelling of the time-series. (2) Possibly linear and nonlinear regression modelling to independent variables (e.g. HGA) with deterministic patterns (seasonality, cyclicity, etc.). Currently, the relationship of HGA cycles to malaria dynamics is of increasing importance in the view of the last 11-year solar cycle No. 24 started in 2008 (www.physorg.com/news119271347.html).
Study objective
The aims of this study were (i) to describe the dynamics and reveal eventual trans-year or infrannual (multiannual) cycles and their relationships with underlying seasonality (annual cycle) in monthly CM admissions in Papua New Guinea (1987–1996); and (ii) to consider malaria admissions cyclicity for similarities to and associations with main heliogeophysical cycles.
MATERIALS AND METHODS
Sources and description of time-series datasets
The time-series dataset consisted of monthly CM admissions (ICD-9-CM, Dx:084·9) in Papua New Guinea as obtained from Cibulskis et al. (Fig. 2 in [Reference Cibulskis11]) as originally provided by the Ministry of Health, Papua New Guinea. For this study, the absolute numbers of total CM admissions, as well as those from selected facilities, were considered. The data are presented as observed numbers and covered the period from January 1987 to December 1996 (120 months or 10 years, Fig. 1).
Statistical analyses
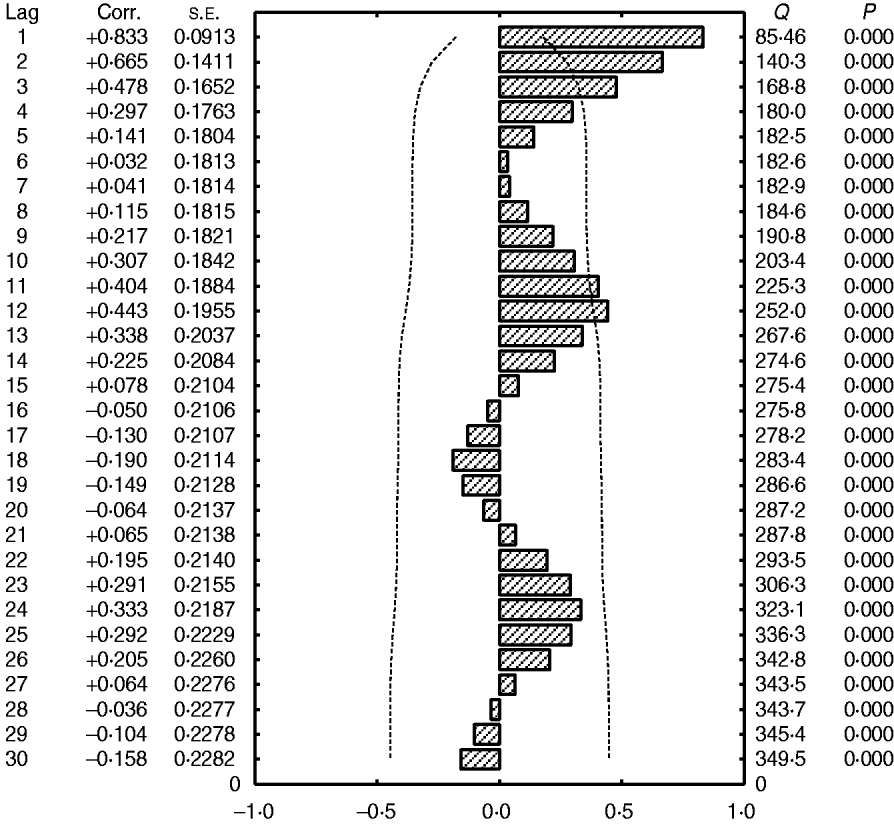
Different statistical methods for time-series analyses and modelling were used, according to a previously described algorithm used to detect cyclicity in similar monthly malaria time-series [Reference Dimitrov18]. Initially, descriptive statistics with linear and nonlinear regression modelling over time were applied (Figs 1–3). As a second step, spectral (Fourier) and autocorrelation functions were applied to examine the cyclical variations from the trend (regression line) (Figs 4, 5) after the underlying trend was removed. The estimated error of the autocorrelation coefficients were computed by the Bartlett equation:
where k is the lag (months) and n the number of admissions (Fig. 5). As a third step, a periodogram regression analysis (PRA) for estimation of the period of existing cycles (period T) was applied [Reference Dimitrov and Atanassova12–Reference Valev14, Reference Dimitrov19] as well as wavelet transforms (WTs) (for more details see [Reference Dimitrov18]) to study the evolution of variability, i.e. change over time of the revealed cyclicities (Figs 6, 7).
In particular, PRA was successfully applied earlier in studies on helioepidemiology of various types of cancer and infectious diseases as described previously in more detail elsewhere [Reference Dimitrov, Komitov and Dimitrova13, Reference Dimitrov18–Reference Dimitrov21]. A range (spectrum) of the linear coefficients of correlation R was constructed against each of the tested periods T (months) representing the so-called ‘periodogram’ (e.g. ‘regression correlogram’) of the time-series, i.e. power in the period domain (Fig. 6). The PRA, whether using basic (original), detrended or decycled time-series can be used for decomposing, modelling and reconstructing estimates by trigonometric approximation and produces model and forecast estimates [Reference Dimitrov, Atanassova and Rachkova16, Reference Dimitrov20, Reference Dimitrov, Rachkova and Atanassova22]. At the same time, the two-dimensional continuous WTs were calculated to represent the change of spectral power (time-frequency distribution of variations) and describe structures of different time scales by the application of a Morlet mother wavelet. This function is symmetric and very useful in identifying regions of maximum/minimum curvature [Reference Dimitrov18, Reference Hagelberg, Gamage, Foufoula-Georgiou and Kumar23] (Fig. 7). In particular, this was used for all possible period lengths ranging from 3 to 60 months (y-axis). The time-series was first de-trended by a fourth-order polynomial to better reveal any underlying periodicities. For instance, the wavelet scale is equal to a Fourier period using here ω0 = 6·2 in the mother wavelet. However, the Fourier approach allows mainly an analysis of strongly periodic processes while in such cases of quasi-periodic variations it represents only an average spectrum over time. In addition to the Fourier spectrum, the WTs provide information on both the periodicities and the time intervals in which these periodicities are most likely to occur. Statistica software was used for most computations as well as a specialized package ‘6D-STAT’ (http://www.astro.bas.bg/∼komitov/dataproc.htm) provided by B. Komitov (Bulgaria).
RESULTS
Descriptive (exploratory) statistics – trends and correlations
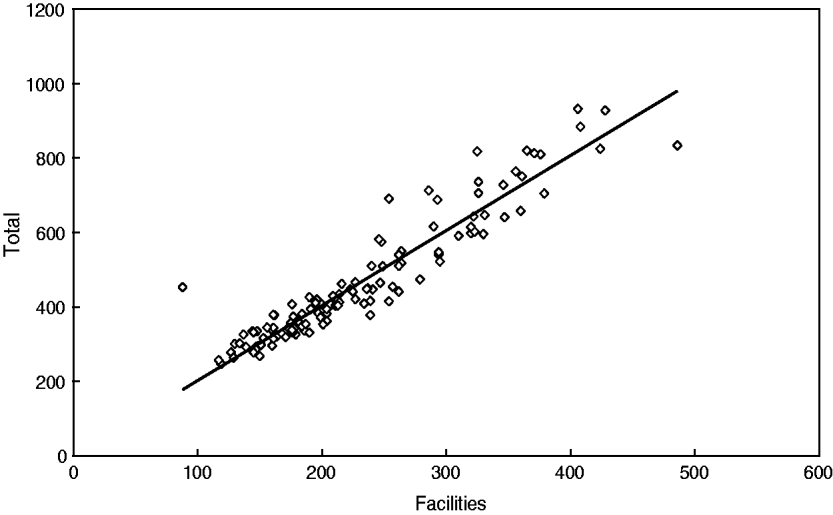
Descriptive analyses have shown that CM in Papua New Guinea increased from 88 to 486 cases per month (facilities, mean±s.d. 230 ± 80); moreover, the total number also increased from 247 to 932 cases per month (mean±s.d. 466 ± 167), i.e. almost four- to five-fold. It should be noted that both time-series are very similar and are closely related as seen in Figure 2 (linear coefficient of correlation R = 0·94); therefore, only the results for the total number of cases will be further presented and discussed.

Fig. 2. Strong correlation between the total number of cerebral malaria admissions and cerebral malaria admissions in selected facilities in Papua New Guinea (1987–1996).
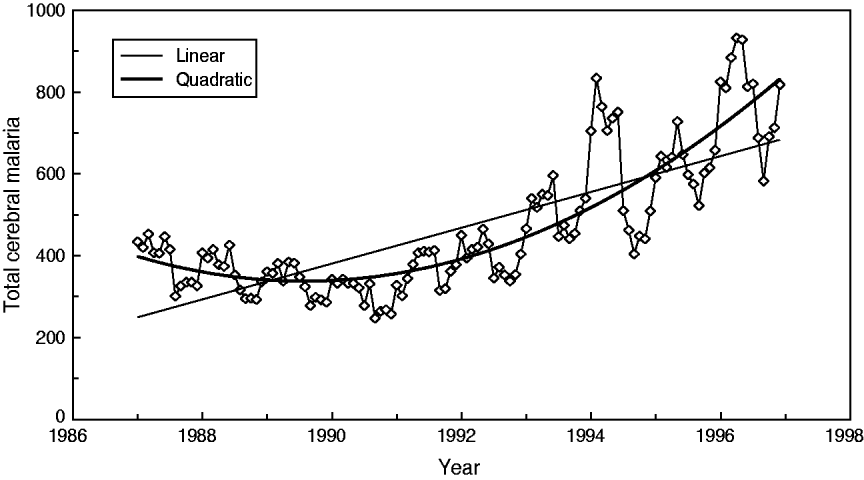
In particular, this relationship can be described by the regression equation of linear type Y(total) = 2·017*X(facilities). As shown by Cibulskis et al. [Reference Cibulskis11], an increasing linear trend of CM can be observed (r = 0·76); however, this trend only explains about 57·8% of the variations over time. The best approximation is a quadratic (parabola) function with a minimum in year 1989 (r = 0·86) (Fig. 3).

Fig. 3. Best trend approximation of total admission dynamics for cerebral malaria in Papua New Guinea (1987–1996).
Cyclical patterns – seasonality and infrannual cyclicity
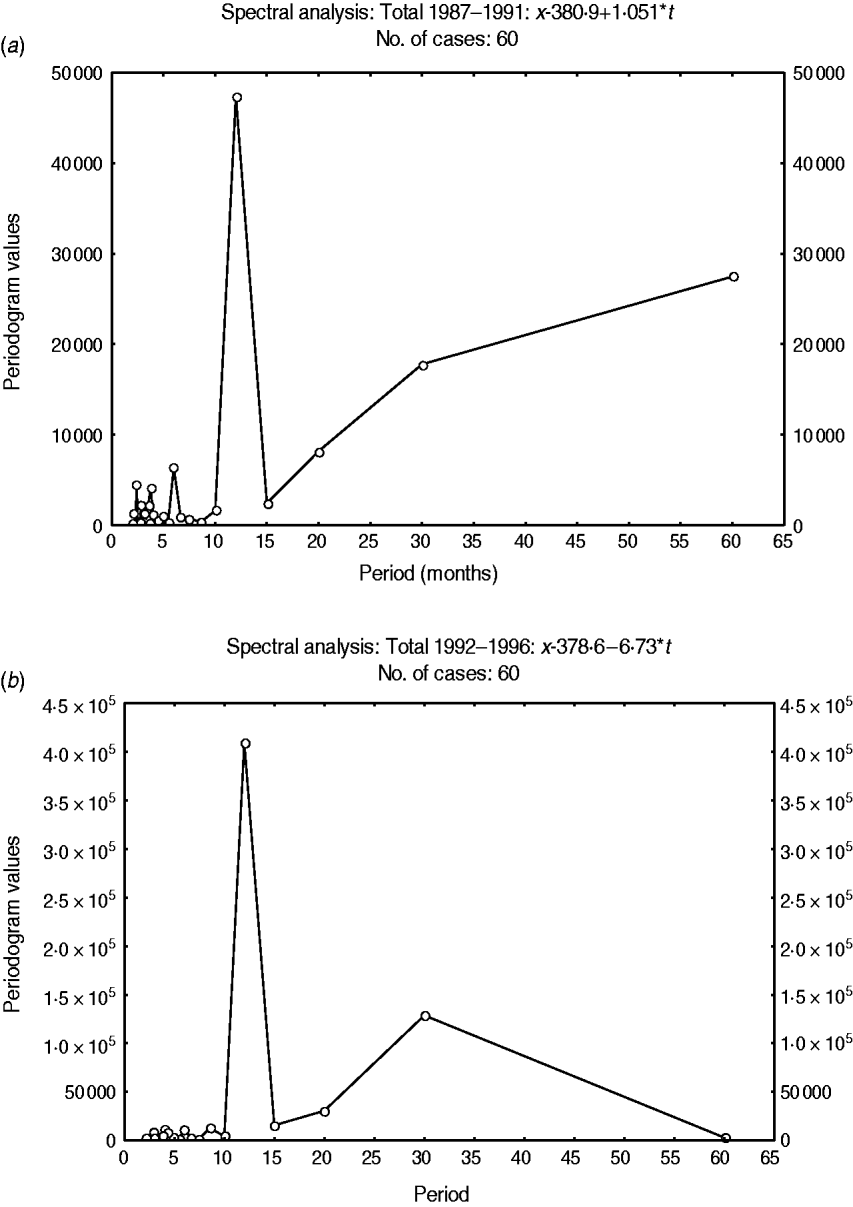
To further study the variations, we detrended the time-series data (removed the trend) of total malaria admissions and applied spectral (Fourier) and autocorrelation analyses (Figs 4 and 5).

Fig. 4. Fourier spectrum of variations in the detrended total admissions for cerebral malaria in Papua New Guinea (1987–1996). (a) Sub-interval A (1987–1991). (b) Sub-interval B (1992–1996).

Fig. 5. Autocorrelation function of total admissions for cerebral malaria in Papua New Guinea (1987–1996). Dashed lines (- - - - -), 1·96×s.e. of the coefficient of autocorrelation of residuals (the fitted linear trend has been removed).
A 12-month cyclical pattern (seasonality) with high amplitude was observed. Further, an infrannual cyclicity of about 30 months (2·5 years or far-quasi-biennial) is described as well as a longer cycle of 96–120 months (8–10 years, data not shown); however, the latter tended to be similar to the time-series length (sample size). We analysed the above multicomponent cyclic patterns in greater detail by experimentally dividing the whole time-series of 120 months into two equal time sub-intervals of 60 months (5 years): sub-interval A (1987–1991) (Fig. 4a) and sub-interval B (1992–1996) (Fig. 4b) and the above tendencies were clearly illustrated. By this method the stability of the seasonal cycle (12 months) and specific dynamics of the far-quasi-biennial cycle (30 months) were suspected (see further the results from the WTs). Furthermore, in parallel, the autocorrelation clearly indicated a statistical significance for the 12-month cycle (seasonal, 1-year, P < 0·05) (Fig. 5).
It should be noted that the results for the variations of CM admissions in the selected facilities only (data not shown) are very similar to the results of the total number of admissions. It is interesting that the amplitude of the infrannual cycle is lower than the amplitude of the annual cycle (seasonality) indicating that the number of admissions is very high at a maximum of such a cycle while seasonal variations are very strong. However, to further quantify and more exactly describe the above cyclical patterns, a PRA was applied (Fig. 6; see Materials and Methods section for more detail).

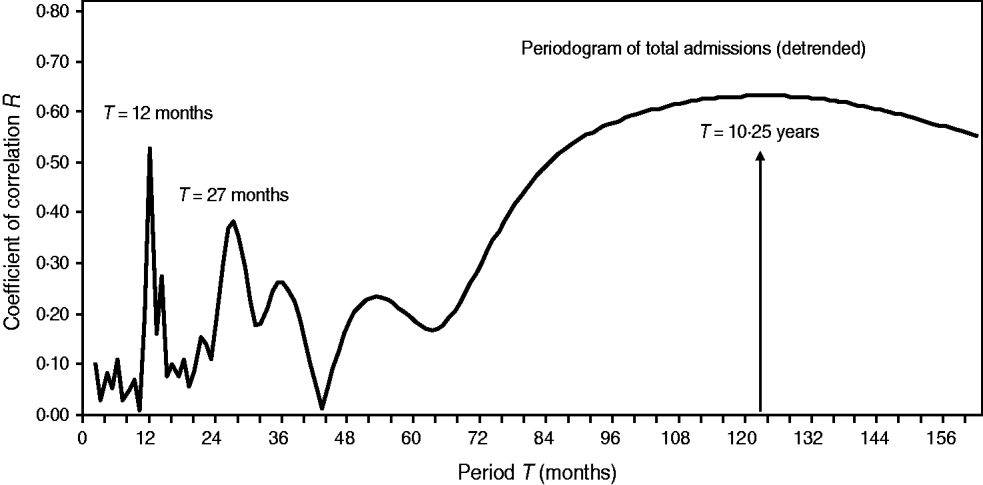
Fig. 6. Periodogram regression analysis of cyclic patterns in variations of total admissions for cerebral malaria in Papua New Guinea (1987–1996). The spectrum of the coefficients of correlation R (periodogram) illustrates seasonal (period T = 12 months), quasi-biennial (T = 27 months) and infrannual (T = 123 months, or 10·3 years) cycles in the detrended time-series. The 10·3-year cycle is denoted by a vertical arrow.
PRA of the cyclical variations
Once cyclical variations in the number of CM admissions are suspected, in order to better analyse their dynamical patterns we constructed periodograms (i.e. spectra of correlation coefficients R or the so-called ‘regression correlograms’) (Fig. 6). By using PRA on the detrended time-series, we confirmed seasonality (period T = 12 months) and a multicomponent, infrannual cyclic pattern with periods T = 27 months (2·25 years) and T = 123 months (≈10·3 years) in the total CM admissions in Papua New Guinea. The infrannual cycle of 10·3 years may be associated with the increasing long-term nonlinear (quadratic) trend; however, it should be interpreted with caution.
To further define the dynamics patterns of main cyclic variations, we further analysed in greater detail the underlying seasonal characteristics and the eventual dynamics (change) of such cycles. In particular, the results from the computation of characteristics of the main annual cycle of 12 months (seasonality) indicated that the maximum period is in May–June while the minimum is in September–October (Fig. 7 a). The application of WT analysis confirmed the stability of the annual, 12-month cycle over the whole interval – although the amplitude increases during the second interval, its period remains stable over the whole interval (Fig. 7 b, lower horizontal black line). Second, of note, the quasi-biennial cycle with an average period of 27 months practically appears in 1990 and its duration actually decreases from 30 to 26 months (Fig. 7 b, upper horizontal black line).

Fig. 7. Dynamics in cyclic variations of admissions for cerebral malaria (CM) in Papua New Guinea (1987–1996). (a) Mean monthly CM admissions with peaks in May–June. (b) Wavelet transformation of total CM admissions (quadratic trend was removed) – see text for more details.
In conclusion, we can summarize that the chronome (temporal structure) of the number of monthly CM admissions in Papua New Guinea during the years 1987–1996 (n = 120 months) is mostly characterized by a multicomponent cyclicity with expressed, stable seasonal pattern against the background of an increasing nonlinear (quadratic) trend.
DISCUSSION
Descriptive and regression analyses of data for malaria in Papua New Guinea (1987–1996, n = 120 months) have confirmed that the sample of monthly CM admissions in selected facilities is representative of the total number of admissions [Reference Cibulskis11] correlating very strongly between them and showing similar temporal patterns in terms of both trends and variations. Spectral, autocorrelation and periodogram regression analyses have described, for the first time, multicomponent cyclic patterns in the variations of monthly admissions for malaria in Papua New Guinea. Initially, we found that although using extensive analysis and modelling, the usual linear model for trend only explained up to 58% of time-series variations (the best nonlinear, quadratic model explained up to 74%). The other 42% of total variations remained unexplained; moreover, these remaining variations are most likely to appear in cycles, as confirmed by the quadratic (parabola) model. It should be emphasized that all analyses were performed with raw data, without smoothing which strengthen the obtained results. Notably, the predominant cycles in malaria admission variations are for periods of 12 months (1·00 year), 27–30 months (2·25–2·50 years) and 123 months (10·3 years). This is of interest since a recent study [Reference Chowell24] has shown that in the background of strong annual (1-year, seasonality), biennial (2-year, P. vivax) and triennial (3-year P. falciparum) cycles, variations in incidence of malaria in Peru (1994–2006, n = 12 years) have been observed, which are similar in range to our 2·25-year cycle in CM admissions in Papua New Guinea. Possibly, the seasonal and biennial cycles in the variations of CM admissions may be linked to regional (local) factors (environmental temperature, rainfall, etc.) with similar cyclical patterns that influence both the blood parasite density [Reference Chowell24] or the immune system, or both, and this must be important, but is beyond the scope the current study.
Last, such infrannual (circadecennial) cyclicity of 8–10 years in malaria admissions in endemic areas such as Papua New Guinea may correspond to or be associated with known environmental cyclicity in the range of 8–11 years in heliophysical activity or climate/weather conditions (e.g. sunspots, solar wind, solar magnetic activity, surface temperature, etc.) [Reference Tomasino, Zanchettin and Traverso25–Reference Mabaso28]. For instance, there is a cyclicity of 17 years in the change in the sun's orbital angular momentum (L), defined by the torque T = dL/dt, and derived from the irregular oscillations of the sun around the centre of mass of the solar system. It has been shown that this cycle in the sun's motion, together with the 11-year sunspot cycle, are so closely connected with climatic phenomena that forecasts of droughts and floods, strong anomalies (negative and positive) in global temperature, and even El Niño and La Niña can be based on this relationship (see [25, p. 675]). The corresponding cycle constituted by the absolute rate of change |dL/dt| in the sun's orbital angular momentum has a mean length of 8·60 years (very similar to the varying infrannual cyclicity of about 8–10 years as suggested in the present study). Special phases in the cycles of dL/dt and |dL/dt| are characterized by accumulations of energetic solar eruptions, which seem to have an impact on the weather and climate because of their ability to modulate the strength of galactic cosmic rays that may have an effect on cloud cover, specifically cloud seeding by ionized secondary particles (see [25, p. 675]). At the same time, wavelet analysis has revealed an 8-year infrannual oscillation of the sea surface temperature in both the eastern and western equatorial Pacific [Reference Tian, Xu and Wei26].
Even if such influences as the abovementioned environmental cycles on, or synchronization with, CM admission cycles in Papua New Guinea may be postulated, most of the underlying mechanisms remain unclear. However, some earlier studies have suggested interesting patterns of cyclical appearance of malaria incidence (peaks at specific points) along the 11-year sunspot cycle (Rz index) in the early to mid-20th century [Reference Sidyakin5]. These studies described malaria peaks occurring in synchronization with the solar maxima during the years 1920–1950. If we assume that one of the main cyclic patterns in CM admissions in Papua New Guinea is an oscillation of 1·0–2·25–2·50 years, any other hierarchy of such infrannual cyclicity (⩾8–10 years) may be considered as a ‘repetition’ of this principal, common period. Indeed, for a given region, if CM admissions are able to oscillate in several biennial waves contemporaneously but in different phases, it is theoretically possible that after a defined number of cycles (years) the annual peak (within the particular year) may reach the highest possible level when the other close, biennial 2·25–2·50 year cycle coincides. Such phase-locked temporal occurrences [Reference Sidyakin5] are likely to give rise to higher numbers of CM admissions, i.e. an appearance of a cumulative, absolute increase in its amplitude, possibly being expressed as a major peak of a longer, infrannual cycle with a period of 8–10 years. Unfortunately, within the above conjectures we cannot conclude on likely HGA-related aetiological mechanisms of CM peaks; however, if we consider several minor consecutive increases, a role may be postulated for a global HGA-associated or regional (local) factors that clearly fluctuate with similar cyclicity [Reference Tian, Xu and Wei26–Reference Mabaso28]. Being novel historically [Reference Gill29], and also more recently [Reference Wangdi30, Reference Huang31], very important temporal analyses and correlations between disease incidence and meteorological factors have been shown to be very useful in generating hypotheses and predictive models for malaria, as well as for other infectious diseases, e.g. cholera [Reference Ohtomo32]. However, to what extent seasonal and multicomponent infrannual (biennial) or, eventually, shorter, trans-year cyclicity in the variations of CM admissions in Papua New Guinea are related or may interact with similar cycles of solar activity or other climate/weather oscillations remains largely unknown and represents an interesting question to be addressed in future research studies.
ACKNOWLEDGEMENTS
The authors are very grateful to Dr Richard Cibulskis (Global Malaria Programme, World Health Organization, Switzerland) for his assistance and support during the confirmation and interpretation of the original data from his paper [Reference Cibulskis11] as well as for providing his critical comments and useful suggestions for the preparation of this manuscript. This study was initiated when Dr Dimitrov was with the HRB Centre for Primary Care Research at the Royal College of Surgeons in Ireland.
DECLARATION OF INTEREST
None.


