INTRODUCTION
Malaria and pneumonia are the major causes of paediatric admissions in sub-Saharan Africa, and in Uganda in particular, they contribute greatly to mortality and morbidity in children aged <5 years [Reference Bassat1–Reference Yeka5]. In individuals aged >5 years, malaria and pneumonia are not as pronounced but they still cause a considerable number of disease cases and deaths [Reference Mayor6, Reference Schaaf7]. Malaria and pneumonia have overlapping symptoms when severe [Reference Berkley2, Reference Berkley8–Reference Källander11] which makes diagnosis difficult.
Moreover, the fight against these diseases has been disease specific. Recent evidence shows that disease-specific training in areas of high malaria burden may lead to sub-optimal health outcomes [Reference Osterholt4]. It is not uncommon for health practitioners to overtreat for malaria [Reference Reyburn12, Reference Ssekabira13] and to underdiagnose and undertreat pneumonia [Reference Osterholt4, Reference Gwer, Newton and Berkley10, Reference Reyburn12]. In [Reference Reyburn12], for example, higher case-fatality ratios were observed in cases testing negative for malaria, as their pneumonia status was never assessed.
Thus it is important for training programmes of clinicians to be integrated rather than disease specific. This was realized by WHO through the implementation of Integrated Management of Childhood Illness (IMCI) and Integrated Management of Adult Illness (IMAI) programmes. Integrated Infectious Disease Capacity Building Evaluation (IDCAP) also built on this by carrying out two training interventions on Mid-Level Practitioners (MLPs) in Uganda, i.e. Integrated Management of Infectious Diseases (IMID) and On-site Support Services (OSS). [14–Reference Weaver16].
IDCAP results on facility performance measures showed a notable increase in the proportion of individuals who were triaged and those that received appropriate treatment. However, the analysis only showed the impact of the interventions on facility performance and does not infer what happens to population outcomes such as prevalence, mortality and incidence of the diseases. In this regard we formulated a mathematical model that provides information about the incidence, prevalence and mortality due to malaria and pneumonia, and estimates the effect of the two training interventions on them.
For its development, the model utilizes information about the natural history of the two diseases and parameter values from published observational, clinical and field studies. It has parameters that are related to the facility performance indicators that were measured during IDCAP. It uses the IDCAP results on the effects of the interventions on these facility performance indicators to link the interventions to patient outcomes such as deaths and cases.
METHODS
Model
Our model is a deterministic Susceptible-Infected (SI)-type model. We use a deterministic model because our simulated population is large (~36 000) which implies that demographic stochasticity will have minimal impact on the population. Moreover our questions of interest will be answered by the determined set of parameter values and initial conditions. Our model categorizes individuals according to their clinical symptoms: uninfected, asymptomatic infection, non-severe symptomatic disease and severe disease. The uninfected and those with asymptomatic infection are merged in one class to form the susceptible class.
The susceptible class has proportions of individuals that are asymptomatic for both malaria and pneumonia, and these are assumed to be constant for the entire duration of the study. The reason for this is that information from the Uganda Health Demography Survey (UDHS) [17, 18] shows that the proportion of children with malaria parasites has remained constant over the years.
A single compartment is used to represent emergency cases (severe disease) as they are usually treated simultaneously for both diseases [Reference Källander, Nsungwa-Sabiiti and Peterson3, Reference Berkley8]. Moreover, one of the foci of both IMID and OSS was Emergency Triage, Assessment, and Treatment (ETAT) in which patients with severe disease were identified irrespective of which disease they had. We make the assumption that deaths due to either malaria or pneumonia occur only in the severe disease class.
The model stratifies the population into three age groups: [0,5) (subscript 1), [5,14) (subscript 2) and [14,50) (subscript 3) because the frequency and severity of malaria and pneumonia reduce as individuals grow older and their immunity to infection increases. We have approximated immunity by using different probabilities of transmission for the different age groups.
The model also has mosquito dynamics with the population of mosquitoes being made up of susceptible and infected mosquitoes. We assume that mosquitoes bite humans at a constant rate. We also consider seasonality in the malaria model which is accounted for by changing the birth rate of the mosquitoes. This formulation is in the subsection headed fitting baseline malaria data.
Figure 1 shows the model diagram, and the model equations are given by a system of equations (1) in the Appendix. Appendix Table A1 gives a summary of the descriptions of the variables and some parameters.
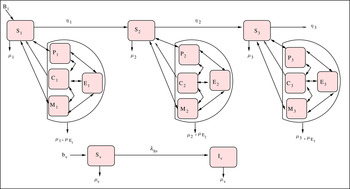
Fig. 1. Malaria and pneumonia co-infection model.
IMID and OSS
In Uganda, during IDCAP, the first-line treatment for malaria was artemisinin-based combination therapy and for pneumonia, this was amoxicillin plus doxycycline, or erythromycin if available. Ideally, malaria diagnosis should be based on a malaria test, and the pneumonia diagnosis should be based on a clinical assessment of respiratory symptoms, but these practices are far from universal. IDCAP sought to increase laboratory tests for malaria suspects and clinical assessments for patients with cough.
IDCAP carried out two training interventions (IMID and OSS) on management of infectious diseases at 36 sites (health centre IVs) in Uganda. The sites were grouped into two study arms: Arm A (intervention) and Arm B (control). All the sites received IMID, and OSS was implemented at Arm A sites for the intervention period.
IMID was based at the Infectious Diseases Institute (IDI) in Kampala, Uganda and OSS was given as a 2-day practical training at sites in Arm A every month for a period of 9 months. More about the project design and implementation is given in [Reference Weaver16, Reference Naikoba19] and IMID and OSS have been described in [Reference Miceli15].
IMID and OSS were evaluated by using performance indicators that focused on patient assessment and screening, treatment, prevention and referral and follow-up [14]. For the model, we used four indicators: (i) proportion of patients triaged, and proportion of patients who received appropriate treatment, which reflected both a correct prescription and the drugs in stock, for (ii) malaria, (iii) pneumonia, and (iv) emergencies. To link the model with the interventions, we related recovery rate and rate out of emergency (severe disease class) in the model with the performance indicators. The general form of the recovery rate and the rate out of emergency are given in the Supplementary material.
Malaria and pneumonia data
The numbers of malaria and pneumonia cases for the simulated site were based on data from the 18 study sites. The numbers of malaria and pneumonia cases were collected for 23 months, divided into four time periods: baseline, IMID + OSS intervention, break, and OSS follow-up. The simulated site used two estimates of the numbers of malaria and pneumonia cases per site in Arm A for each month: baseline and IMID + OSS intervention. Note that predicting the number of malaria cases for all Arm A sites and taking the average would give the same result as that of the simulated site.
To estimate the number of malaria cases, we used a linear, mixed-effects model with random effects for each site. The dependent variable was the number of malaria cases per month in each site. The independent variables were calendar month, year, time period × arm interactions, patient age group, entomological inoculation rate at the site, and facility characteristics. The estimated coefficients were used to predict the number of cases for a site with the average entomological inoculation rate and facility characteristics of Arm A in the absence of interventions, and with IMID and OSS. Figure 2(a–c) shows two estimated numbers of malaria cases for age groups [0,5), [5,14) and [14,50), respectively. The number of pneumonia cases does not change with time and the baseline values of pneumonia cases for the three age groups, [0,5), [5,14) and [14,50), are given in Table 1. Table 1 also has proportions of individuals that have severe malaria, severe pneumonia and severe co-infection, and the proportions of symptomatic malaria-pneumonia individuals that recover from malaria, pneumonia and malaria-pneumonia co-infection.

Fig. 2. Unpublished data: malaria cases for baseline, Integrated Management of Infectious Diseases (IMID) combined with On-site Support Services (OSS) for age groups [0,5), [5,14) and [14,50) from Arm A, respectively.
Table 1. Number of pneumonia cases at baseline, proportions of individuals with severe malaria-pneumonia co-infection, q, severe pneumonia, q1 and severe malaria, q2 and proportion of symptomatic malaria-pneumonia co-infected individuals that recover from malaria-pneumonia co-infection, z, pneumonia, z1 and malaria, z2

Fitting intervention data and effect of IMID and OSS
In fitting IMID combined with OSS data, we change the parameters of recovery rate and the rate out of emergency according to the changes in the indicators after the intervention. We make use of the following formula:
 $$\eqalign{& \hbox{indicator after intervention } \cr & \quad= \hbox{indicator before intervention} \cr & \quad \times [ 1 + (\hbox{coverage of intervention } \cr & \qquad \times \hbox{impact of intervention on indicator}) ].} $$
The coverage of the intervention was expressed as the percentage of patients that were attended to by MLPs who had taken part in IMID training for the case of IMID intervention and those that had attended OSS for the case of OSS intervention.
The impact of IMID and OSS on the malaria and pneumonia performance indicators are reported in [Reference Weaver16, Reference Mbonye20] and in Table 2 and the estimated parameters for the model are presented in Table 3. To obtain the effect of IMID and combination of IMID and OSS (IMID + OSS) on number of cases, deaths and incidence, we calculate the difference between IMID or combination of IMID and OSS values and baseline values and divide by baseline values. The incremental impact of OSS was found by subtracting the combined intervention values from IMID values and dividing by IMID values.
Table 2. Impact of IMID and OSS on malaria and pneumonia indicators compared to baseline

IMID, Integrated Management of Infectious Diseases, OSS, On-site Support Services.
Table 3. Estimated parameters with model baseline fit – all rates are per month

Human and mosquito populations
We use a human population of ~36 000 which was the average population of the 18 study sites in Arm A. This average is based on the 2002 Census data for the 18 sub-counties served by the sites in Arm A, and projections for 2009 [21]. This number is divided into the respective classes of susceptibles, malaria, pneumonia and co-infection.
The population for the mosquitoes is determined by using the Entomological Inoculation Rate (EIR). EIR is expressed in terms of average numbers of mosquito infective bites per person per year [Reference Yeka5]. The population of mosquitoes at an average site is ~224 946.
Fitting baseline malaria data, mosquito birth rate
To fit the model to data, we use an iterated local search-based method which consists of (i) implementing the iterative descent algorithm to obtain a (possible) local optimum, (ii) shaking the solution by randomly changing some of the model's parameters and (iii) performing the iterative descent algorithm again to potentially find a better solution. The goodness of fit is measured as the residual sum of squares (RSS) between monthly malaria cases reported in Arm A and cases simulated by the model.
The data fitted are the number of malaria cases and number of pneumonia cases displayed and given in Fig. 2(a–c) and Table 1, respectively.
In deterministic modelling it is difficult, if not impossible, to capture the irregular variations observed in the number of malaria cases using constant rates. It is known, for instance, that variations in temperature or rainfall can induce significant inferences in the dynamics of mosquitoes. For this particular problem we do not have any knowledge on the changes in temperature or rainfall over the period of study. To overcome this, we allow the birth rate to depend on time to summarize the effect of the external factors on the reproduction of mosquitoes.
Hence, we propose the following hyperbolic tangent function:
 $$f\left( t \right) = b_0 + \; \mathop \sum \nolimits_{\,j = 0}^5 \displaystyle{{\left( {b_{\,j + 1} - \; b_j} \right){\rm e}^{ - k\left( {t - \tau _j} \right)}} \over {{\rm e}^{k\left( {t - \tau _j} \right)} + {\rm e}^{ - k\left( {t - \tau _j} \right)}}},$
where b j is the absolute number of mosquitoes born, t is time, k is the parameter that determines the slope and τ j is the time point at which the value changes from b j to b j+1.
This function is obtained by first finding (constant) birth rates b j , that would allow the model to capture the maximum/minimum prevalence observed at time t i . Next we use the hyperbolic tangent functions to connect these points in a smooth manner. The gradient at which this function jumps from b j to b j+1 is controlled by the parameter k which is varied, together with rates b j ’s, to obtain the best fit to the data.
RESULTS
Malaria
Figure 3(a, c, e) show a decrease in the number of malaria cases after the intervention of IMID and IMID + OSS for the [0,5), [5,14) and [14,50) age groups, respectively. This decrease in the number of malaria cases translates to a decrease in malaria prevalence as illustrated in Figure 3(b, d, f), accordingly.

Fig. 3. (a, c, e) Model fit to malaria cases after intervention of Integrated Management of Infectious Diseases (IMID) and IMID + On-site Support Services (OSS) for age groups [0,5), [5,14) and [14,50), respectively. (b, d, f) Corresponding malaria prevalence for age groups [0,5) and [5,14) and [14,50), respectively.
The average effect of IMID on malaria prevalence is a decrease of 4·2%, 2·5% and 2·5% for the [0,5), [5,14) and [14,50) age groups, respectively. The average effect of IMID + OSS on malaria prevalence is a fall of 16·2%, 26% and 19·8% for the [0,5), [5,14) and [14,50) age groups, respectively. The average incremental impact of OSS on malaria prevalence is a decline of 12·5%, 24·1%, 17·7% for the [0,5), [5,14), [14,50) age groups, respectively.
There is a decline in the number of malaria deaths across all age groups as displayed in Figure 4(a–c). On average, the effect of IMID on malaria deaths is a decrease of ~7·8% for all age groups. For the IMID + OSS intervention, the mean effect is a fall of 30·8%, 64·5% and 52·9% for the [0,5), [5,14) and [14,50) age groups, respectively. The incremental impact of OSS is a decline of 25%, 61·5% and 48·8% for the [0,5), [5,14) and [14,50) age groups, respectively.

Fig. 4. (a–c) Malaria deaths for age groups [0,5), [5,14) and [14,50), respectively. IMID, Integrated Management of Infectious Diseases, OSS, On-site Support Services.
Figure 5 displays incidence episodes of malaria disease for age groups [0,5), [5,14) and [14,50) before and after interventions accordingly. It shows that there is no effect of the interventions on the number of new episodes of malaria disease.

Fig. 5. Malaria incidence before and after interventions for all the age groups. IMID, Integrated Management of Infectious Diseases, OSS, On-site Support Services.
Pneumonia
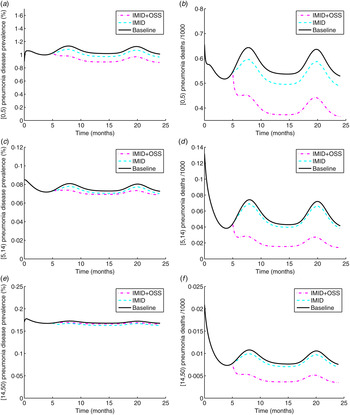
Figure 6(a, c, e), shows a decrease in pneumonia prevalence after the interventions for the [0,5), [5,14) and [14,50) age groups, respectively. However, for the [14,50) age group, the reduction effect on pneumonia prevalence by IMID is more than that of IMID + OSS. The effect of IMID on pneumonia prevalence for the [0,5) age group is on average a decrease of 4·6%. For the [5,14) and [14,50) age groups, it is 3·5% and 3·1% in turn. The average effect of IMID + OSS on pneumonia prevalence is 13·1%, 6·5% and 1·4% for the [0,5), [5,14) and [14,50) age groups, respectively. The average incremental impact of OSS on pneumonia prevalence is 7%, 3·1%, and −1·8% for the [0,5), [5,14), [14,50) age groups, respectively.

Fig. 6. (a, c, e) Pneumonia prevalence for age groups [0,5), [5,14) and [14,50), respectively. (b, d, f) Pneumonia deaths for age groups [0,5), [5,14) and [14,50), respectively. IMID, Integrated Management of Infectious Diseases, OSS, On-site Support Services.
There is a decline in the number of pneumonia deaths across all age groups as displayed in Figure 6(b, d, f). The effect of the interventions on pneumonia deaths is the same as that of the interventions on malaria deaths.
In Fig. 7, there is no change in pneumonia disease incidence with the interventions across all age groups.

Fig. 7. Pneumonia disease incidence. IMID, Integrated Management of Infectious Diseases, OSS, On-site Support Services.
Malaria-pneumonia co-infection
We have considered malaria-pneumonia co-infection for the [0,5) age group. In Fig. 8a , the prevalence of co-infection in the [0,5) age group declines by both interventions. The effect on co-infection prevalence is a reduction of 6·6% by IMID and 23·6% by IMID + OSS and the incremental impact of OSS is a fall of 18·2%.

Fig. 8. (a) Malaria-pneumonia disease prevalence for the [0,5) age group; (b) malaria-pneumonia deaths for the [0,5) age group. IMID, Integrated Management of Infectious Diseases, OSS, On-site Support Services.
In Fig. 8b , the number of malaria-pneumonia deaths for the [0,5) age group decrease with the interventions. The effect on malaria-pneumonia deaths is the same as that of the interventions on malaria and pneumonia deaths.
Impact by proportion triaged
In this section, we investigate the effect of IMID and IMID + OSS contributed by triaging of patients given that the other performance indicators are kept at their baseline values.
Table 4 summarizes the contribution by triaging of patients to the effect of the training interventions. Note that the contribution of triaging to the reduction in number of disease cases ranges from 14% to 91% and that to the reduction in number of deaths is more than 50%.
Table 4. Impact by proportion triaged (%)

IMID, Integrated Management of Infectious Diseases, OSS, On-site Support Services.
DISCUSSION
We have evaluated the impact of two training interventions on prevalence, deaths for malaria and pneumonia. Prevalence of malaria-pneumonia for the [0,5) age group is estimated at 0·52% at baseline while in other studies it ranged from 4% to 37% [Reference Bassat1–Reference Källander, Nsungwa-Sabiiti and Peterson3, Reference Berkley8, Reference Evans9, Reference Sigaúque22]. However, it is important to note that some of these studies were based on presumptive treatment rather than laboratory diagnosis for malaria and clinical assessment for pneumonia [Reference Källander, Nsungwa-Sabiiti and Peterson3].
There is a reduction in the prevalence of disease cases because the duration of disease is reduced with appropriate treatment. It should be noted that laboratory testing decreased inappropriate treatment for malaria for patients with negative malaria test results, and improved the availability of appropriate treatment for patients with positive results.
There was no change in incidence, because this reduction in the parasite population would not be large enough to prevent new infections. The proposed reason for this is that the interventions did not reduce the probabilities of transmission of infection.
The percentage reduction by IMID + OSS in the number of deaths for either malaria or pneumonia in the [0,5) age group translates to saving a life of a child per month. Moreover, the contribution of proportion triaged to the effect of the interventions with regard to deaths is more than 50% which highlights the importance of ETAT of patients to reduce mortality as has been noted previously [Reference Molyneux, Ahmad and Robertson23, Reference Clark24].
In previous research [Reference Ssekabira13], the impact of a team-based malaria training and surveillance improved performance indicators such as the proportion of patients who were tested for malaria and the proportion of patients with negative test results who were not treated for malaria. However, this study did not go ahead to investigate what effect improvement of these indicators would have on population outcomes such as prevalence, incidence and mortality.
There are a number of limitations to this study. One of them being that the percentage of patients with accurate diagnostic data for pneumonia was low. Thus we relied on the malaria data in estimating coverage of IMID + OSS.
It is also important to note we did have malaria test results for all malaria suspects and clinical assessment results for pneumonia suspects. Although IMID- and OSS-trained clinicians refer malaria suspects for malaria tests and perform the clinical assessment for pneumonia, not all clinicians performed these diagnostic tests or assessments for all patients. Thus our estimates for number of malaria and pneumonia cases assumed the same prevalence in patients with valid diagnostic results as those without.
We must also stress that the deterministic approach adopted in our mathematical modelling, a suitable representation of disease spread within large populations, succeeded in capturing the average disease transmission dynamics. This method, however, has the disadvantage of not considering the full range of possible disease outcomes and quantifying their likelihood. In order to address this shortfall, a more realistic approach that allows for Bayesian inferences on the model parameters, can be considered to accurately assess the potential risk of infection/death.
It has been shown that both of the training interventions lead to a reduction in the number of deaths and prevalence of disease, but have no effect on incidence of disease. Generally, IMID + OSS and OSS alone perform better than IMID, although IMID also has considerable impact. The implication for this is that supervision and practical training are important in case management and that core IMID training is enhanced when a practical component is applied with it.
SUPPLEMENTARY MATERIAL
For supplementary material accompanying this paper visit http://dx.doi.org/10.1017/S0950268816002107.
ACKNOWLEDGEMENTS
We extend our thanks to all who participated in the collection and analysis of data in the IDCAP study. This study was supported through grant number 94 298 to Accordia Global Health Foundation from the Bill and Melinda Gates Foundation. http://www.gatesfoundation.org/Pages/home.aspx.South African centre for Epidemiological Modelling and Analysis (SACEMA) also supported this work.
DECLARATION OF INTEREST
None.
APPENDIX
Model equations
 $$\eqalign{& \displaystyle{{{\rm d}S_j} \over {{\rm d}t}} = B_j + \eta _iS_{\,j - 1} + r_{P_j}P_j + r_{M_j}M_j + r_{C_j}C_j - \left( {\lambda _{P_j}p_j^{\prime} + p_j\vartheta _{P_j} + \lambda _{vh_j}m_j^{\prime} } \right)S_j - \left( {m_j\vartheta _{M_j} + \mu _j + \eta _{i + 1}} \right)S_j, \cr & \displaystyle{{{\rm d}P_j} \over {{\rm d}t}} = \eta _iP_{\,j - 1} + \left( {\lambda _{P_j}p_j^{\prime} + p_j\vartheta _{P_j}} \right)S_j + z_1r_{P_j}C_j + \theta _jq_{P_j}E_j - \left( {\lambda _{vh_j}m_j^{\prime} + \; m_j\vartheta _{M_j} + r_{P_j} + \alpha _{P_j} + \mu _j + \eta _{i + 1}} \right)P_j, \cr & \displaystyle{{{\rm d}M_j} \over {{\rm d}t}} = \eta _iM_{\,j - 1} + \left( {\lambda _{vh_j}m_j^{\prime} + m_j\vartheta _{M_j}} \right)S_j + z_2r_{M_j}C_j + \theta _jq_{M_j}E_j - \left( {\lambda _{P_j}p_j^{\prime} + \; p_j\vartheta _{P_j} + r_{M_j} + \alpha _{M_j} + \mu _j + \eta _{i + 1}} \right)M_j, \cr & \displaystyle{{{\rm d}C_j} \over {{\rm d}t}} = \eta _iC_{\,j - 1} + \left( {\lambda _{P_j}p_j^{\prime} + p_j\vartheta _{P_j}} \right)M_j + \left( {\lambda _{vh_j}m_j^{\prime} + m_j\vartheta _{M_j}} \right)P_j + \theta _jq_jE_j\; \- \left( {z_1r_{P_j} + z_2r_{M_j} + \; zr_{C_j} + \alpha _{C_j} + \mu _j + \eta _{i + 1}} \right)C_j, \cr & \displaystyle{{{\rm d}E_j} \over {{\rm d}t}} = \eta _iE_{\,j - 1} + \alpha _{P_j}P_j + \alpha _{M_j}M_j + \alpha _{C_j}C_j\; \ - \left( {\theta _j + \mu _{E_j}} \right)E_j.} $$
where B
j
= 0 for j = 2, 3 and η
0 = 0 and $\lambda _{vh_j} = \displaystyle{{\beta _{vh}^j I_v} \over N},\; m_j^{\prime} = \gamma _{M_j}\left( {1 - m_j} \right) + \delta _{M_j}m_j.\; \beta _{vh}^j $
is the rate at which a vector (mosquito) infects a human, I
v
is the infected vector (mosquito) population and N is the total human population.
$\lambda _{vh_j} = \displaystyle{{\beta _{vh}^j I_v} \over N},\; m_j^{\prime} = \gamma _{M_j}\left( {1 - m_j} \right) + \delta _{M_j}m_j.\; \beta _{vh}^j $
is the rate at which a vector (mosquito) infects a human, I
v
is the infected vector (mosquito) population and N is the total human population.
 $$\lambda _{P_j} = \displaystyle{{\beta _p\,\!\!^j I_v} \over N},\; p_j^{\prime} = \gamma _{P_j}\left( {1 - p_j} \right) + \delta _{P_j}p_j.$$ $\beta _p\,\!\!^j $
is the infection rate for pneumonia. I
p
is the population infected with pneumonia. The mosquito dynamics are given by
$\beta _p\,\!\!^j $
is the infection rate for pneumonia. I
p
is the population infected with pneumonia. The mosquito dynamics are given by
 $$\displaystyle{{{\rm d}S_v} \over {{\rm d}t}} = b_v - \left( {\lambda _{hv_1} + \lambda _{hv_2} + \lambda _{hv_3}} \right)S_v - \mu _vS_v,$$
 $$\displaystyle{{{\rm d}I_v} \over {{\rm d}t}} = \left( {\lambda _{hv_1} + \lambda _{hv_2} + \lambda _{hv_3}} \right)S_v - \mu _vI_v,$$
where $\lambda _{hv_j} = \displaystyle{{\beta _{hv}^j I_M} \over N},\; j = 1, \; 2, \; 3.$ $\beta _{hv_j}\; $
is the rate at which a vector (mosquito) becomes infected by biting an infected human and I
M
is the malaria-infected human population. b
v
is the number of mosquitoes born per unit of time, μ
v
is the death rate of mosquitoes.
$\beta _{hv_j}\; $
is the rate at which a vector (mosquito) becomes infected by biting an infected human and I
M
is the malaria-infected human population. b
v
is the number of mosquitoes born per unit of time, μ
v
is the death rate of mosquitoes.
The differential equations above are simulated deterministically. That is, one set of parameter values and initial conditions gives the solution to this system of equations. This solution comprises the number of individuals/mosquitoes in the different compartments. These are then used to calculate measures such as prevalence, incidence and also to calculate proportions of triaged individuals and number of deaths.
Model parameters
Table A1. Variables, parameters and their descriptions

Table A2. Demography parameters and parameters of malaria

Table A3. Parameters of pneumonia