


INTRODUCTION
The World Health Organization (WHO) reported in 2005 that diarrhoeal diseases accounted for 18% of the deaths among children aged <5 years [1]. Although the deaths caused by diarrhoeal diseases are gradually decreasing, they are still a significant public health problem especially for children in developing countries.
Cholera is an important diarrhoeal disease and is considered to be a disease of poverty. It is a major health problem for those living in places where the public health system is underdeveloped or collapsed. However, the case-fatality rate of cholera could become less than 1% if prompt and adequate medical measures are taken [2]. Therefore, detecting or predicting an epidemic as early as possible would be helpful for public health authorities to prepare for disease intervention and prevention. Previous studies demonstrated a strong correlation between climate and infectious diarrhoeal diseases including epidemics of cholera [Reference Colwell3–Reference Pascual, Bouma and Dobson11]. The WHO emphasizes the importance of an early warning system for infectious disease epidemics based on climate data [12]; however, studies to establish early warning systems of practical use are still being assessed.
Cholera is endemic in Bangladesh where there are two epidemic seasons per year: a spring epidemic around April (just before the monsoons) and an autumn epidemic occurring during September–December (at the end of the monsoons) [Reference Longini13]. This seasonality suggests some climatic factor(s) may be associated with epidemic cholera. In addition, there is an inter-annual variation in the scale of the epidemic cholera and the pattern of the seasonal cycle in the Bengal area spanning Bangladesh and India [Reference Bouma and Pascual9]. Sea-water temperature variation in the Pacific caused by the El Niño Southern Oscillation (ENSO) plays a major role in the inter-annual variation, including the seasonal modulation of cholera in Bangladesh [Reference Pascual6, Reference Bouma and Pascual9, Reference Rodó10]. The sea surface temperature in the Bay of Bengal is a key mediating factor for the ENSO effect [Reference Lobitz8, Reference Bouma and Pascual9] and affects a complex ecology system controlling the persistence and proliferation of Vibrio cholerae, virulent strains of which are responsible for cholera, in its natural habitat, brackish water and the estuarine environment [Reference Colwell3, Reference Huq14–Reference Colwell and Huq17]. Further studies concerning the regional variables mediating the ENSO effect locally are necessary [Reference Pascual, Bouma and Dobson11].
We hypothesized local climatic variables may correlate with and precede the local sea surface temperature variation and could be useful for an early warning system for cholera. Local atmospheric temperature affects local water temperature in Bangladesh and ultimately mediates the ENSO effect [Reference Pascual6]. Rainfall is one of the mediating factors for the ENSO effect and can affect concentration of the pathogen in the aquatic environment and human exposure to the pathogen [Reference Pascual6, Reference Pascual, Bouma and Dobson11]. Atmospheric temperature data and rainfall data are usually available from local authorities. We evaluated whether these simple local climatic valuables could be useful predictors for the number of cholera patients in Bangladesh using a powerful statistic, regression analysis. We focused on the number of patients due to V. cholerae O1 infection (hereafter abbreviated as O1 cholera patients) in children aged <10 years. Case rates were highest among the 2–9 or 5–9 years age groups in previous epidemiological studies carried out in Bangladesh [Reference Hughes18, Reference Faruque, Fuchs and Albert19]. We presume the <10 years age group more precisely reflects the scale of exposure to V. cholerae than do persons in other age groups who are mostly asymptomatic due to acquired immunity. We studied cholera cases due to V. cholerae serovar O1 because this serotype was a major cause of epidemic cholera among children throughout the study period in Dhaka City.
METHODS
Patient data
We obtained the daily data of O1 cholera patients during the 20-year period from 1983 to 2002 from International Centre for Diarrhoeal Disease Research, Bangladesh (ICDDR,B). Data of the surveillance for aetiologies of diarrhoea at Dhaka Hospital of ICDDR,B have been recorded since 1979 [20]. Diarrhoeal stool from every 25th patient until 1995 and every 50th patient from 1996 onwards was examined for aetiologies and recorded at ICDDR,B. We extracted the data for O1 cholera patients aged <10 years, and estimated the monthly total number of O1 cholera patients aged <10 years. The monthly patient data were used for the statistical analysis.
Climate data
We obtained the daily maximum temperature, minimum temperature, and rainfall in Dhaka City that were recorded by the Bangladesh Meteorological Department during the period from 1983 to 2001. When the daily data were missing, we interpolated the data by calculating the means from the daily data before and after the missing day(s). We calculated the monthly average for the maximum temperature in Celsius (maxt), minimum temperature in Celsius (mint), and the monthly total rainfall in millilitres (rain) from the daily data; and used these monthly data for the following analyses.
Statistical analysis
Spectral analysis was performed to examine the periodicity in the number of monthly O1 cholera patients.
Autoregression analysis was used to examine the association between lagged climate data using maxt, mint, and rain and number of O1 cholera patients aged <10 years. The time lag of the climate data was termed ‘lag 1’ meaning 1 month preceding the original patient data and was independently set for each of the three climate variables. The range of the climatic lag was determined based on the result of the spectral analysis which was carried out before the autoregression analysis. Each of the three independent climate data at different lag times was combined to create the lagged climate datasets (e.g. lag 3 for maxt, lag 1 for mint and lag 4 for rain). The lagged climate datasets were compared to the patient data for autoregression. Fitness of the autoregression model was evaluated based on the P values of the coefficients of the equation and Pearson's correlation coefficient between the number of patients predicted by the autoregression model and the observed number of patients. A P value of ⩽0·05 for the coefficient was considered to be significant. We also evaluated the predictability of the scale of the epidemic as follows. The prediction was arbitrarily defined as ‘well-predicted’ if the number of patients predicted at a time-point by the autoregression model was within the range of 0·8–1·2 times the number of observed patients.
Statistical analyses were performed using the software program SPSS trends 11.5 J (SPSS Inc., Chicago, IL, USA).
RESULTS
Figure 1 shows the time-series change in the monthly number of O1 cholera patients aged <10 years from 1983 to 2002. The total sample size of the subjects studied over the 20-year period was 153 775. There was no visually detectable trend in the time-series change during this study period. The unusually large numbers of patients in 1997 and 1998 are considered to be due to the deterioration of sanitary conditions after floods around Dhaka City in these years. The spectral analysis shows a 6- to 7-month periodicity in the numbers of monthly O1 cholera patients during the study period (Fig. 2). This indicates the peak of O1 cholera epidemics occur nearly every half year. Therefore, we set time lags for the climate variables from 0 to 6, i.e. 0, 1, 2, 3, 4, 5, and 6; and created new time-series data using the combination of each of the lagged climate data. A total of 343 (=73) combinations of lagged climate data were created and tested against the observed patient data using autoregression. During the autoregression analysis, we noted when we set ‘lead 1’, which means the patient data was shifted 1 month to the past (opposite of the lag), we could obtain very significant Pearson's correlation coefficients between the numbers of patients predicted by the autoregression model and the real numbers of observed patients. Therefore, we decided to perform the analysis using patient data with lead 1. Both Pearson's correlation coefficients and P values for all of the coefficients of the autoregression equations were significant for the combination of climate variables listed in the Table. Residuals of the autoregression were mostly white noise (data not shown). Of the combinations of climate variables listed in the Table, the combination maxt (lag2) – mint (lag4) – rain (lag3) was judged to be the most suitable for the prediction model because the Pearson's correlation coefficient was the highest and the lags were in the range for practical use (discussed in detail below). The equation to predict the monthly number of O1 cholera patients aged <10 years (lead 1) using this lagged climatic combination is as follows:
where r(t)=0·663 [r(t−1)]+u(t), r(t) is the residual, and u(t) is the white noise.
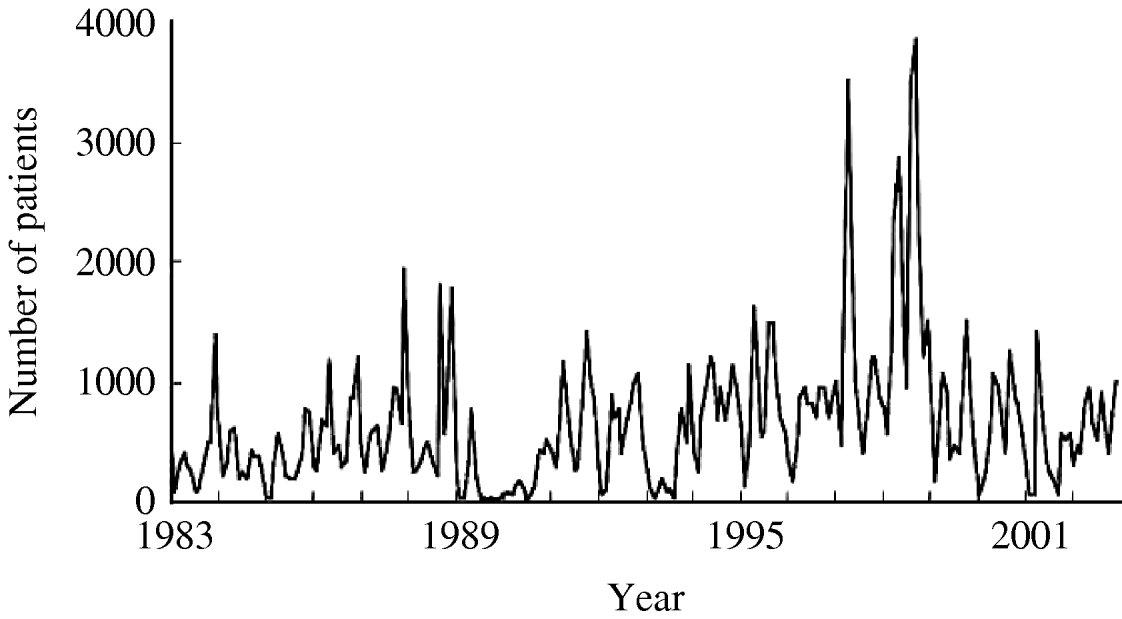
Fig. 1. Number of monthly O1 cholera patients aged <10 years in Dhaka City between 1983 and 2002.
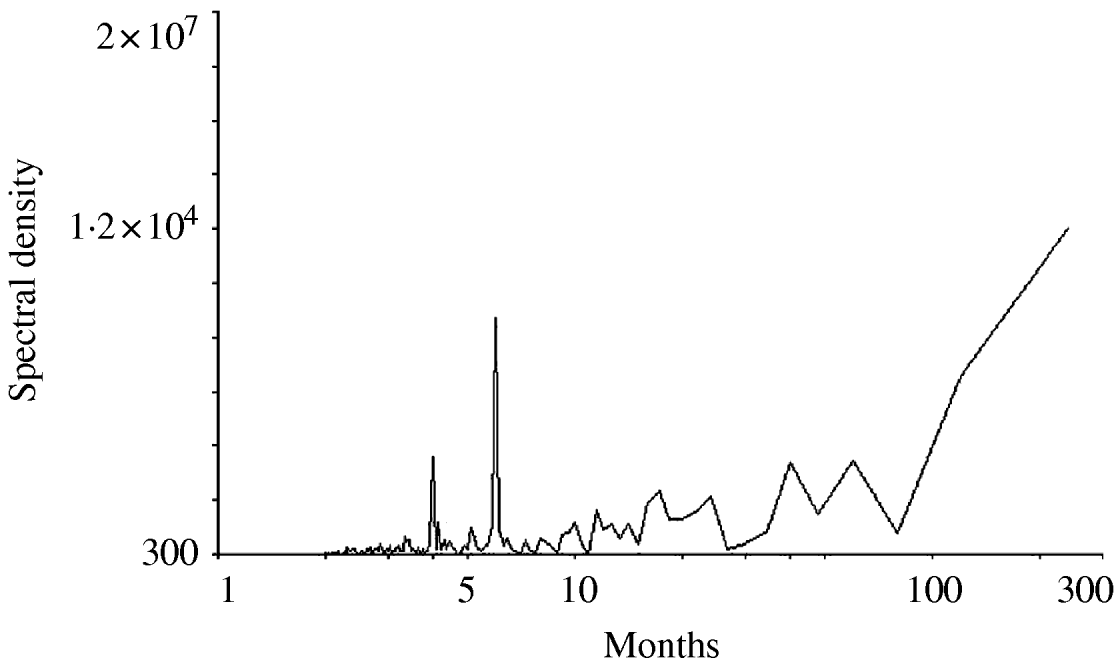
Fig. 2. Result of the spectral analysis for the monthly numbers of O1 cholera patients aged <10 years in Dhaka City between 1983 and 2002.
Table. Combinations of lagged climate data showing significant P values of the coefficients of the autoregression equation and high Pearson's correlation coefficient between the numbers of patients predicted by the autoregression model and the observed patient numbers set at lead 1

maxt, Maximum temperature; mint, minimum temperature; rain, rainfall.
* P<0·001
† P⩽0·05.
Figure 3 shows a graphic comparison of the numbers of patients predicted by this equation and the actual numbers of observed patients. As shown in this Figure, the tendency of the change in the numbers of predicted patients, i.e. seasonal variation, agrees well with the numbers of observed patients. When we examined the difference between the numbers of the observed and predicted patients at a time-point by the standard we arbitrarily set (explained in the Methods section), the number of patients was judged to be ‘well predicted’ on 39·4% of the all time-points. To evaluate the contribution of the climate variables and the effect of the residual in the above equation to the numbers of predicted patients, we graphically compared the number of patients predicted by the equation (Fig. 4, grey dotted line) and those by the modified equation where the residual, r(t), was removed from the original equation (Fig. 4, black line). The difference between the two lines is not very small. This is discussed below.

Fig. 3. Comparison of the monthly numbers of predicted and observed O1 cholera patients aged <10 years between 1983 and 2002. The numbers of predicted patients were calculated by the autoregression equation explained in the text.

Fig. 4. Comparison of the monthly numbers of O1 cholera patients aged <10 years between 1983 and 2002 predicted by the autoregression equation with (![]() ) and without (––––) the residual.
) and without (––––) the residual.
DISCUSSION
This work demonstrates an approach to formulate a simple autoregression model to predict the numbers of monthly cholera patients using a lag in monthly climate data. By setting the lead to 1 for the patient data, the autoregression model using the combinations of climate variables listed in the Table was found to predict the number of patients significantly (Pearson's correlation coefficient >0·910). If the combination containing lag 0 (climate data collected in the current month) in any of the climate variables is used to predict the number of patients at lead 1 (number of patients occurring next month), this means the epidemic may start 1 month after the climate data are collected. This short prediction gives no time for the authorities to prepare for an epidemic. For this reason, we judged the combination maxt (lag2)−mint (lag4)−rain (lag3) is practical for prediction. Climate data collected during the preceding 2–4 months could be used to predict the numbers of patients during the next month. There is sufficient lead time to allow practical mobilization of medical resources.
maxt, mint, and rain values ranged from 22·8°C to 36·5°C, from 11·3°C to 28·1°C, and from 0 mm to 707 mm (data not shown) during the study period and their coefficient ranges were −108·2 to 84, −34·8 to 48·4, and −0·48 to 0·71, respectively (Table). This shows the contribution of rain for the prediction is the smallest and maxt is the most important of the three climatic variables. There is a debate concerning the role of rainfall contributing to epidemic cholera [Reference Pascual, Bouma and Dobson11]. Our data suggests the contribution of rainfall is minor or may not affect epidemic cholera. The lag in the climate variables shown in the Table varied considerably. This shows the maxt value must be high when the coefficient of maxt is positive to predict a large number of patients during an epidemic season. This can happen when the lag is 0 or 5 (Table). if the coefficient of maxt is negative, the maxt value must be small to predict a large number of patients. This can happen when the lag is 2 or 3 (Table). Our spectral analysis shows, as previously reported, the peak of O1 epidemic cholera occurs nearly every half year (Fig. 2). Assuming the increased atmospheric temperature mediates the ENSO effect to increase the sea surface temperature, then the predicted increase in the number of patients showing a lag 0 or 5 may correspond to the epidemic season and a lag 2 or 3 corresponds to the intermediate between the epidemic seasons.
The equation we selected to closely fit observation was the one that exhibited the highest Pearson's correlation coefficient (0·952). The equation states the lower the maxt (2 months before) and mint (4 months before) and the higher the rain (3 months before) were, the higher the number of cholera patients 1 month after the present time will be. This equation predicts well the seasonal variation of epidemics depicted in Figure 3, however, it could only accurately predict the scale of epidemics at 39·4% of all the time-points according to our arbitrarily determined standard.
We conclude the beginning of an epidemic can be predicted using the climate variables; but the climate data are not precise enough to estimate the scale of the epidemics. Figure 4 shows, as previously reported, the fluctuation in the numbers of the patients due to the three climate variables remained within a narrow range (about 500) and suggests the scale of epidemics largely depends on other factors [r(t−1) in the residual of the equation]. Climate change, e.g. high temperature, triggers proliferation of virulent strains of V. cholerae in the natural environment. A virulent strain when propagated to a large number causes infection in a human community where its spread may largely depends on factors not directly related to climate factors. These include poor hygiene, overcrowding, and herd immunity. Abrupt breakdown of sanitation due to civil wars and natural disasters like flood can also lead to large epidemics. As such, it is not easy to predict the disasters in advance by consulting climate variables.
Our investigation has the following limitations. First, we did not include population change dynamics in the Dhaka target population. We used the absolute numbers of O1 cholera patients aged <10 years at a hospital in Dhaka City, but we did not correct it for the population change in this area for the following reasons. We roughly estimated the population change in the children aged <10 years in Dhaka City; and concluded this would not significantly influence the result of our regression analysis during the study period (data not shown). Therefore, we avoided correcting the original data using a population estimation method that may not be reliable. Second, we presumed all epidemics that peak in the spring and autumn were caused by an unknown but identical mechanism; however, we have not identified this mechanism. Finally, we did not include non-climate factors in the prediction model since they are outside of the scope of this study. Other reports suggest it is important to include non-climate factors and factors that are indirectly affected by climate to improve the prediction model [Reference Pascual6, Reference Pascual, Bouma and Dobson11, Reference Huq21–Reference Koelle23]. These factors include herd immunity, nutrition, seasonal change in community behaviour, sanitary conditions, socioeconomic conditions, and bacterial change by mutation. However, each of these factors is difficult to define in absolute numbers and thus would be difficult to use in a mathematic formula.
In conclusion, our study does demonstrate simple climate variables such as atmospheric temperature and rainfall may be useful climate variables for early warning of epidemic cholera and may be a good basis for further regression using improved data collection to include the other factors. The most conservative interpretation of this study is that this conclusion applies only to the O1 epidemic among the children aged <10 years in Dhaka City, but this concept may be expanded to include the other aetiological agents (serovar O139), other age groups, and other localities in future studies.
ACKNOWLEDGEMENTS
This study was supported by Grants-in-Aid for Scientific Research of the Education Exploratory Research ‘Statistical research on the relationship between prevalence of epidemic diseases and meteorological disasters: Case study in Bangladesh (15P-1)’, based on the agreement for joint research between the Disaster Prevention Institute, Kyoto University, and ICDDR,B; and was also funded by The Waksman Foundation of Japan Inc., and The Yakult Research Foundation for Bioscience.
DECLARATION OF INTEREST
None.


