INTRODUCTION
Varicella seroprevalence studies conducted in countries with tropical or equatorial climates (warm and humid year round) have found that a significant proportion (∼20%) of adolescent and young adults are susceptible to varicella compared to <5% of similar age living in cold climates [Reference Sengupta and Breuer1]. Populations from Asia, the Caribbean, and Central America are most likely to be susceptible. This is due to the fact that varicella occurs at an older mean age in tropical countries compared to cold countries (10–15 years vs. ∼5 years) [Reference Sengupta and Breuer1]. The majority of migrants arriving in cold climates were born in countries that are warm and humid year round. They are therefore more likely to be susceptible compared to host populations due to the difference in varicella epidemiology between these climates and the lack of routine varicella vaccination programmes in the source countries. This is important, as the severity of varicella increases with age – including risk of complications, hospitalization and death [Reference Choo2, Reference Galil3].
Varicella is a highly contagious airborne disease, which in the pre-vaccination period was the most common vaccine-preventable disease in Canada resulting in ∼350 000 cases/year (95% of the birth cohort) and with a hospitalization rate of 3–6/100 000 population per year. It affected primarily young children, caused considerable morbidity, and cost CAN$122.4 million annually in Canada from a societal perspective (direct and indirect costs) [Reference Law4]. Pre-vaccination varicella epidemiology is similar in the USA and other European countries with cold climates [Reference Sengupta and Breuer1]. Universal routine childhood varicella vaccination programmes were therefore, introduced in the USA (1995) and Canada (∼2005) and have resulted in a marked decrease in the numbers of varicella-associated medical consultations, hospitalizations and deaths [Reference Kwong5–Reference Nguyen, Jumaan and Seward7]. Migrant populations are not routinely given varicella vaccination after arrival in most host countries in North America and Europe and as a result probably carry an increased burden due to varicella. This is supported by the fact that there have been several reported outbreaks of severe varicella involving young adult migrants [8–Reference Gabutti13]. Furthermore, the risk of varicella-associated hospitalizations and mortality is higher in certain foreign-born groups compared to host populations [Reference Nguyen, Jumaan and Seward14–Reference Herrin and Gray16]. We conducted a seroprevalence study in newly arrived adult migrants in Montreal, Quebec, Canada to identify the proportion susceptible to varicella and the predictors of susceptibility. Characterizing and identifying groups at highest risk is essential for developing the most effective targeted varicella vaccination programmes.
METHODS
Patient sample
Adult migrants (aged ⩾18 years) who had lived in Canada for ⩽5 years were recruited between October 2002 and December 2004. The provincially funded universal childhood varicella vaccination programme began in January 2006, after recruitment was completed. Patients were identified and recruited consecutively in a convenience sample from two hospitals and three primary-care clinics in the Côte-des-Neiges and Notre-Dame-de-Grâce boroughs of Montreal, Quebec. Individuals who reported having varicella after arriving in Canada were excluded.
Setting
Montreal, Quebec is the second largest metropolitan area in Canada, with a population of 3·58 million persons (in 2006); 20·6% of whom were foreign born [17]. There were 164 246 persons living in the Côte-des-Neiges and Notre-Dame-de-Grâce boroughs of Montreal in 2006; 47% of whom were migrants, representing all regions of the world and 32% of whom had immigrated in the previous 5 years [18]. Study participants were recruited from four clinics (infectious diseases, tuberculosis, family medicine, obstetrics & gynecology) and the postpartum ward at the Jewish General Hospital (a 637-bed, tertiary-care hospital), the tuberculosis and prenatal clinics at Sainte Justine Hospital (a 450-bed paediatric and obstetric hospital), and three primary-care clinics: the Côte-des-Neiges community health centre; Clinique Diamant; and La Clinique Médicale VMS (Vaccination Medicine Spécialisée). All recruitment sites were located within 10 city blocks of each other.
Questionnaire
A questionnaire was administered by a study nurse and information gathered included: age, sex, country and community of origin, immigration class, self-reported socioeconomic status, number of individuals living in the house while growing up, number of rooms in this house, years of formal education, and current and previous occupations of the study participant and his/her parents. An interpreter was used if the participant did not speak either English or French.
Definitions
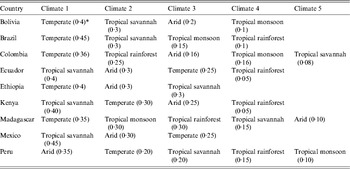
The variables of community of origin, community population, community climate, number of people living in the household, income, and occupation all refer to the environment and household of the participant in their country of origin. The countries of origin of participants were classified into six regions of origin (Latin America & the Caribbean, Sub-Saharan Africa, North Africa & the Middle East, South Asia, East Asia & the Pacific, Eastern Europe & Central Asia) using the World Bank classification [19]. Community of origin referred to the rural area, village, or city of origin of the participant. The climate of the community of origin of each participant was categorized according to the Köppen-Geiger classification [Reference Peel, Finlayson and McMahon20, Reference Kottek21]. The data, as well as the categorizations and the world map of climate regions, were downloaded from http://koeppen-geiger.vu-wien.ac.at/present.htm. To specify the climate of a community, it was first geocoded using Arc GIS-9 software (ESRI data and Maps 9·3, 2008; USA), and the locations, expressed as latitude and longitude, were grouped by climate categories as shown in Table 2: tropical (rainforest, monsoon, or savannah), temperate, arid, and cold (cold, polar) [Reference Peel, Finlayson and McMahon20, Reference Kottek21]. The population for each community of origin was obtained from the mid-year estimates of populations in the 1998 UN Demographic Yearbook and classified as higher (>250 000 population) or lower (⩽25000 population) [22]. The income level was self-reported as low, middle, or high in comparison to other persons in the same community of origin. Large households in the community of origin were defined as having >7 people living in a household and smaller households as having ⩽7 people. This cut-off was chosen because the mean number of people living in a household in our study population was 6·7 ± 3·2 people. The term migrant used throughout the paper refers to foreign-born persons who are permanent or non-permanent residents of Canada [17]. Refugee status was dichotomized as refugees (included refugee or refugee claimant) vs. all others (Table 1).
Table 1. Demographic characteristics

* Included 95 different countries. The top 10 countries were China (n = 142), India (n = 108), Pakistan (n = 87), Mexico (n = 84), Romania (n = 76), Congo (n = 70), Bangladesh (n = 67), Peru (n = 65), Morocco (n = 60), and Sri Lanka (n = 48); and they accounted for 55% of the participants.
Table 2. Susceptibility to varicella, univariate, and multivariable logistic regression

OR, Odds ratio; aOR, adjusted odds ratio; CI, confidence interval.
* Indicates estimates that were statistically significant with a P value <0·05.
Serological testing
Blood samples were obtained from all participants for serological testing. Varicella immunoglobin G (IgG) antibodies were measured using the Dade Behring (Deerfield, USA) ELISA assay. Results were classified according to optical density (OD). OD values >0·20 were considered positive, OD values <0·10 were considered negative, and OD values from 0·10 to 0·20 were considered equivocal. However, participants with positive or equivocal results (OD ⩾0·10) were considered seropositive and immune; those with negative results were considered susceptible.
Statistical analysis
The prevalence [with 95% confidence intervals (CI)] of varicella susceptibility was calculated for the overall study sample, as well as for different strata including; age group, sex, region of origin, climate, community population, household size, refugee status, and time since arrival in Canada (variables thought to be important predictors of susceptibility). Correlations between categorical variable pairs were assessed using contingency tables. Univariate and multivariable logistic regression models were used to test for associations between socio-demographic characteristics and susceptibility, with adjustment for potential confounders. Variables that were not significant in univariate analysis were excluded from the multivariable model since they were not considered to be important predictors of varicella susceptibility (with the exception of sex, since age and sex are generally included in all multivariable models). Variables that were significant in univariate analyses as well as sex and age group were included in the multivariable models. The best model was judged by the significance of individual variables and by the goodness of fit of each model as assessed by Akaike's Information Criterion (AIC); models with lower AIC values suggest better fit. All analyses were conducted with SAS version 9.0 (SAS Institute Inc., USA). Maps showing varicella seroprevalence according to community of origin were generated with Arc GIS-9 software (ESRI data and Maps 9·3).
RESULTS
A total of 1619 migrants were invited to take part in the study, and 1480 (91·4%) agreed to participate. There was no information on the country of origin for the 139 individuals who declined, but they were more often from the postpartum ward than from other recruitment sites. Serological test results for varicella were available for all 1480 migrants who agreed to participate. The socio-demographic characteristics of the study population are presented in Table 1. Study participants had a mean age of 32·2 ± 8·6 years and were predominantly female (67%). They originated from all world regions and while nearly half were refugees or refugee claimants, only 0·8% had lived in a refugee camp.
Overall, 5·9% (95% CI 4·7–7·1) of participants were susceptible to varicella. Only 19 (1·3%) of results were equivocal and were classified as immune. Susceptibility varied significantly by age, climate, community population, household size, and time since arrival in Canada, based on 95% CIs (Table 2). Susceptibility did not vary significantly by sex or refugee status. Climate was a much better predictor of varicella susceptibility compared to latitude or region of origin and was the variable chosen for the multivariable model. Climate was the strongest predictor of susceptibility: 14·1% (95% CI 5·6–22·6) of those from tropical rainforest climates were susceptible compared to 2·5% (95% CI 1·0–4·0) of those from cold, polar or arid climates (Fig. 1, Table 2). Seroprevalence (% immune) decreased with age for all climates and was most frequent in the first year after arrival, although these differences were not statistically significant due to small numbers in each subgroup (Figs 2, 3). In a multivariable logistic regression model (Table 2) adjusted for age, sex, community population, household size, climate, and time since arrival; age and originating from a climate with year-round warmth and humidity were the most important predictors of susceptibility. Specifically, originating from a community with a population <250 000 time since arrival in Canada of <4 years, and living in a household with <7 people were also significant predictors of varicella susceptibility in the multivariable model.

Fig. 1. Varicella susceptibility of migrants by climate classification.

Fig. 2 [colour online]. Varicella seroprevalence (% immune) stratified by age group and climate of community of origin.

Fig. 3 [colour online]. Varicella seroprevalence (% immune) stratified by time since arrival in Canada and climate of community of origin.
DISCUSSION
This is the first study to describe risk factors for varicella susceptibility in migrants from all world regions, after arrival in a cold climate. Our results provide insights into observed differences in varicella epidemiology between tropical and cold countries, and into risk factors for and timing of varicella in migrants after arrival in a cold climate. Young adult migrants from tropical climates with year-round warmth and humidity were the most likely to be susceptible; however, this could be modified by conditions that increased the probability of person-to-person spread of varicella through direct contact such as larger community size or more household crowding.
In our study, climate of origin was the strongest predictor of susceptibility to varicella (Fig. 1, Table 2). We found that migrants originating from climates with the highest temperature and the most months of humidity per year (tropical rainforest), were the most likely to be susceptible, and this decreased with fewer months of humidity and colder temperatures. Differences in temperature and humidity have been shown to affect varicella epidemiology globally. Varicella seroprevalence studies have consistently shown that the age of acquiring varicella in tropical countries is higher than that in cold countries (10–15 years vs. ∼5 years) [Reference Sengupta and Breuer1]. This results in 15–30% of adolescents and young adults from tropical countries being susceptible to varicella compared to <5% in cold countries of the same age group [Reference Sengupta and Breuer1]. This is supported by studies in warm countries such as India, Nigeria and Guatemala, in which varicella incidence was found to be highest during the coolest months of the year [Reference Sengupta and Breuer1]. Similarly, in Thailand the overall varicella susceptibility was much higher in warmer areas of the country (57–58%) than in cooler regions (31–42%) [Reference Lolekha23]. In this same study, the warmer areas also had more rainfall. Equatorial countries such as St Lucia, Sri Lanka and Singapore with heat and high humidity most of the year have among the highest rates of varicella susceptibility compared to other countries [Reference Sengupta and Breuer1, Reference Ooi24–Reference Garnett26]. The observed global differences in varicella epidemiology may be due to the fact that varicella zoster virus (VZV) is a heat-sensitive virus that is not transmitted as efficiently in hot, humid environments [Reference Lolekha23, Reference Mandal27]. Influenza, an enveloped virus like varicella, appears to be transmitted by droplet spread rather than the airborne route, under hot and humid conditions [Reference Nichols28, Reference Lowen and Palese29].
No previous studies of migrants have directly examined the importance of the climate of the source country on varicella susceptibility; however; the characteristics of migrant populations with varicella in several studies suggest that this is the case. For example, most reported varicella outbreaks after arrival in migrants have occurred in individuals originating from places where >50% of the country has a tropical rainforest climate (such as Puerto Rico, the Philippines, southern Sri Lanka) [8–Reference Gabutti13]. Furthermore, migrants from tropical climates are over-represented in varicella-associated hospitalizations in temperate/cold countries. In a US study certain foreign-born groups had increased odds of being hospitalized for varicella compared to the US-born population, including those born in Puerto Rico (6·43), the Philippines (1·88) and other foreign groups (7·33) [Reference Herrin and Gray16].
Interestingly, several studies in migrants from tropical countries after arrival in cold host countries, including Canada, demonstrate that migrants are somewhat less likely to be susceptible (∼10–15% aged 20–30 years) compared to those of a similar age living in tropical countries [Reference Knowles30–Reference Figueira, Christiansen and Barnett34]. This may reflect differences between persons who migrate and those who do not. Our study sample was highly educated and may have been more likely to have grown up in urban areas, which is associated with lower susceptibility. In addition, lower susceptibility may be due to the effect of exposure to a higher force of infection of varicella after arrival in a cold climate. This is supported by the fact that susceptibility was highest in the first year and decreased substantially within 4 years after arrival (Fig. 3, Table 2).
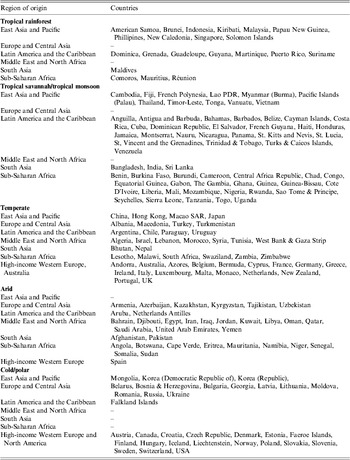
Climate is a stronger predictor of susceptibility to varicella than region of origin, probably because most regions of origin contain several different climates (see Appendix Tables A1–A3 and Fig. 1). To improve the usability of the data on the variability of varicella susceptibility by climate for healthcare providers caring for migrant populations, the following generalizations about the risk of susceptibility to varicella by region of origin can be made: (1) high-risk regions are those nearest the equator including most countries in South Asia, South East Asia & the Pacific, and the Caribbean & Central America; (2) intermediate-risk areas are Eastern Europe, countries with temperate climates in North Africa & the Middle East, Sub-Saharan Africa and China & Japan; (3) low-risk regions are arid/desert and cold/polar climates in North Africa & the Middle East, Central Asia, Pakistan & Afghanistan (South Asia), Western Europe and Australia and, (4) South America is at variable risk as many countries have several different climates (Appendix Table A3).
In our study, age was the second strongest risk factor for varicella susceptibility, with the youngest migrants being the most susceptible. By age 35 years, however, almost all were immune. The exception was migrants from the tropical rainforest climate (hot and humid year-round) where up to 10% of those aged >35 years were susceptible (Fig. 2). A similar pattern has been described in countries with a tropical rainforest climate such as southern Sri Lanka, Singapore, and Indonesia where 15–20% of those aged >35 years were still susceptible to varicella [Reference Sengupta and Breuer1, Reference Ooi24, Reference Liyanage, Fernando and Malavige25, Reference Juffrie35]. The relatively low overall susceptibility of 6% in our study may have been partially due to an ‘older’ mean age of 32 years in our population. Although numbers in subgroups are small, those who were aged <25 years from different climates were more likely to be susceptible (10–25%) than those who were older (Fig. 2). This is further supported by the fact that the mean age of migrants involved in outbreaks after arrival is ∼23 years [8–Reference Gabutti13].
Although susceptibility to varicella is higher in warm, humid climates, several studies suggest that both community and household crowding may modify this if they increase potential transmission through greater direct person-to-person contact. In India and Thailand, persons living in urban settings were less often susceptible than those in rural settings, despite similarly hot and humid climates in both locations [Reference Lolekha23, Reference Mandal27]. Similarly, we found that migrants from smaller communities (⩽250 000population) were almost twice as likely to be susceptible as those from larger communities, even after adjustment for age, climate and time since arrival.
The importance of household crowding as a determinant of susceptibility to varicella in tropical countries was explored in a recent study of a varicella outbreak in Guinea-Bissau. In this study the age of developing varicella was very low (∼4 years) despite its tropical climate [Reference Nichols28]. Although transmission of varicella was fourfold less frequent than what would have been expected in a cold climate, the authors postulated that transmission of the virus was facilitated by greater direct person-to-person contact due to the exceptionally large households (mean 14·5 people) which are common in Guinea-Bissau and many other Sub-Saharan African countries [Reference Nichols28]. This hypothesis is supported by the results of our study as we found that those living in smaller households (⩽7 people) were twice as likely to be susceptible as those in larger households, even after adjusting for age, climate and community size, and time since arrival in Canada. Furthermore, migrants from Sub-Saharan Africa were the least likely to be susceptible (3·5%) compared to individuals from any other region. The mean household size in those from Sub-Saharan Africa was also larger than for other study participants (mean±s.d.: 8·7 ± 4·6 vs. 6·7 ± 3·2 people for world regions, P < 0·0001).
Since the widespread implementation of single-dose childhood varicella vaccination programmes in Canada (∼2005) and the USA (1995), the number of cases, hospitalizations and deaths due to varicella have markedly decreased in all age groups [Reference Kwong5, Reference Nguyen, Jumaan and Seward14, Reference Marin36–Reference Guris38]. Despite these short-term benefits, mathematical modelling studies have warned that over the 10–20 years after introduction of these programmes, there will be an accumulation of susceptible individuals, due to the presence of unvaccinated cohorts and waning immunity in those vaccinated. In addition, through herd immunity, the age of acquiring infection will shift to an older age as it takes longer to be exposed due to lower levels of circulating virus. Once a threshold of susceptible individuals is surpassed, there is the potential for outbreaks in older individuals at higher risk for severe disease, unless they are identified and vaccinated [Reference Brisson and Edmunds39]. A previously unrecognized factor that may amplify the future risk of outbreaks and severe varicella is the accumulating reservoir of susceptible older migrants who are protected from developing varicella after arrival, due to herd immunity conferred by the local childhood varicella vaccination programme. This could be prevented through providing targeted varicella vaccination to all migrants. Moreover, a recent analysis found that it was cost-effective to provide varicella vaccination to adult immigrants and refugees with prior serotesting in most settings, and that it would be cost-saving for most adults aged <35 years [Reference Merrett40].
The major strength of this study is that it is large, includes migrants from all world regions and climates and is the first to describe predictors of susceptibility of varicella in this population before and after arrival in a cold climate. Our results were collected from subjects in the pre-childhood vaccination era in Quebec, and therefore represent the effect of transmission of natural varicella in their countries of origin and in Canada rather than immunity due to vaccination. We suspect that susceptibility in this population in the post-vaccination era may be even higher as they would be protected from developing varicella due to herd immunity [Reference Brisson41].
One potential limitation of our results is the fact that the study population was recruited as a convenience sample of immigrants and refugees seeking healthcare at hospitals and clinics from one area of Montreal, and may not be generalizable to all migrant populations. In spite of this, the age and education level of our study population was similar to all immigrants who arrived in Quebec during the study period [42]. The mean age of the study participants was 32·2 ± 8·6 years and was similar to all immigrants arriving in Montreal, 39% of whom were age 35–44 years [42]. Our study population had a mean of 13·9 years of education and 48% had a university education compared to 61·5% of immigrants arriving in Montreal that had ⩾14 years of education [42]. Although study participants were more likely to be female compared to the source population (67% vs. 50%, respectively), this is unlikely to have a major impact as the susceptibility to varicella between men and women is similar (Table 2). To enhance the relevance of our findings to other settings, we stratified our results by region of origin, refugee status, and various socio-demographic variables. Systematic biases that distort the results in subgroups is possible if the study population seeking healthcare is different than the general migrant population.
In conclusion, a variable proportion of young adult migrants were found to be susceptible to varicella. Important risk factors for susceptibility included climate in the country of origin, age, time since arrival, and community and household crowding in source countries. Susceptible adults are at risk for severe varicella disease and migrants bear a disproportionate risk of varicella outbreaks, hospitalizations [Reference Herrin and Gray16] and associated mortality [Reference Nguyen, Jumaan and Seward14, Reference Rawson, Crampin and Noah15]. Identifying and vaccinating migrants from tropical countries after they arrive in cold climates should therefore be a priority, and has the potential to decrease individual morbidity and mortality and healthcare costs.
ACKNOWLEDGEMENTS
This work was supported by the Fonds de la Recherche en Santé du Québec (grant numbers 24 002–1836) and GlaxoSmithKline (investigator-initiated protocol no. 208 133–177). The funding sources had no role in the design, analysis, or reporting of the study.
DECLARATION OF INTEREST
None.