


Introduction
What citizens think of the functioning of their democracies has been a central concern for political scientists. It has been argued that democratic consolidation is dependent on three processes: behavioural, constitutional, and attitudinal consolidation (Linz and Stepan, Reference Linz and Stepan1996). The first two regard the absence of attempts to create a non-democratic state and the presence of political actors who behave according to procedures and institutions. The third, instead, indicates that the majority of citizens endorse democratic principles. This means that democracy has popular support and it is legitimized. A democracy, to be consolidated, needs a ‘broad and deep legitimation, such that all significant political actors, at both the elite and mass levels, believe that the democratic regime is the most right and appropriate for their society, better than any other realistic alternative they can imagine’ (Diamond, Reference Diamond1999: 65). At least partially, legitimacy is achieved when democracy is able to produce certain outcomes satisfying citizens’ preferences and expectations (Morlino and Montero, Reference Morlino and Montero1995; Chu et al., Reference Chu, Diamond, Nathan and Shin2008). For this reason, indicators measuring attitudes towards democracy have been included in comparative surveys, expanding our knowledge about established and new democracies (see Klingemann and Fuchs, Reference Klingemann and Fuchs1995; Rose et al., Reference Rose, Mishler and Haerpfer1998; Norris, Reference Norris1999a; Chu et al., Reference Chu, Diamond, Nathan and Shin2008). This is a relevant topic to investigate, as bad performance can stimulate demands for political change in consolidated regimes or threaten consolidation in new democracies (Diamond, Reference Diamond1999). Therefore, a good assessment is important in order to understand the state of health of democracies.
By using the special module of the sixth round of the European Social Survey (ESS) (2013) ‘Europeans’ understandings and evaluations of democracy’, including multiple indicators measuring how citizens evaluate a variety of aspects of democracy, and applying factor analysis with a hierarchical extension, this article sets three objectives: (1) to test whether multiple indicators form an underlying trait measuring citizens’ evaluations of democracy; (2) to find the scores of this measure at the individual and country level; and (3) to validate this measure. Indeed, citizens’ evaluations of the performance of democracy are measured using such items, which presents, as is widely argued and despite its broad use, several issues (see Canache et al., Reference Canache, Mondak and Seligson2001; Linde and Ekman, Reference Linde and Ekman2003). Therefore, this article follows the suggestion put forward by Linde and Ekman (Reference Linde and Ekman2003) who call for a test of the validity of such an indicator. By comparing it to a measure based on multiple indicators we may be able to verify whether satisfaction with democracy (SWD) actually gauges the same underlying concept, that is democratic performance.
Moreover, a measure based on multiple indicators allows the assessment of how citizens evaluate the performance of democracy by clarifying the object of this evaluation: democracy. Being a highly debated concept, the uncertainty regarding what it means is reflected in the indicators attempting to measure its performance. Therefore, it is important to first identify what the attributes of democracy are in order to measure how citizens evaluate specific aspects of it. Recent literature on democracy indicates attributes that should be identified and evaluated to for its assessment (see, among others, Altman and Perez-Linan, Reference Altman and Perez-Linan2002; Beetham et al., Reference Beetham, Carvalho, Landman and Weir2008; Roberts, Reference Roberts2010; Levine and Molina, Reference Levine and Molina2011; Morlino, Reference Morlino2011). This article, therefore, provides a conceptual framework to build multiple indicators measuring how citizens evaluate democracy and to obtain a summary measure, which will be compared to other measures of democratic performance (Campbell, Reference Campbell2008; Pemstein et al., Reference Pemstein, Meserve and Melton2010; Bühlmann et al., Reference Bühlmann, Merkel, Muller and Wessels2012), and to the ‘SWD’ item. Eventually, we show the functioning of this summary measure as a dependent and an independent variable to provide further validation.
Orientations towards democracy
The study of citizens’ orientations towards democracy has a long tradition. Almond and Verba (Reference Almond and Verba1963) were among the first to outline a theoretical framework to conceptualize orientations towards democracy by distinguishing between cognitive, affective, and evaluative orientations. Cognitive orientations regard the knowledge citizens have of the political system, its roles, inputs, and outputs. Affective orientations concern the feelings citizens have towards the political system and its roles and performance. Finally, evaluations are citizens’ judgements about the political system and other political objects. These orientations have targets, which Almond and Verba differentiated according to a principle of generality. At one end, there is the ‘general’ political system, the system as a whole, democracy, or any other type of system. At the other end, there is the ‘self’, the individual as a political actor.
When citizens’ evaluations of democracy are studied, the concept of ‘support’ also comes into the picture, which overlaps with orientations. Support can be directed towards three political objects: the political community, the regime, or the political authority (Easton, Reference Easton1975). The first refers to the nation or the broader political system; the second concerns the principles, norms, procedures, and institutions of the regime; while the third regards those positions holding political authority. These objects represent a continuum ranging from diffuse support, to support for the political community, to specific support, to support for political actors. It is argued that specific support is related to the performance of the political objects, such as the institutions or the elite, while diffuse support is related to the legitimacy of the political system and institutions (Dalton, Reference Dalton2004). Others, instead, place regime performance as an intermediate level of support, which refers to the functioning of the political system in practice (Norris, Reference Norris1999a).
Given the conceptual overlap between Almond and Verba’s and Easton’s approaches to the study of political orientations, Dalton (Reference Dalton2004: 23–24) proposes combining the two. On the one hand, there are evaluations vis-à-vis affective orientations. On the other hand, there are the objects of these orientations, such as the political community, the regime, and the political authority. Combining these two dimensions helps to identify the objects of the analysis and the indicators of them.
This article aims to assess how citizens evaluate democracy. Following this classification, democracy is the ‘regime’ that is the object of support, according to Easton (Reference Easton1975), or it is the ‘system as a general object’, according to Almond and Verba (Reference Almond and Verba1963). Therefore, citizens’ evaluations of democracy should refer to their judgement about the functioning of the democratic regime or system in practice.
Measurement
How is citizens’ evaluation of democracy measured? The ‘SWD’ indicator has been the main instrument (see Canache et al., Reference Canache, Mondak and Seligson2001; Linde and Ekman, Reference Linde and Ekman2003). This indicator basically asks how satisfied the survey respondent is with the way democracy works in their country.
Nevertheless, this item has been widely criticized as it is not clear what it actually measures. In a review, Canache et al. (Reference Canache, Mondak and Seligson2001: 507–510) argue that the SWD indicator has different meanings. It can be an indicator of support for incumbent authorities given that it emphasizes the ‘output’ of these actors; a measure of satisfaction with the institutions or structures of the democratic regime; or a measure of evaluation of the political regime. It can also be a ‘summary’ indicator of how respondents evaluate the political community, the regime, and the authority. Therefore, it can be used as an indicator of general support.
The use of the SWD indicator is a standard in the literature. It is hard to find studies employing alternative measures. To cite just a few, the SWD indicator has been used to measure: overall satisfaction with the present democratic political system (Clarke et al., Reference Clarke, Dutt and Kornberg1993); the performance of the democratic political system (Kornberg and Clarke, Reference Kornberg and Clarke1994; Aarts and Thomassen, Reference Aarts and Thomassen2008; Bernauer and Vatter, Reference Bernauer and Vatter2012); its functioning (Klingemann and Fuchs, Reference Klingemann and Fuchs1995; Anderson and Guillory, Reference Anderson, Blais, Bowler, Donovan and Listhaug1997); the perceived efficacy of the regime (Lagos, Reference Lagos2003); how democracy works in practice (Wagner et al., Reference Wagner, Schneider and Halla2009); support for the democratic processes (Dahlberg and Holmberg, Reference Dahlberg and Holmberg2014); short-term evaluations of what the democratic system produces (Curini et al., Reference Curini, Jou and Memoli2012); or democratic responsiveness, that is, whether democracy delivers the goods citizens want (Morlino and Quaranta, Reference Morlino and Quaranta2014; Ceron and Memoli, Reference Ceron and Memoli2016).
The popularity of this indicator, despite its lights and shadows, is probably due to the fact that it is present in most of the publicly available comparative survey projects, providing short-to-long time series for the evaluation of trends (see Dalton, Reference Dalton2004). The SWD indicator is, in fact, included in comparative surveys, such as the Afro Barometer, the Asia Barometer, the Eurobarometer, the Latinobarometro, the Americas Barometer, the Comparative Study of Electoral Systems, the European Values Study, the ESS, the World Values Survey, the International Social Survey Programme, the Central and Eastern Eurobarometer, and the Candidate Countries Eurobarometer.
Data availability is certainly important for comparative research. However, an assessment of how citizens evaluate democracy should take into account several aspects of this regime. Indeed, Linde and Ekman (Reference Linde and Ekman2003: 401) argue that SWD ‘is one indicator of support for the performance of a democratic regime’. Although it has been useful for many scholars to investigate support for democracy in a general sense, it is not known exactly what a respondent has in mind when responding to this indicator (see Norris, Reference Norris1999b; Canache et al., Reference Canache, Mondak and Seligson2001). Therefore, a strategy employing multiple indicators measuring how citizens evaluate the performance of democracy should provide a more nuanced view, and could also show whether the SWD indicator could be considered as a good approximation of the citizens’ evaluation of democracy.
Democracy: what to evaluate?
The concept of democracy, as is well known, is debated. Democracy can be conceptualized, for instance, in terms of procedures, which mostly regulate electoral mechanisms (see Sartori, Reference Sartori1987), and in terms of civil and political rights, which guarantee citizens’ participation in political and social life (see Dahl, Reference Dahl1971). Therefore, democracies are systems allowing citizens to formulate their interests and to communicate their preferences, which are considered to be equal (Dahl, Reference Dahl1971). To ensure these opportunities, democracies have to have some ‘guarantees’, such as freedom of association, freedom of expression and thought, the rights to vote, to run for public office, to campaign and to compete for voters’ support, alternative sources of information, free and fair elections, and the presence of institutions which link government policies to citizens’ preferences. Other empirical definitions also emphasize the importance of the rule of law, that is the ability of democracy to implement and enforce the law, and accountability, that is the ability to hold the government accountable to citizens for it actions (Schmitter and Karl, Reference Schmitter and Karl1991). These definitions not only consider procedures as fundamental elements of democracy, but also deem civil and political rights to be essential.
Which attributes of democracy should be evaluated? It should be clear that the SWD indicator does not tap these aspects, at least not specifically (see Canache et al., Reference Canache, Mondak and Seligson2001). Most of the empirical system-based measures of democracy follow procedural definitions (Munck and Verkuilen, Reference Munck and Verkuilen2002), including attributes such as liberties and popular sovereignty (Bollen, Reference Bollen1980), contestation (Alvarez et al., Reference Alvarez, Cheibub, Limongi and Przeworski1996), competition and participation (Vanhanen, Reference Vanhanen1997), participation, competitiveness, and constraints (Marshall et al., Reference Marshall, Gurr and Jaggers2014), or civil and political rights (Freedom House, 2014). These measures evaluate how democracies perform on the attributes considered and avoid maximalist definitions (Munck and Verkuilen, Reference Munck and Verkuilen2002), but omit important aspects of democracy.
A recent trend in the literature on democracy has started to look at the attributes that make it ‘good’. This approach allows several attributes of democracy to be taken into account and translated into empirical measures. Table 1 reports the attributes of democracy that have been identified in recent studies following this perspective. It can be seen that some of them emphasize the effectiveness of the attributes; that is, how democracies transform opportunities into actual behaviours (Altman and Perez-Linan, Reference Altman and Perez-Linan2002). Others see freedoms and liberties as preconditions, while the objects of assessment are additional attributes (Beetham et al., Reference Beetham, Carvalho, Landman and Weir2008). Some scholars argue that a good democracy depends on procedures – such as electoral decisions, participation, responsiveness, and accountability – rather than on the results (Levine and Molina, Reference Levine and Molina2011), while others see effective and substantive representation as the key elements of a good democracy (Roberts, Reference Roberts2010). Others still identify more attributes, looking at procedures, contents, and the results of democracy (Morlino, Reference Morlino2011); at how the principles of democratic systems are fulfilled through certain functions (Bühlmann et al., Reference Bühlmann, Merkel, Muller and Wessels2012); or at human development and socio-economic conditions (O’Donnell et al., Reference O’Donnell, Vargas Cullell and Iazzetta2004). In general, those who have analysed democratic quality identify a ‘core’, which overlaps with procedures and freedoms, and incorporate other attributes. Thus, a baseline model of democracy is enhanced by adding or stressing certain elements (see Collier and Levitsky, Reference Collier and Levitsky1997).
Table 1 Attributes of democracy

Table 1 shows that democracy has multiple dimensions, and it is therefore too complex to be assessed using just one indicator (or even a few). Indeed, to evaluate in depth how democracy performs several elements have to be taken into account. On the one hand, the literature focussing on orientations towards democracy has mostly used one indicator to measure how citizens evaluate democratic regimes. On the other hand, the literature measuring the level of democracy tends to use a few indicators gauging a finite number of attributes (Munck and Verkuilen, Reference Munck and Verkuilen2002).
Thus, this article extends the number of attributes to build a measure of citizens’ evaluations of democracy. Indeed, the more recent literature on democracy provides guidance in identifying the attributes of democracy that need to be evaluated in order to construct a summary measure.
Data
The sixth round of the ESS (2013) includes the special module ‘Europeans’ understandings and evaluations of democracy’, with data collected on 29 countries: Albania (861 responses), Belgium (1589), Bulgaria (1477), Cyprus (719), Czech Republic (1351), Denmark (1299), Estonia (1633), Finland (1895), France (1667), Germany (2354), Great Britain (1629), Hungary (1463), Ireland (1979), Israel (1419), Iceland (505), Italy (729), Lithuania (1337), Kosovo (762), the Netherlands (1506), Norway (1402), Poland (1251), Portugal (1396), Russia (1444), Slovakia (1556), Slovenia (808), Spain (1466), Sweden (1434), Switzerland (1052), Ukraine (1189). The total sample size is 39,172.Footnote 1 This module comprises a variety of indicators measuring how citizens evaluate different aspects of democratic regimes. In fact, the main criticism of typical survey indicators including the term ‘democracy’ is that is not clear what it means (see Canache et al., Reference Canache, Mondak and Seligson2001). Indeed, democracy is made of several attributes. The ESS special module provides a list of indicators that have been built following research by Morlino (Reference Morlino2011), Bühlmann et al. (Reference Bühlmann, Merkel, Muller and Wessels2012), and Kriesi et al. (Reference Kriesi, Lavenex, Esser, Bühlmann and Bochsler2013) (see Ferrin and Kriesi, Reference Ferrin and Kriesi2016).
To overcome the difficulty of conceptualizing democracy, the module takes a ‘broad’ approach and considers nine general dimensions (ESS, 2013: 6–7): rule of law; vertical and horizontal accountability;Footnote 2 participation; competition; representation; responsiveness; freedom; and equality. These dimensions clearly cover most of the ones used in the literature summarized in Table 1. Therefore, indicators built upon these definitions should measure how citizens evaluate some of the dimensions of democracy (ESS, 2013), and produce a citizen-based measure to evaluate democracy. These dimensions are operationalized using the 14 indicators shown in Table 2.Footnote 3
Table 2 Question wording and scale of the items measuring how citizens evaluate democracy

These indicators represent a great improvement over measures evaluating democracy based on single indicators. The indicators can also be grouped as measures of macro-dimensions of democracy, gauging evaluations of electoral, liberal, social, and direct democracy attributes. Nevertheless, it is expected that the indicators will form a single-latent trait measuring how well democracy performs in the eyes of citizens. This will be a continuum ranging from bad to good. It should be clear that these indicators do not fully cover all the dimensions of different conceptualizations of democracy. Nevertheless, the survey provides a number of indicators that allow how citizens evaluate different aspects of democracy to be measured. Using multiple indicators allows an assessment accounting for different and specific aspects making up the concept of democracy while avoiding the semantic uncertainty of indicators simply asking about ‘democracy’.Footnote 4
Method
Democracy is a latent variable (Treier and Jackman, Reference Treier and Jackman2008), and so is evaluation of it. The problem with working with multiple indicators is that of translating observed responses into a latent score and assessing how the items contribute to the latent variable. One of the most popular models to test the reliability of items and to make inferences on the latent variable accounting for the properties of the items is factor analysis (see Lawley and Maxwell, Reference Lawley and Maxwell1971). The model is estimated using the Bayesian framework (see Gelman et al., Reference Gelman and Hill2004; Jackman, Reference Jackman2009). This estimation method allows inferences on the individual or specific parameters to be easily made, that is the factor scores, as they are estimated via data augmentation. This estimation method also accounts for uncertainty over all the other model parameters and allows additional information in the analysis, where available, to be used to learn about the latent variable. This is an important feature for our case. In fact, it is possible to include in the model information to account for country heterogeneity. Moreover, this method allows great flexibility such that the measurement model can be extended to include, for instance, additional latent factors captured by fewer items or to evaluate whether the items present the similar or different association with the latent factor.Footnote 5
The inference for the latent states is obtained through a one-dimensional linear factor analytic model (see Jackman, Reference Jackman2009), which is represented in Figure 1. The factor analytic model we propose has a single factor φ i , that is the evaluation of democracy, and has k=14 observed items, which are responses of n individuals. These responses are represented by y. The relationship between the items and the latent factor is given by β k , which represent the intercepts and the slopes (factor loadings), and by ω k , which are the standard deviations of the measurement errors, which basically indicates the level of agreement across respondents in their evaluations of the attributes of democracy. Thus, the model can be represented as follows:
 $$y_{{ik}} \,\sim\,N\left( {\beta _{{k{\rm 0}}} {\plus}\beta _{{k1}} \varphi _{i} ,\omega _{k} } \right),$$
where y ik is the matrix of observed responses, β k0 the intercept of the responses, β k1 the slopes, that is the factor loadings, φ i the latent variable, and ω k the standard deviation of the measurement error. The model is estimated using relatively uninformative priors and are as follows: (β k0, β k1)~N(0, 100) and ω k ~inverse-Gamma(0.01, 0.01).
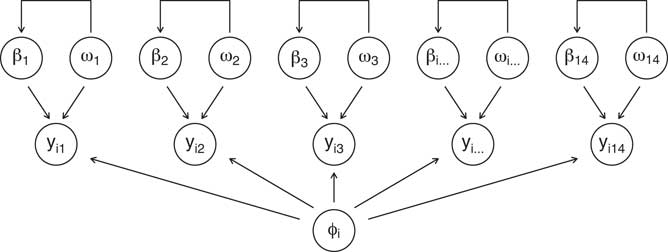
Figure 1 Graphical representation of the factor analytic model measuring the evaluation of democracy.
We include additional information in the latent variable to account for the groupings, that is countries, in a hierarchical model, and to estimate the latent variable at the country level. Thus, the latent variable φ i is nested j=29 countries and the prior for the latent variable is φ ij ~N(θ j ,σ φ ), where φ ij accounts for the country nesting indicated by j, and follows a normal distribution with mean θ j , and standard deviation σ φ , which is the error at the individual level which follows a U(0,10) distribution.
The term θ j is the country random effect, which basically provides the deviations in the latent state from the sample mean at the country level, and thus represents the evaluation of democracy at the country level. This specification allows the country-level parameters to be treated as exchangeable, meaning that the inference for the parameter for country j also uses the information from the other countries (Gelman and Hill, Reference Gelman, Carlin, Stern and Rubin2006; Jackman, Reference Jackman2009). The prior for the country random effect is N(0, σ θ ), with σ θ ~U(0, 10), which is the standard deviation of the country random effect.Footnote 6
This measurement model is, therefore, a factor analysis model with country random effects that can be seen as a hierarchical factor analysis. The advantage of the Bayesian approach is that a simple factor analysis can be extended by including additional information and accounting for country heterogeneity to estimate the latent variable at the individual and at the country level (with uncertainties), taking into account the properties of the items and decomposing the variance of the latent states.Footnote 7
Analysis
Table 3 shows the results of the model. The entries are posterior medians and the 95% intervals (in square brackets). The first column, β k0, reports the intercepts of each of the regressions predicting the responses to the items measuring evaluations of democracy in Europe. The second column, β k1, reports the slopes. The third column, ω k , reports the standard deviations of the errors, while the fourth the r 2, that is, how much of the variance in the item is explained by the latent variable.
Table 3 Estimates of the parameters measuring the evaluation of democracy, posterior medians, and 95% credible intervals

DIC=deviance information criterion.
Bayesian factor analysis with country random effects.
Based on 5000 Markov chain Monte Carlo draws. Estimates are posterior medians. In square brackets the 95% credible intervals are reported. M=14; n=39,172; p=29.
Items
Beginning with the rule of law, the item measuring whether courts treat everyone the same is an important component of the latent variable. The slope is 2.421 and the factor loading is 0.761 (see Figure 2), with 57% of the variance explained by the latent variable. This is not unexpected, as this aspect is considered a fundamental component of the rule of law and, as a consequence, of democracy in terms of the principle of the primacy of the law (O’Donnell, Reference O’Donnell2004).
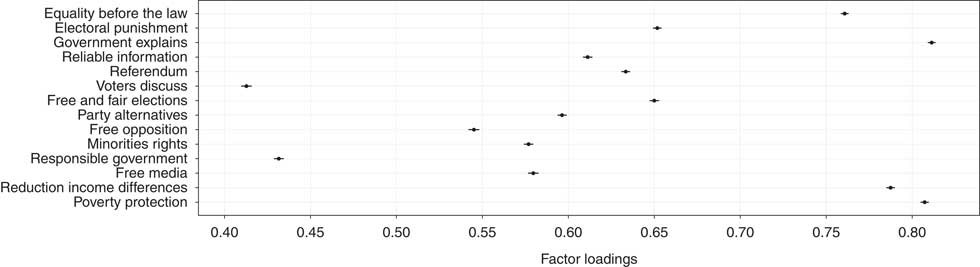
Figure 2 Factor loadings, with 95% credible intervals.
The next three items regard vertical accountability. The first evaluates whether governing parties are punished when they have done a bad job. Overall, this is not evaluated very positively, but it matters for the evaluation of democracy: its slope is 1.993 and the factor loading is 0.652, with about 42% of its variation explained by the latent variable. Indeed, the possibility of punishing governing parties should push them to pursue the policies citizens prefer (Roberts, Reference Roberts2010). The second item measures how respondents evaluate the government explaining its decisions to voters. This aspect receives a bad evaluation, but it is the one with the largest slope, implying that the latent score is influenced by how the respondents evaluate this aspect. As a matter of fact, accountability is made effective when those in power explain their choices to the citizens (Schedler, Reference Schedler1999) and the political process is transparent (Bühlmann et al., Reference Bühlmann, Merkel, Muller and Wessels2012). The last item assesses how the media provide citizens with reliable information to judge the government. This aspect receives a relatively good evaluation and it is reasonably associated with the latent variable, with a slope equal to 1.552, which is 0.611 when standardized. As is known, in good democracies institutions have to monitor each other, and an open and plural media system is part of this monitoring (Morlino, Reference Morlino2011; Bühlmann et al., Reference Bühlmann, Merkel, Muller and Wessels2012).
The next two items regard participation. The respondents, on average, do not think that citizens have the final say on the most important political issues by voting on them directly in referendums. This is an element often cited as a feature of direct democracies, although it is controversial (Lupia and Matsusaka, Reference Lupia and Matsusaka2004). Nevertheless, the item is related to the latent variable given that its slope is 1.975 and its factor loading is 0.633. Another aspect concerning the participation of citizens in public life is their ability to discuss and modify their preferences (Held, Reference Held2006). In general, respondents think that in their countries citizens are attentive to political issues and that they are discussed before relevant decisions are taken. Nevertheless, this item is the one showing the weakest association with the latent variable. Its slope is 1.020 and the factor loading is 0.411, with 17% of its variance explained by the latent variable.
The following three items account for competition, one of the driving forces of democracies (Przeworski et al., Reference Przeworski, Stokes and Manin1999; Morlino, Reference Morlino2011). The first and the third – national elections are free and fair, and opposition parties are free to criticize the government – receive some of the highest evaluations. These, as has been seen, are part of the classical definitions of democracy (Dahl, Reference Dahl1971; Sartori, Reference Sartori1987), but also part of the conceptualizations of ‘good’ democracy (Levine and Molina, Reference Levine and Molina2011; Morlino, Reference Morlino2011; Bühlmann et al., Reference Bühlmann, Merkel, Muller and Wessels2012). However, the first item has a larger weight on the latent factor compared to the third. The second item – different political parties offer clear alternatives – receives less positive evaluations. One of the problems, likely to occur in democracies, is citizens not being able to distinguish between the policy offerings of parties (Morlino, Reference Morlino2011). Indeed, this is a relevant component of the evaluation of democracy, as indicated by the factor loading.
The dimension of representation should ensure that citizens’ preferences are brought into the governing bodies (Przeworski et al., Reference Przeworski, Stokes and Manin1999). It may regard the ‘subjects of representation’ (who should get represented) or the ‘mechanisms of representation’ (majority vs. proportional representation) (see Ferrin and Kriesi, Reference Ferrin and Kriesi2016). The latter is a form of representation regarding the ‘electoral rules’, while the former a form of representation as ‘inclusiveness’, measured in this analysis using an item capturing the extent to which the rights of minorities are protected.Footnote 8 This aspect receives quite positive evaluations and it has a relatively strong association with the latent variable.
The following item is expected to account for responsiveness to other governments. As democracies are progressively embedded in a multi-level institutional setting, such as the European Union, elected officials also have to be responsive to other bodies, and they have to be ‘responsible governments’ (Mair, Reference Mair2009).Footnote 9 This item is reasonably regarded, but it has the second weakest association with the latent variable. This might be because citizens favour a government that implements policies they prefer rather than policies other stakeholders want. The evaluation of a very important component of democracy – freedom – is measured by looking at whether the media are free to criticize the government.Footnote 10 This element is highly evaluated but it appears not to be very strongly associated with the latent variable, which means that it is not so important, at least from the point of view of citizens’ evaluations, contradicting established definitions (see Dahl, Reference Dahl1971).
The last two items are those related to social equality: the government takes measures to reduce differences in income levels and the government protects all citizens against poverty. These items have the lowest intercepts, but are among the ones with the strongest association with the latent variable. This implies that respondents care about these components of democracy, and their overall evaluation is very much influenced by these two items. They are also the items of which respondents have the most similar evaluations, being the ones with the smallest standard deviations of the measurement error. Indeed, social equality has progressively been included in conceptualizations of democracy (see Held, Reference Held2006), although this is controversial and not often accepted as necessarily part of the concept (see Morlino, Reference Morlino2011).
In sum, the strength of the association between the items and the latent traits partially reflects the importance that aspects of democracy have been given in democratic theory, and also points to those aspects that citizens look at when evaluating democracy. Overall, it appears that the items relate well to a unidimensional trait identified as citizens’ evaluation of democracy. The next step is inspection of the latent scores.
Latent scores
As the items weight differently on the latent variable, this should be reflected in the latent scores. Figure 3 illustrates the evaluations of democracy at the individual level with 95% intervals. Indeed, the advantage of the Bayesian estimation is that it provides both the point estimates of the latent variable and also their uncertainties. This means that the researcher can take into account the possibility that evaluations of democracy are not accurate. In fact, Figure 3 shows that about 40% of the respondents express evaluations that are indistinguishable from the sample average, that only 5% express evaluations higher than 1 std. dev. from the average, and that 6% express evaluations lower than 1 std. dev. from the average.
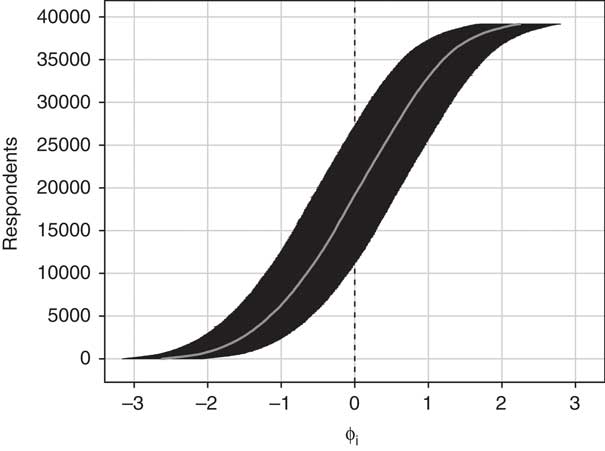
Figure 3 Evaluation of democracy at the individual level: latent scores (posterior medians) and 95% credible intervals.
Figure 4 illustrates the distribution of the latent scores for each country analysed. The plot clearly shows that heterogeneity in the evaluations of democracy exists across countries. Some distributions are skewed towards the right – positive evaluations, the cases of Denmark and Switzerland, while others are skewed towards the left – negative evaluations, as in the cases of Bulgaria and Italy.
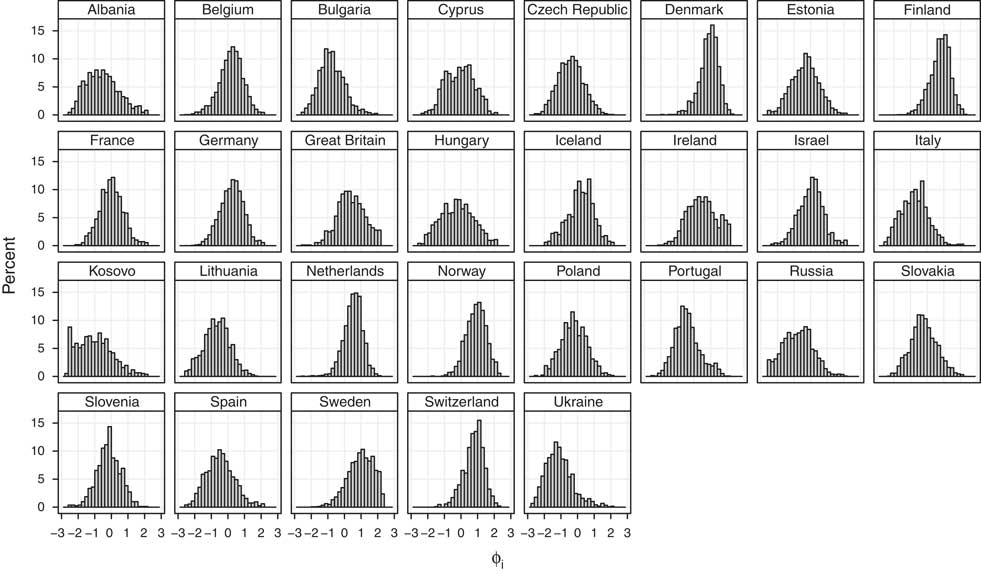
Figure 4 Distributions of the evaluation of democracy: latent scores at the individual level, by country.
The presence of heterogeneity is substantiated by the standard deviations of the random effects shown at the bottom of Table 3. The standard deviation of the latent variable at the individual level, σ φ , is 0.819 [credible interval (CI) 0.813; 0.825]. This indicates that simply accounting for country heterogeneity explains 18% of the variation in the latent trait at the individual level. Moreover, the standard deviation of the country-level random effects is 0.614 (CI 0.478; 0.824), which points to a substantial variation in the evaluations of democracy across countries. In fact, the intraclass correlation coefficient is 0.359 (CI 0.254; 0.503), which means that about 36% of the total variation in the latent variable is accounted for by differences across countries. This suggests that the hierarchical factor model is appropriate for the measurement of the evaluation of democracy.
The model also provides a measure of the evaluation of democracy at the country level. Figure 5 plots the country random effects, which are basically the deviations from the average of the latent variable. As can be seen, these estimates also come with some uncertainty. The Bayesian estimation makes it easy to find the probability that one country is different from another, that is to assess the precision of the rankings of the countries in terms of the evaluation of democracy, and therefore to identify the countries with the best and worst evaluations.Footnote 11 Sweden is the country with the highest evaluation of democracy. In fact, it has a probability of 0.99 of scoring higher than Denmark, of 0.98 of scoring higher than Norway, and of 1 of scoring higher than all the other countries. Finland, which is ranked fourth, has a probability of 0.54 of scoring higher than Switzerland, which follows, but of 1 of scoring higher than all the other countries except those preceding it. Scrolling down the ranking, there is a 0.90 and 0.88 probability that Germany scores higher than Belgium and Iceland, respectively. At the bottom of this ranking are Ukraine, Kosovo, Bulgaria, Russia, Italy, and Lithuania. Ukraine has a probability of 1 of receiving worse evaluations than all the other countries except for Kosovo, for which it has a probability of 0.99 of being worse, and Bulgaria has a worse evaluation than Lithuania (P=0.99), Italy (P=0.71), and Russia (P=0.61).
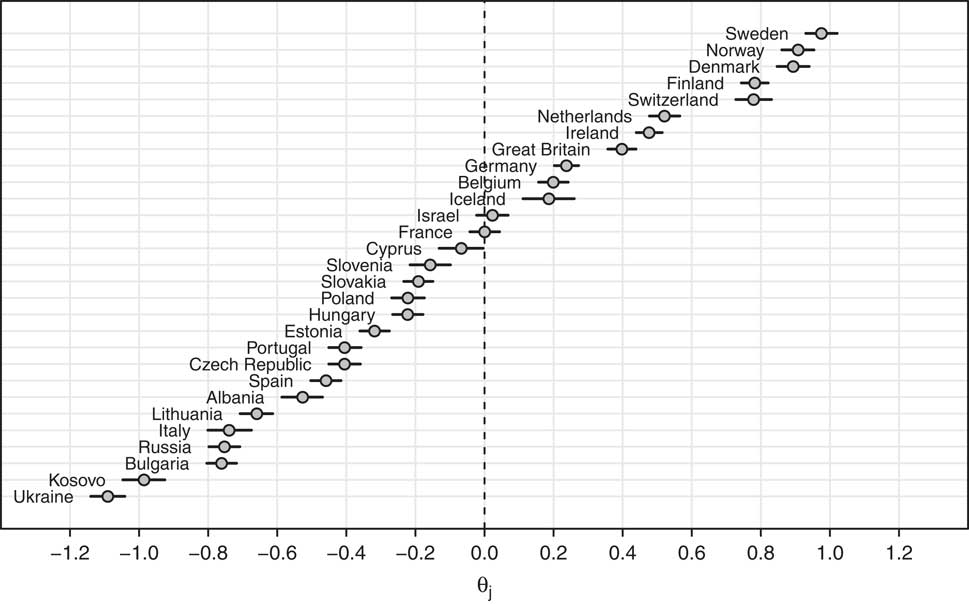
Figure 5 The evaluation of democracy at the country level: latent scores (posterior medians) and 95% credible intervals.
Validation
The following step in this study is to assess how the country-level evaluations of democracy based on citizens’ responses compare to system-level evaluations, that is, a validation of our scores against other scores measuring the same concept (Adcock and Collier, Reference Adcock and Collier2001). The country-level evaluations of democracy based on the ESS are contrasted with three system-level measures of democracy: the Unified Democracy Scores (Pemstein et al., Reference Pemstein, Meserve and Melton2010), the Democracy Barometer (Bühlmann et al., Reference Bühlmann, Merkel, Muller and Wessels2012), and the Democracy Ranking (Campbell, Reference Campbell2008). The Unified Democracy Scores synthesize 10 existing measures of democracy to improve the overall measurement. They avoid the problem of the arbitrary choice of one particular scale, minimize measurement error, and include different approaches to the measurement of democracy. The Democracy Barometer uses the ‘quality of democracy’ approach to build a scale, gauging three principles of democracy: freedom, control, and equality. These are guaranteed by nine factors – individual liberties, rule of law, public sphere, transparency, participation, representation, competition, mutual constraints, and government capability – which are measured using over a hundred indicators. The Democracy Ranking also takes a ‘quality’ perspective and assumes that democracy has three core dimensions – freedom, equality, and performance – complemented by other dimensions, interpreted as sectors of societies, which are the political system, gender equality, the economic system, knowledge, health, and environmental sustainability. Thus, the quality of democracy is made up of the quality of politics and the quality of society.Footnote 12 Finally, the evaluation based on the ESS items is compared to the country aggregate of SWD.Footnote 13 This comparison could be very useful to help solve the debate about the adequacy of the SWD indicator as a measure of democratic performance, and to assess it against a measure employing multiple indicators (see Canache et al., Reference Canache, Mondak and Seligson2001; Linde and Ekman, Reference Linde and Ekman2003, and third section).
The three system-level measures of democracy are highly correlated with the country-level evaluations based on the ESS. The Unified Democracy Scores have a correlation of 0.849 with θ j (n=29; P<0.000), the Democracy Barometer index of democratic quality has a correlation of 0.852 (n=24; P<0.000), and the Democracy Ranking index has a correlation of 0.851 (n=25; P<0.000).Footnote 14 The correlation between θ j and the aggregate values of SWD instead is 0.929 (n=29; P<0.000).
Another way to assess the convergent validity is by looking at the ordering of the countries according to the different measures. Figure 6 contrasts the rankings of the evaluation of democracy based on the ESS (reported with 95% CIs), and the rankings of the other four measures. When countries lie on the diagonal line, it means that the ranks are identical. When they lie above it, the countries have higher rankings of the evaluation of democracy based on the ESS compared to the other scores; instead, when countries lie below, the countries have higher rankings of the evaluation of democracy based on the other scores compared to the ESS scores. At the top of the rankings there is good convergence, but the aggregate SWD values provide different orderings at the top of the rankings, with Switzerland first and Sweden fourth. Relevant changes can be seen for Belgium, France, and Israel, which gain several positions in the ESS-based measure compared to the Unified Democracy Scores, and the same for Spain, Lithuania, and Poland. Israel and France score higher for ESS compared to the Democracy Barometer, and Italy and Portugal worse. Slovakia and Hungary also have higher rankings in the ESS scores compared to the Democracy Ranking scores, while Spain and Portugal occupy lower positions. Finally, Slovenia is the country showing the largest change in the ESS ranking compared to the aggregate SWD scores, while the Czech Republic and Lithuania lose several positions.
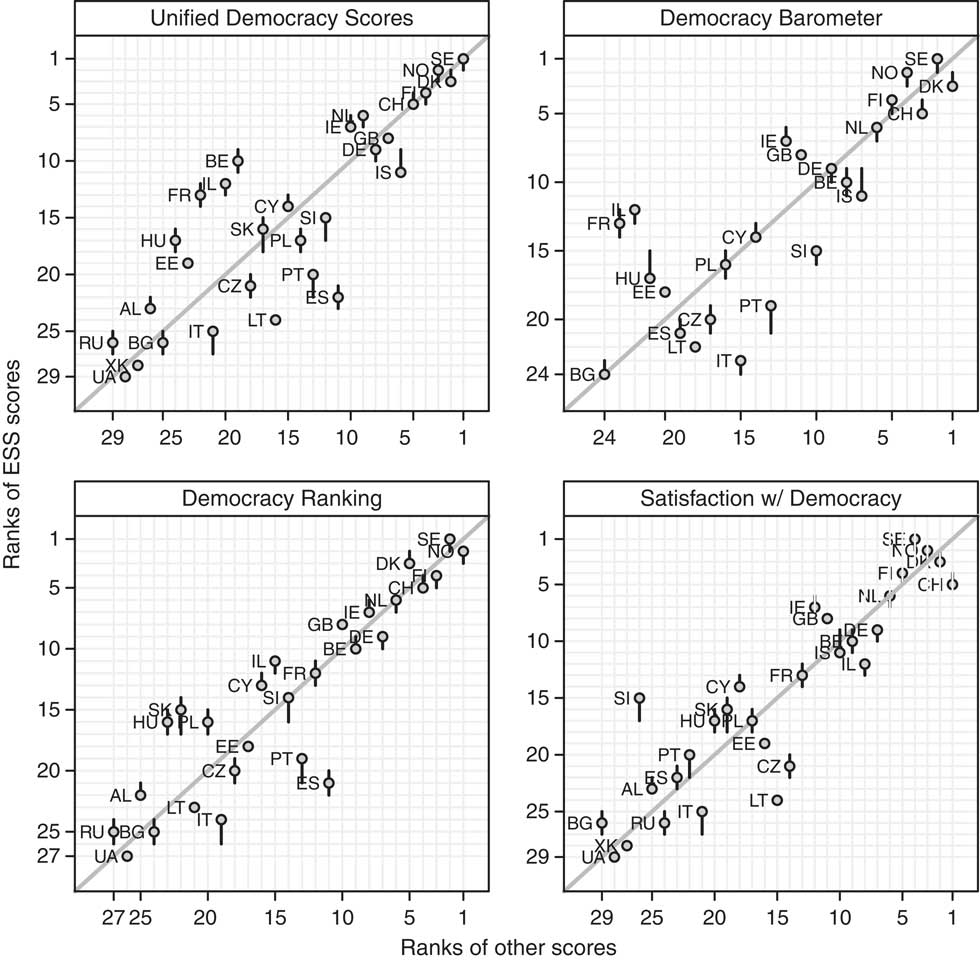
Figure 6 Comparison between the ranks of the posterior medians of θj based on the European Social Survey (ESS) (with 95% credible intervals) and the ranks of the Unified Democracy, the Democracy Barometer, the Democracy Ranking scores, and the satisfaction with democracy item.
Thus, it seems that there is a fair amount of convergence between a citizen-based evaluation of democracy and system-level measures, indicating the validity of the ESS-based measure. In particular, convergence between the evaluation of democracy based on multiple indicators and the SWD aggregate values is also evident, at least at the country level. Hence, this finding should provide some support to those studies using SWD indicators as an aggregate measure of democratic performance.
The convergence of our measure against the SWD indicator is also tested at the individual level. Table 4 reports that the overall correlation between the two measures is 0.592 (n=38,846; P<0.000), while the country-by-country correlations range between 0.286 for Portugal to 0.629 for Hungary. This indicates that the measure based on multiple indicators does not quite gauge the same latent concept as the SWD indicator. In some countries, such as Portugal, Sweden, Slovakia, and Israel, it is unlikely that the concepts underlying these measures overlap. In others, such as Hungary, Kosovo, Albania, Cyprus, or Estonia, the chances of overlap are higher, but not very strong. This evidence points at some doubts concerning the possibility of using SWD as an indicator measuring democratic performance, at least in comparison with a measure based on the ESS indicators. It is evident, in fact, that when using a summary measure built with well-defined aspects of democracy, SWD does not seem to gauge citizens’ evaluations of democracy. These results suggest that caution should be taken when using it as a measure of democratic performance at the individual level, as it is not clear what it gauges as it does not overlap substantially with a measure based on multiple indicators accounting for several aspects of democracy (see Canache et al., Reference Canache, Mondak and Seligson2001; Linde and Ekman, Reference Linde and Ekman2003).
Table 4 Correlations between the evaluation of democracy at the individual level based on multiple indicators and satisfaction with democracy, by country

All correlation coefficients are significant at P<0.000.
Correlates and consequences
A different approach to validate the citizen-based measure of democracy might be with using it as a dependent and an independent variable, and comparing the results with analogous models using the SWD item as a dependent and an independent variable. Doing so, we can check whether using the citizen-based measure challenges the established findings regarding SWD.
To do so we selected some ‘typical’ correlates at the individual and country level of SWD (see Dalton, Reference Dalton2004). We use socio-demographic factors as gender, age (and its square), education (in years), working status (in paid work vs. not in paid work). Then, we use factors linked to social capital and personal satisfaction such as trust in others and satisfaction with life. Another very relevant variable for SWD is the perception of the economy that is measured using an ego-tropic evaluation in terms of own feeling with household income (on a scale from difficult to comfortable). The following factors regard ideological position (left to right) and political interest (high to low). Eventually, we add the winner–loser status (see Anderson et al., Reference Anderson and Guillory2005). At the country level we use a dummy variable distinguishing between new and old democracies (post-communist vs. non-post-communist), an index of economic performance (Khramov and Lee, Reference Khramov and Lee2013), and the World Bank’s Government Effectiveness index to measure the quality of government (see Dahlberg and Holmberg, Reference Dahlberg and Holmberg2014). These analyses are carried out using linear multilevel models with individuals nested in countries.Footnote 15
Overall, it does not seem that the correlates of the citizen-based measure are radically dissimilar from the SWD correlates, although some differences emerge. Women have a lower evaluation of democracy and are less satisfied with it. Higher education (in years) is negatively associated with the ESS measure. Age is not associated with both dependent variables, while being in paid work has a negative association with them. Life satisfaction and trust in others are positively associated with the two measures, although slightly more with SWD. A positive feeling of income has a positive association with the measures, as well as ideology, meaning that those leaning on the right have better evaluations or are more satisfied. Political interest, instead, has a similar and negative association with the two measures. Eventually, winners are more satisfied with democracy or report a better evaluation of democracy than losers, although the association is stronger for SWD. Regarding the country-level variables, respondents of post-communist countries have lower scores on both measures, yet the association is much stronger with the ESS measure. Economic performance is only associated with SWD, while government effectiveness is positive associated with the two measures, although slightly more with the former.
Political support has also consequences on other political outcomes, for instance, on conventional and unconventional participation (see Dalton, Reference Dalton2004). Therefore, we predict voting turnout (yes vs. no) and participation in public demonstrations (yes vs. no) using the ESS measure of democracy and SWD as independent variables. The general expectation is that a positive evaluation of democracy or SWD should have a positive association with turnout, while negative with protest.Footnote 16
As expected the two measures present a positive association with turnout but are negative with participation in demonstrations. However, while the effects of the ESS measure and SWD on turnout are almost identical, their effects on participation in demonstration are different. It appears that a positive evaluation of democracy has a stronger negative association with this form of unconventional participation, compared to being satisfied with democracy.
What conclusions can be drawn from these analyses? While the test of the convergence of our measure with SWD at the individual level resulted in a cautionary advice regarding the possible overlap of the two measures, their correlates and their effects seem not to be particularly different. Given the similarity of the results, the ESS measure proposed here does not challenge the findings regarding SWD, and therefore the latter might be still considered a measure of the citizens’ evaluations of democracy, although its definitive meaning is yet to be determined.
Conclusion
It has been widely argued that legitimized democracy needs, at least to some extent, supportive citizens who evaluate its performance positively (Morlino and Montero, Reference Morlino and Montero1995; Linz and Stepan, Reference Linz and Stepan1996; Rose et al., Reference Rose, Mishler and Haerpfer1998; Diamond, Reference Diamond1999). For this reason, survey research has put much effort into the construction of indicators measuring dimensions of political support. This article has focussed on the evaluative dimension, and in particular how citizens evaluate aspects of democracy (Dalton, Reference Dalton2004). However, the literature argues that consolidated indicators used to measure how citizens assess democracy are not clear about what they actually measure (Canache et al., Reference Canache, Mondak and Seligson2001; Linde and Ekman, Reference Linde and Ekman2003). This article has argued that a more nuanced appraisal of what citizens think about the functioning of democracy should take into account its different elements so as to better specify what the object of evaluation is and to rely on more detailed indicators, so to assess how single-indicator measures perform compare to multiple-indicator ones.
Following recent works on democracy (Altman and Perez-Linan, Reference Altman and Perez-Linan2002; Beetham et al., Reference Beetham, Carvalho, Landman and Weir2008; Roberts, Reference Roberts2010; Levine and Molina, Reference Levine and Molina2011; Morlino, Reference Morlino2011), this article has attempted to provide an overview of how citizens evaluate democracy by taking into account its different components. Thus, this article has moved from an evaluation of democracy based on single indicators to an evaluation based on multiple indicators. This has potential advantages. First of all, it avoids conceptual uncertainty, which is very frequent when the term ‘democracy’ is used in survey items. Second, as a consequence, it allows which elements of democracy are evaluated to be clarified. Third, it allows a synthetic measure of the perceived performance of democracy to be produced.
Indeed, the most recent ESS round came with a special module which was designed with this purpose, and which included several items measuring how citizens evaluate single elements of their democracies (see Ferrin and Kriesi, Reference Ferrin and Kriesi2016). By applying a Bayesian factor analytic model with country random effects, which allows country heterogeneity in responses to be accounted for, the article has found that the selected indicators can be considered part of a single unidimensional underlying trait identified as ‘evaluation of democracy’. Of course, the items contribute to the latent variable differently. Some attributes, for instance, those concerning whether the government explains its decisions to voters, whether it takes measures to reduce differences in income levels, or protects all citizens against poverty, are very important for the overall evaluation of democracy, while others, such as whether citizens discuss politics, or whether politicians take into account the views of other governments, have a lighter weight. The model has also allowed evaluations of democracy to be found across respondents and, above all, across countries. Indeed, variation in evaluations of democracy is quite significant across the countries included in the ESS, demonstrating the value of including country random effects to estimate the latent variable. The Nordic countries and Switzerland are those with the best evaluations, while Ukraine and Kosovo those with the worst ones. However, the evaluations come with some uncertainty, which have been used to estimate the probabilities that a country has a better (or worse) evaluation than others.
The country-level evaluations have been validated against three measures of democracy, and against the aggregate of the ‘SWD’ item. Overall, it appears that there is convergence across the measures, which means that evaluations based on citizens perceptions are quite similar to those based on a macro/institutional approach. Good convergence between the measure based on multiple indicators and the ‘SWD’ item should also be underlined, which can serve as a test of the validity of this indicator as a measure of democratic performance (Linde and Ekman, Reference Linde and Ekman2003: 406). In the end, the individual-level summary measure was tested against the SWD item showing, instead, some differences. However, when the ESS-based measured is used as a dependent or an independent variable, it presents similar findings compared to models using the SWD as a dependent or an independent variable. In sum, the SWD item seems to be a decent proxy to measure the citizens’ evaluations of democracy at the individual and country level. The analysis shows that this consolidated indicator should not be looked at with suspicion just because it is not clear what it measures as, apparently, it does measure the citizens’ evaluations of democracy.
Survey data provides two advantages. The first is that the latent scores based on citizens’ responses have a higher degree of precision due to the large samples used. Second, it allows the components contributing to the synthetic measure to be weighted. Few have investigated the consequences of different strategies in the aggregation of indicators while making sure that the uncertainties in the measures of democracy are accounted for (see Pemstein et al., Reference Pemstein, Meserve and Melton2010). Often additive strategies are used to build indices of democracy (Munck and Verkuilen, Reference Munck and Verkuilen2002), which implies the (probably false) assumption that all components contribute equally to the total score (Treier and Jackman, Reference Treier and Jackman2008). Therefore, comparative research could take serious advantage of using surveys to evaluate the condition of democracies and can be a very good alternative to system-level evaluations.
Given the ‘globalization of public opinion surveys’ (Norris, Reference Norris2009), items measuring how citizens evaluate democracy could be included in questionnaires to measure the evaluation of democracy across several countries using multiple indicators. Of course, this is not easy, due to comparability, conceptual, and standards problems. Current comparative public opinion research has not paid enough attention to the measurement of the evaluation of democracy, which has mainly relied on few indicators, and particularly on ‘SWD’, which is, in fact, present in many surveys. Thus, future survey research could gradually include more indicators about the measurement of citizens’ evaluation of democracy. Nevertheless, it is, at the same time, unlikely that comparative survey projects could (and would) devote more space to such items. So what kind of ‘practical implications’ can be suggested for future research? The key for including items beyond the SWD indicator would be identifying a shorter list of items that might well capture an extended measure of democratic evaluation. A possible strategy would be identifying the items that are theoretically and empirically less relevant. The article has shown, for instance, that some items, such as representation as ‘inclusiveness’ or ‘responsible governments’, have a weaker association with the latent measure proposed here, and might be therefore be dropped if a simplified version of such scale is to be calculated. Another one could be focussing on sub-dimensions of democracy, such as accountability or competition, which would allow reducing the number of items to be included (see the Online Appendix).
The bottom line is that the choice of items, in part, reveals the ‘idea’ of democracy that surveys can measure. The strategy taken by the ESS special module is comprehensive avoiding leaning towards one or another conception of democracy. Survey projects that might want to include additional items could use pilot studies to test alternative measurement models involving fewer items capturing different conceptions of democracy, and evaluate which gauge democratic performance better.
The article presents some limitations that could not be addressed here due to space constraints, but could be part of a future research agenda for those scholars interested in the topic. Some items used here might be problematic as they capture narrow or limited aspects of democracy and could be certainly refined or expanded. The analysis has not dealt explicitly with the problem of measurement equivalence of the scale proposed (see Ariely and Davidov, Reference Ariely and Davidov2012). Moreover, the model could have also included a structural part or could propagate the uncertainties in a regression model (Treier and Jackman, Reference Treier and Jackman2008) to test the relationships between citizens’ evaluations of democracy and other variables (see Dalton, Reference Dalton2004), which were instead tested using correlations and regression models. Nevertheless, this article has aimed to stimulate reflection upon the measurement of the performance of democracy from a citizens’ perspective by showing a strategy to produce a summary measure at the individual and at the country levels from multiple indicators to account for the multiple dimensions of democracy, a strategy which also reports the measurement error in the latent scores and which could be used in future research to assess more precisely what citizens think democracy delivers to them.
Acknowledegments
The author wishes to thank the editors of EPSR and the three anonymous reviewers for providing very useful insights on previous versions of this article.
Supplementary Material
To view supplementary material for this article, please visit https://doi.org/10.1017/S1755773917000054


