


Introduction
Fragile X syndrome (FXS) is the most common inherited form of intellectual disability (ID) affecting ~1/4000 males and ~1/5000 to 1/8000 females (Refs Reference Hill1, Reference Monaghan2) and is caused by the full-mutation (FM, >200 repeats) hyperexpansion of (CGG) n triplet-repeat sequence in the 5′-untranslated region of the X-linked Fragile X Mental Retardation 1 (FMR1) gene (Refs Reference Fu3, Reference Verkerk4, Reference Yu5, Reference Oberle6). FXS is characterised by ID, seizures and other behavioural issues such as anxiety, hyperactivity and autism spectrum disorder (ASD). Symptoms are usually milder in affected females due to X-inactivation and cellular mosaicism (Ref. Reference Migeon7). Premutation (PM) expansions (55–200 repeats), which have been associated with the late-onset FMR1-related conditions fragile X-associated tremor/ataxia syndrome (FXTAS) and fragile X-associated primary ovarian insufficiency (FXPOI), occur more frequently, with three recent studies reporting PM prevalence rates of 1/209 females and 1/430 males (Ref. Reference Tassone8), 1/148 females and 1/290 males (Ref. Reference Maenner9) and 1/151 females and 1/468 males (Ref. Reference Seltzer10). Approximately 40% of male and 8–16% of female PM carriers will develop FXTAS (Refs Reference Jacquemont11, Reference Hagerman12), with female PM carriers having an additional 20% risk for FXPOI (Refs Reference Sherman13, Reference Welt14). In addition, a spectrum of medical co-morbidities such as thyroid dysfunction, fibromyalgia, neuropathy, sleep apnea, seizures and hypertension have been observed among PM carriers, particularly in females with FXTAS (Refs Reference Coffey15, Reference Hamlin16, Reference Hamlin17, Reference Winarni18, Reference Wheeler19, Reference Jalnapurkar20).
Developmental delay, attention problems, ASD and anxiety have also been reported in some PM individuals (Refs Reference Tassone21, Reference Bailey22). Furthermore, the meiotically unstable nature of expanded FMR1 alleles predisposes female PM carriers to an increased risk of having FXS-affected offspring, with almost 100% FM transmission risk when the transmitted allele is >90 CGG repeats (Ref. Reference Nolin23). This marked decline in repeat stability among expansion carriers is strongly correlated with the reduction or absence of AGG interruptions within the CGG repeat tract (Refs Reference Eichler24, Reference Latham25). Normal (NL, 5–44 repeats) and intermediate (IM, 45–54 repeats) alleles do not expand to FM upon transmission, although some IM alleles can gradually expand to FM after multiple generations (Refs Reference Fernandez-Carvajal26, Reference Nolin27). However, the key question of whether IM individuals are at risk for PM-related conditions still remains to be addressed (Ref. Reference Monaghan2).
According to the FXS testing guidelines, only individuals with a family history of FXS, ASD, developmental delay, learning disabilities or clinical features suggestive of FXS, FXTAS or FXPOI, qualify for FMR1 molecular testing (Refs Reference Hill1, 28). There has been enormous interest in evaluating the possibilities of extending fragile X genetic tests to newborns and women of reproductive age so as to detect expansion carriers who are most likely to benefit from early identification (Refs Reference Hill1, Reference Tassone21, Reference Coffee29, Reference Archibald30, Reference Musci and Moyer31, Reference Abrams32). However, for such large-scale screenings to be practicable, cost-effective and technically simpler FMR1 screening tools are required. Southern blot (SB), the gold standard FXS testing method is still the preferred diagnostic tool for characterising expanded FMR1 alleles in FM individuals. However, owing to the laborious and low-throughput nature of SB, several polymerase chain reaction (PCR)-based assays have been developed as alternative procedures primarily to minimise or eliminate the need to perform SB on every sample (Refs Reference Zhou33, Reference Zhou34, Reference Tassone35, Reference Lyon36, Reference Hantash37, Reference Chen38, Reference Filipovic-Sadic39, Reference Chen40). Most commonly, these studies have employed the traditional repeat-spanning PCR and/or the triplet-repeat primed PCR (TP-PCR). Although the initial limitation of amplifying large GC-rich PM and FM expansions has been overcome (Refs Reference Filipovic-Sadic39, Reference Chen40), the reliability and upper limit of FM sizing ability of repeat-spanning PCR is contentious. In contrast, TP-PCR methods can reliably detect all FM alleles regardless of the actual FM repeat size. TP-PCR assays facilitate accurate repeat size determination of up to ~200 CGG repeats by virtue of their assay design that incorporates capillary electrophoresis (CE) for analysing the heterogeneous TP-PCR amplicon fragments (Refs Reference Hantash37, Reference Chen38). However, for newborn and carrier screening applications that involve processing large numbers of samples, methods requiring CE are not ideal due to the high-cost factor associated with the selected approach of amplicon analysis.
We had previously proposed a cost-effective screening platform that coupled TP-PCR with melting curve analysis (MCA) for rapid identification of FMR1 expansions in both males and females (Ref. Reference Teo41). This method classified samples as ‘expanded’ or ‘nonexpanded’ based on the temperature at which their melt profiles’ –dF/dT value dropped to zero or returned to baseline. A higher return to baseline temperature was used as an indicator to confirm the presence of an expanded allele. Therefore, for unambiguous determination of expansion status in samples carrying FMR1 alleles in the high-IM to low-PM size range, precise discernment of return to baseline temperature is imperative. Reliance on this analysis mode is prone to producing ambiguous results when samples do not display an obvious drop in –dF/dT. The assay did not generate defined melt peaks, which prohibited identification of melt peak temperature (T m) and necessitated dependence on return to baseline temperature.
We now describe an improved direct TP-PCR (dTP-PCR) MCA assay that yields remarkably well-defined melt profiles, thus enabling utilisation of the highly reliable melt peak temperature (T m) instead of the return to baseline temperature to identify expansion carriers. Furthermore, to show the agreement between dTP-PCR MCA classification and the actual FMR1 genotypes of tested samples, we simultaneously performed a dTP-PCR CE-based sizing assay that was optimised to detect all FMR1 allelic classes. In addition, we have also demonstrated the sensitivity of both assays in detecting low-level mosaicism for FM allele using artificial DNA mixtures.
Materials and methods
FMR1 reference and patient DNA samples
29 lymphoblastoid cell line-derived genomic DNA samples (listed in Table 1) obtained from the Coriell Cell Repositories (CCR; Coriell Institute for Medical Research, Camden, NJ) were used for the initial optimisation and subsequent evaluation of direct triplet-primed PCR (dTP-PCR) assays. Additionally, a panel of archived and previously characterised peripheral blood-derived patient DNAs consisting of 54 NL, 25 PM and 28 FM FMR1 carriers was tested in a blinded fashion. Approval to perform this study was granted by the National University of Singapore Institutional Review Board (07-123E) and the SingHealth Centralized Institutional Review Board (2013/-73/A).
Table 1. Genomic DNA samples from the Coriell Cell Repositories used for direct TP-PCR MCA and CE

NL – normal; Ex – expanded; IN – indeterminate; pure – uninterrupted CGGs. n.a. – not available
Direct TP-PCR and MCA
The dTP-PCR mix containing 1 X PCR buffer (Qiagen, Hilden, Germany), 2.5 X Q-solution (Qiagen), 0.1 X SYBR Green I nucleic acid dye (Roche Applied Science, Penzberg, Germany), 5 U HotStarTaq DNA polymerase (Qiagen), dNTP mix at a final concentration of 2 mM with a 5:1 dGTP and dCTP to dATP and dTTP ratio (Roche Applied Science), 100 ng of genomic DNA, and 0.60 μM each of primers, ‘F’ described by Fu YH et al. (Ref. Reference Fu3), tail (5′TGCTCTGGACCCTGAAGTGTGCCGTTGATA3′), and a 1000-fold diluted TP-primer (5′TGCTCTGGACCCTGAAGTGTGCCGTTGATA[CGG]53′) was prepared in a 15-μl reaction volume. An initial denaturation at 95°C for 15 min was followed by 40 cycles of 99°C for 45 s, 55°C for 45 s and 70°C for 8 min, and then a final extension at 72°C for 10 min on the GeneAmp® PCR System 9700 (Applied Biosystems-Life Technologies, Carlsbad, CA). Subsequently, the amplicons were transferred into a 96-well plate for MCA on the LightCycler® 480 Real-Time PCR System (Roche Applied Science) with a similar MCA program setting as described previously (Ref. Reference Teo41). The dTP-PCR MCA results were analysed on the LightCycler® 480 software and the melt peak temperature or T m (the temperature at which the maximum −dF/dT value is recorded) obtained for each sample was rounded off to the nearest 0.05°C.
To identify FMR1 expansion carriers among the male and female samples tested, two IM reference male (NA20232, 46 repeats and NA20230, 54 repeats) and two IM reference female (NA20234, 31/46 repeats and NA20236, 31/54 repeats) samples from CCR were included in each MCA plate/run as internal reference controls, respectively. While samples that generated MCA profiles with low T m relative to the 46-repeat internal reference control were classified as ‘NL’, those that produced MCA profiles with higher T m relative to the 54-repeat internal reference control were classified as ‘Expansion Carriers’, who require confirmatory assessment using reference method(s). In comparison, samples that displayed T m identical to either one of the internal reference controls and those that generated MCA profiles in the ‘Indeterminate Zone’ (defined as the melting domain between the 46-repeat and the 54-repeat internal reference controls) are presumed to be ‘IM’, although additional testing is recommended to confirm their FMR1 genotypes.
Direct TP-PCR and CE
The dTP-PCR mix for sizing assay had a reaction setup identical to that described for MCA, except that SYBR Green I dye was excluded; 5′ end of the flanking F primer was labelled with 6-carboxyfluorescein (Fam); and 5 U of Taq Extender™ PCR Additive (Agilent Technologies, Santa Clara, CA) was included. An initial denaturation at 95°C for 15 min was followed by 40 cycles of 99°C for 45 s, 55°C for 45 s and 70°C for 8 min with a 15 s auto-extension at each cycle, and a final extension at 72°C for 10 min on the GeneAmp® PCR System 9700 (Applied Biosystems). A 4-μl aliquot of Fam-labelled TP-PCR amplicon was mixed with 0.5 μl of MapMarker1000® (BioVentures, Murfreesboro, TN) and 9 μl of Hi-Di™ Formamide (Applied Biosystems), denatured at 95°C for 5 min and subjected to CE (36 cm, POP-7™, 18 s 1.2 kV injection, 50 min 15 kV run) on the 3130xl Genetic Analyzer (Applied Biosystems). GeneScan electropherograms were analysed using GeneMapper® software (Applied Biosystems, version 4.0).
The dTP-PCR electropherograms generally reflect both FMR1 CGG repeat size and the distribution pattern of AGG interruptions. For instance, in case of NL samples with AGG-interrupted FMR1 alleles, discrete Fam-labelled dTP-PCR peak clusters separated by clear zones of ~18 bp are expected owing to the poor annealing of TP-primers over AGG interruptions. In marked contrast, samples carrying PM and FM expansions display a continuous series of uninterrupted Fam-labelled dTP-PCR peaks differing by 3-bp from each other, a pattern characteristic of FMR1 alleles with one or no AGG interruption. For FM samples, in addition to the uninterrupted Fam-labelled dTP-PCR peaks exceeding 700 bp, we also observed a FM-peak around 1050 bp. The dTP-PCR peaks in the range of 700–750 bp had signal intensities of 10–20 RFU, whereas the FM-peaks had signal intensities ranging from 30–80 RFU.
Results
Performance optimisation and evaluation of dTP-PCR assays on fragile X reference DNA samples
We chose four male and four female Coriell Cell Repository (CCR) samples with NL, IM, PM and FM FMR1 alleles for the initial optimisation of dTP-PCR assay conditions (Fig. 1). Carriers and noncarriers of FMR1 expansion generated MCA profiles with distinctive melt peak temperatures (T m); both NL (GM06890 and GM07175) and IM (NA20232 and NA20235) samples produced MCA profiles with T ms that ranged from 84.25 to 87.55°C, while expanded PM (GM06892 and GM06907) and FM (GM07862 and GM06852) samples yielded MCA profiles with a pronounced shift in their T m to 89.25°C or above (Fig. 1, left). Moreover, the dTP-PCR MCA profiles showed good correlation with the CE estimated CGG repeat size and structure, which is well-illustrated across both male and female samples with different FMR1 genotypes (Fig. 1, right).

Figure 1. dTP-PCR MCA profiles (left) and GeneScan electropherograms (right) of eight FMR1 genotype-known reference male and female DNA samples. Coriell IDs and CGG repeat sizes of the samples are indicated on the left and the melt peak temperatures (T m) are indicated on the MCA profile of each sample. The −dF/dT values are shown on the y-axis and the temperatures (°C) are shown on the x-axis. Distribution pattern of AGG interruptions within the CGG repeat region are shown on the top right corner of each dTP-PCR GeneScan electropherogram, where a ‘+’ sign represents an AGG interruption. Number of CGG repeats is indicated by numbered black and grey arrows. Red arrowheads in the inset panels indicate the base-pair (bp) size, and the red peaks in the main panel are from a ROX-labelled internal size calibrator, whose bp sizes are indicated at the bottom of the electropherogram panel. rpts: total number of CGG repeats including AGG interruptions.
Furthermore, to determine the ability of dTP-PCR assays in accurately categorising samples carrying FMR1 alleles of different CGG repeat sizes and AGG interruption patterns, we carried out a preliminary performance assessment study on 21 additional CCR reference DNAs, and also re-evaluated the eight samples used for initial assay optimisation (listed in Table 1). Figure 2 presents the dTP-PCR MCA data of 13 reference males and 16 reference females as normalised melt curves (a, b) and melt peaks (c, d), followed by the GeneScan electropherograms of representative samples. Using MCA we ascertained the FMR1 genotype class of each sample based on its T m relative to reference controls that mark the lower and upper limits of the ‘Indeterminate Zone’. For the analysis of the reference males, the melt curve and peak temperatures of the IM male samples NA20232 and NA20230 marked the ‘Indeterminate Zone’ boundary, whereas the IM female samples NA20234 and NA20236 were selected to define the ‘Indeterminate Zone’ for the analysis of the reference females. As expected, all NL males carrying FMR1 alleles ranging in size from 30 to 41 CGG repeats, displayed lower T ms compared with that of NA20232 carrying a 46-repeat FMR1 allele with a 9 + 36 repeat-pattern, where ‘+’ indicates the position of AGG interruption relative to CGG repeats. In marked contrast, most PM and all FM males generated right-shifted MCA profiles that displayed higher T ms compared with that of NA20230 carrying a 54-repeat FMR1 allele with no AGG interruptions. A PM male (CD00014) generated a TP-PCR melt peak T m in the ‘Indeterminate Zone’. CD00014 carries a sequence-verified 56-repeat allele (the second smallest PM allele size) with a 9 + 9 + 36 interruption pattern, which was also confirmed by its CE pattern. With the exception of this PM male, all NL, PM and FM reference males were unambiguously classified by MCA as nonexpanded or expanded.
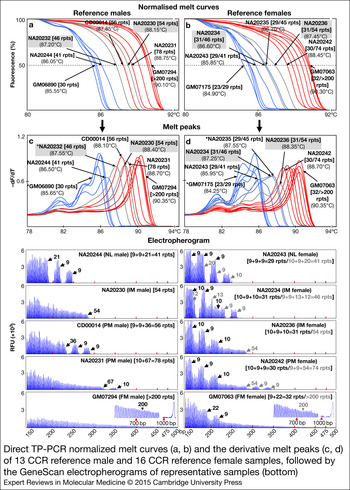
Figure 2. Direct TP-PCR normalised melt curves (a, b) and the derivative melt peaks (c, d) of 13 CCR reference male and 16 CCR reference female samples, followed by the GeneScan electropherograms of representative samples (bottom). Grey melt curves and peaks indicate the MCA profiles of the internal reference controls. GeneScan electropherograms of samples marked with asterisk (*) are shown in Figure 1.
The T ms derived from the MCA profiles of reference female samples generally showed good correlation with the CGG repeat size of the largest FMR1 allele present in the sample, except in case of GM07175, a NL female whose two alleles differ by seven CGGs. Consistently, this NL female displayed a melt peak T m consistent with the shorter 23-repeat allele rather than the 30-repeat allele. However, an analysis of the peak pattern indicates the presence of a shoulder with a peak T m consistent with the 30-repeat allele. Whether the T m of the tallest melt peak or the higher T m of the peak shoulder is chosen, this sample was classified appropriately. Importantly, the FMR1 genotypes of all reference female samples were accurately classified by MCA. All NL females generated MCA profiles of lower T ms compared with that of NA20234 carrying a 46-repeat FMR1 allele with a 9 + 9 + 13 + 12 repeat-pattern, whereas expanded PM or FM females produced MCA profiles of higher T ms compared with that of NA20236 carrying a 54-repeat FMR1 allele with no AGG interruptions. A 45-repeat IM female (NA20235) displayed a slightly higher T m relative to NA20234 and generated MCA profile in the ‘Indeterminate Zone’, presumably due to the presence of only 1 AGG interruption compared with the three AGGs in NA20234.
In addition, we have also demonstrated the utility of normalised melt curves with temperature differentials that are slightly different from the T m of melt peaks. Similar to melt peaks, each normalised melt curve displayed a clear and distinct profile pattern of high resolution with respect to temperature and melt curve position relative to other CGG repeat alleles.
Analysis of AGG interruption patterns and its effects on MCA profiles
To determine the reliability of dTP-PCR CE assay in accurately characterising AGG interruption patterns, we verified the repeat sequences of several reference males (GM06890, NA20244, NA20232, NA20230, CD00014, NA20231 and GM06892), a homozygous reference female (NA07538) and the IM alleles of two reference females – NA20235 and NA20234 by Sanger sequencing (data not shown). Generally, we observed complete concordance between most Sanger sequencing and dTP-PCR CE results. Although the assay displayed superior performance in male samples, characterising the distribution pattern of AGG interruptions of some heterozygous female samples was challenging; this is best-illustrated in case of NA20234 carrying a 31-repeat NL allele and a 46-repeat IM allele with 10 + 9 + 10 and 9 + 9 + 13 + 12 repeat-patterns, respectively (shown in the electropherograms in Fig. 2).
In addition, we also examined the MCA profiles of reference samples with identical CGG repeat size, but different AGG interruption patterns. In the IM samples, NA20230 and NA20236 carrying a pure 54-repeat FMR1 allele, only a negligible T m variation of 0.05°C was observed. In contrast, we observed a T m difference of 0.30°C between NA20232 and NA20234, both of which carried an FMR1 allele with 46 CGG repeats, with lower T m recorded for NA20234 harbouring 3 AGG interruptions compared with NA20232 harbouring only one AGG interruption. This observation is consistent with our previous study, wherein we reported varied melt profiles among samples differing only in their repeat-patterns (Ref. Reference Teo41).
Detection of low-level mosaicism for expanded FMR1 allele in artificial DNA mixtures
The sensitivity of dTP-PCR assays in detecting low-level mosaicism for an expanded FM allele was tested using artificial DNA mixtures that contained 1, 2, 3, 4, 5, 10 and 20% of the FM allele. To generate these NL/FM DNA mixtures, we pooled the genomic DNAs of GM06890 (NL male, 30 repeats) and GM07862 (FM male, ~501–550 repeats) in different proportions with the total DNA input maintained constant at 100 ng. The dTP-PCR MCA of NL/FM DNA mixtures revealed efficient amplification of FM allele in the presence of predominant levels of NL allele, and enabled accurate detection of FM mosaicism from as low as 1% (Fig. 3, left). The low-level mosaicism for FM allele allowed visualisation of both NL and FM MCA peaks with discrete T m in 1–10% NL/FM DNA mixtures. The availability of more FM template in the 20% NL/FM DNA mixture resulted in a much more prominent FM MCA peak that closely resembles the melt profile of a typical FM female. We noticed a slight reduction in the sensitivity of the dTP-PCR CE assay compared with MCA, with FM mosaicism detected down to 4% (Fig. 3, right).

Figure 3. Direct TP-PCR melt peaks (left) and GeneScan electropherograms (right) of NL/FM DNA mixtures. Presence of FM allele in the NL/FM DNA mixtures was confirmed by the identification of MCA peaks with higher T m in the melting domains highlighted in pink.
Blinded validation of dTP-PCR assays on clinical samples
A total of 107 clinical samples, previously characterised by PCR and/or Southern analysis, were included in the blinded validation study of dTP-PCR assays. The patient cohort comprised 54 NL and 56 PM and/or FM expansion carriers, and had no samples with FMR1 alleles in the IM size range. In addition, we also included two sets of internal reference controls from CCR, NA20232 and NA20230, and NA20234 and NA20236 to define the cut-off temperature ranges for male and female samples, respectively. Normalised melt curves and melt peaks of all clinical samples with internal reference controls, followed by the GeneScan electropherograms of representative NL, PM and FM carriers are shown in Figure 4. As expected, in both males and females, two clusters of MCA profiles, one from NL samples exhibiting lower T m compared with the respective 46-repeat reference control, and another from samples carrying expanded FMR1 alleles with T m higher than that of the respective 54-repeat reference control, were generated. Consistent with the lack of IM samples, no MCA profiles were detected in the ‘Indeterminate Zone’. In general, we observed complete agreement between MCA and CE results for all clinical samples and achieved 100% sensitivity, 100% specificity, 100% positive predictive value and 100% negative predictive value for both dTP-PCR assays. Additionally, we verified the CGG repeat size and AGG interruption pattern of the FMR1 alleles of 17 NL males by Sanger sequencing and detected absolute concordance with dTP-PCR CE results (data not shown).

Figure 4. Direct TP-PCR normalised melt curves (a, b) and the derivative melt peaks (c, d) of 107 archived patient DNA samples, followed by the GeneScan electropherograms (bottom) of selected samples. MCA profiles of samples carrying NL and expanded FMR1 alleles are clustered to the left and right of the ‘Indeterminate Zones’ (highlighted in grey), respectively.
Discussion
One common current approach to FXS molecular diagnosis involves a combinatorial strategy of employing simple PCR and CE to identify putative expansion carriers in the first instance, followed by the SB analysis or the most recent mPCR-CE (Ref. Reference Chen40) for additional characterisation of samples carrying expanded FMR1 alleles. These first-tier PCR-based fragile X testing methods perform remarkably well in identifying FMR1 expansions and significantly reducing the need for labour-intensive approaches such as the gold standard SB analysis (Refs Reference Hantash37, Reference Chen38). However, for large-scale universal newborn and carrier screening applications, methods relying on CE might not be ideal first-line screening tools.
Alternatively, Tassone et al. (Ref. Reference Tassone35) proposed a two-stage sequential approach of conventional repeat-spanning PCR followed by a chimeric PCR that utilises a CGG-repeat annealing primer, whose utility in newborn screening was recently demonstrated (Ref. Reference Tassone8). The first round PCR screen identified males with FMR1 alleles of up to ~330 CGG repeats and apparent heterozygous females of up to a PM size range of at least ~160 CGG repeats (Ref. Reference Saluto42), but a second round PCR screen was necessary to distinguish NL homozygous females from heterozygous females carrying a nonamplifiable FM allele. This two-step strategy ultimately minimised the number of samples that required SB analysis.
In this study, we have presented an alternative FXS screening strategy that relies on the analysis of amplicon melt characteristics. The proof-of-principle of this strategy was first demonstrated in 2012 (Ref. Reference Teo41). This strategy utilises direct triplet-primed PCR melting curve analysis (dTP-PCR MCA), which is both cost-effective and reliable in identifying FMR1 expansions. A major improvement over the method of Teo et al. (2012) is that our improved assay identifies PM and FM carriers based on melt peak temperature (T m) instead of the resumed baseline temperature, thus significantly improving accuracy of temperature determination. In addition, we also evaluated the concordance between MCA results and the actual genotypes of samples through a direct comparison of T m with FMR1 CGG repeat size.
Initially, we assessed the performance of the improved MCA-based screening tool on 29 CCR (Coriell Cell Repositories) reference DNA materials using four internal reference controls of known CGG-repeat size. Male and female reference samples were analysed relative to two different sets of controls, each with a 46-repeat and a 54-repeat reference sample, which roughly defined the melting domain of IM FMR1 alleles or the ‘Indeterminate Zone’. In these reference samples with FMR1 alleles spanning the entire spectrum of fragile X mutation, the first-line MCA screen identified PM and FM expansion carriers with high sensitivity and specificity. Among the reference males, one PM carrier (CD00014) harbouring a 56-repeat FMR1 allele with a 9 + 9 + 36 repeat-pattern was identified in the ‘Indeterminate Zone’ and was therefore marked for further analysis. This allele harbours two AGG interruptions which may have lowered its T m relative to the 54-repeat control sample, which lacks AGG interruptions. This emphasises the need to have a cut-off temperature range rather than relying on the cut-off temperature of a single internal reference control. For instance, if the analysis was only based on the cut-off temperature of the 54-repeat control, this small PM male would have been wrongly classified as NL or IM, resulting in a false-negative call and reduced assay sensitivity. Conversely, in the presence of the 46-repeat control alone, most IM samples may appear as expanded, which would result in high false-positive calls and reduced assay specificity.
Remarkably, there was complete agreement between the MCA melt peak temperatures and CE sizing results of the dTP-PCR amplicons with respect to the classification of samples as ‘nonexpanded’ or ‘expanded’. The direct TP-PCR CE assay enabled sizing of FMR1 alleles and facilitated determination of AGG interruption patterns, both of which are crucial for predicting the risk of unstable FMR1 CGG-repeat expansions during maternal transmission (Ref. Reference Latham25). Since the first report by Eichler et al. (Ref. Reference Eichler24), several studies have highlighted the utility of maternal CGG-repeat size (Refs Reference Nolin23, Reference Nolin43, Reference Nolin44) and the density of AGG triplets (Refs Reference Nolin27, Reference Yrigollen45, Reference Nolin46) in ascertaining the risk of FMR1 allelic expansions. These findings argue for mapping AGG interruptions within the CGG-repeat tract, information that can be potentially used to predict the likelihood of expansion events among women carrying at-risk FMR1 alleles in the IM and PM size ranges. The dTP-PCR CE assay has potential applications in studies aiming to characterise AGG interruption patterns, although interpretation of the repeat structures can be slightly difficult in heterozygous females with complex repeat structures due to the overlap of amplicon peaks from both the FMR1 alleles.
We generally observed good agreement between the FMR1 allele sizes determined by dTP-PCR CE and the sizes reported by CCR, except for discrepancies in the PM samples GM06891 and GM20239. We detected a PM allele of ~160 CGG repeats in the cell-line derived genomic DNA of GM06891, contrary to the previously reported size of 118 CGG repeats in this PM male (Ref. Reference Amos Wilson47). However, our observation is in agreement with a recent study that reported instability and expansion of the PM allele in the same lymphoblastoid cell line (Ref. Reference Lokanga48). In GM20239, we observed a slightly larger expanded allele of ~200 CGG repeats instead of the reported PM size range of 183–193 CGG repeats. Again, our observation is consistent with another report that sized the largest expanded allele as ~206 CGG repeats (Ref. Reference Chen38).
In the artificial NL/FM DNA mixtures, the MCA assay detected FM mosaicism down to 1%. This high degree of sensitivity is critical for a first-line screening tool, without which samples with low-level mosaicism for PM or FM might not be detected. In the blinded patient DNAs, including NL and expanded PM and FM samples, the MCA screen accurately classified all samples with 100% sensitivity and specificity. Such an exceptional performance of the screening assay may be partly attributed to a lack of IM samples in the patient cohort, which was not intentional but reflects a very low frequency of IM alleles in Asian populations (Refs Reference Chiang49, Reference Tzeng50, Reference Zhou51, Reference Otsuka52, Reference Kim53). It is thus important to note that in populations with higher frequency of IM alleles, the specificity (and even possibly sensitivity) of this screening tool might be lower than 100%.
The MCA method has potential applications as a first-line tool in newborn and carrier screening programs owing to its simple design and flexibility to tailor the approach for different purposes. For NBS of FXS, utilising IM internal reference controls would mean identifying both PM and FM carriers. Identification of PM babies might raise ethical concerns related to detection of risk for late-onset disorders, although recent reports of PM carriers with developmental delay suggest a possible benefit to PM screening in babies, that of early developmental intervention (Ref. Reference Tassone21). If the aim is to identify both PM and FM, the demonstrated approach with IM internal reference controls will ensure high sensitivity and specificity in identifying expansion carriers.
Alternatively, for identifying only FM, an appropriate PM reference control can be used to minimise the number of false positives. Nevertheless, all the ‘false positives’ identified will be eventually excluded at the allele sizing second stage. If the population PM allele frequency is high, a higher false-positive FM rate can be expected following the first-tier MCA screen. Nonetheless, this method would still compare well with a first-tier screen employing flanking PCR and agarose gel electrophoresis (Ref. Reference Tassone35), whereby ~40% of females will require second-tier testing due to apparent homozygosity for the NL allele. Using PM reference controls, it should also be possible to avoid identification of IM carriers, whose involvement with disease are still in contention.
For population carrier screening programs aimed at identifying PM women of reproductive age, the use of IM internal reference controls would enable identification of virtually all but the smallest PM allele carriers, who are most likely to display melt profiles in the ‘Indeterminate Zone’. This method also has potential applications as a first-line screen for FXS in a diagnostic setting. Conceivably, in a population with low prevalence of FM alleles, a majority of tested samples will be negative for FM expansions even in high-risk groups such as children with intellectual/behavioural disabilities, and this screen could be a cost-effective first-tier tool to exclude ‘nonexpanded’ individuals. However, in an extreme hypothetical population wherein 1 of every two to three samples tested is positive for a FM allele, a screening assay such as this would obviously be unwarranted.
We calculated the reagent cost for fluorescent dTP-PCR, and the reagent plus consumables cost for amplicon CE on the ABI 3130xl, to be ~US$ 4.65 and ~US$ 2.30 per sample, respectively. In contrast, it costs ~US$ 3.05 and ~US$ 0.15 per sample to perform a nonfluorescent dTP-PCR and subsequent MCA assay on the Roche LC480, respectively. Although CE-based amplicon analysis allows for precise repeat sizing, employing it as a first-tier screening tool may not be cost-effective, especially in a large-scale population-based screening setting wherein a vast majority of the screened samples will be negative for FMR1 expansions. Also, while some recent studies have demonstrated the technical feasibility of using CE to analyse hundreds of samples (Refs Reference Maenner9, Reference Seltzer10), it is important to consider that such an approach might become very expensive when tens to hundreds of thousands of samples are tested annually in each jurisdiction.
Based on the known prevalence rates of FMR1 alleles in the general population (Refs Reference Maenner9, Reference Seltzer10), it can be estimated that for every 50 000 samples screened, ~48 500 samples (97%) will yield a negative result when tested for the presence of FMR1 alleles of >45 CGG-repeats. It would cost US$ 160 000 to screen 50 000 samples using dTP-PCR MCA as a first-tier screening tool to exclude ‘nonexpanded’ samples, and another US$ 10 425 for dTP-PCR and CE confirmation analysis on an estimated 1500 screen-positive samples. If all 50 000 samples were to be screened directly by fluorescent dTP-PCR and CE analysis, it would cost US$ 177 075 more, or ~US$ 3.55 more per sample screened. Therefore, in a large-scale screening setting, exclusion of the majority of samples as ‘nonexpansion carriers’ using the dTP-PCR MCA assay, with more precise sizing confirmation of only the screen-positive samples by fluorescent dTP-PCR and CE analysis, could be a more cost-effective alternative to direct fluorescent dTP-PCR and CE analysis of all samples. Even in an unlikely hypothetical situation in which half the population carries an FMR1 expansion, performing dTP-PCR MCA screening followed by the repeat-size confirmation of screen-positive samples using fluorescent dTP-PCR CE would still cost less than directly performing fluorescent dTP-PCR CE on all samples.
Unlike the approach of performing the dTP-PCR and MCA on the same real-time PCR instrument described in our previous study (Ref. Reference Teo41), the current dTP-PCR assay was optimised on a regular thermal cycler followed by melt analysis on LightCycler® 480 Real-Time PCR System (LC480). The rationale for proposing this strategy was to enable a higher throughput and reducing the turnaround time per sample. For instance, it is possible to process 16 plates of 96 samples by performing dTP-PCR on multiple inexpensive thermal cyclers in parallel and performing the amplicon melting for the 16 plates on a single LC480 instrument in ~24 h. In contrast, for 16 plates to be amplified and analysed completely on the LC480 would require ~6 days for one instrument or six LC480 s for the results to be out in 24 h. However, this method can also be carried out completely on the LC480 if desired (data not shown).
In summary, the dTP-PCR MCA method has potential applications as a first-line test to identify FMR1 expansions in both males and females. In large-scale universal screening programs, ideally this screening test should be accompanied by a reference method, either SB analysis or mPCR-CE, for detailed characterisation of CGG-repeat size and methylation state of samples that test positive for an expansion in the first round MCA screen.
Acknowledgements and funding
This work was supported by Departmental research funds.
Conflict of interest
Samuel S. Chong and Caroline G. Lee are the inventors of the dTP-PCR and melting curve analysis strategy described in the manuscript. The other authors declare no conflict of interest.
Ethical standards
The authors assert that all procedures contributing to this work comply with the ethical standards of the relevant national and institutional committees on human experimentation and with the Helsinki Declaration of 1975, as revised in 2008.


 Open access