


Introduction
Satellite digital audio radio services (SDARS) provide high-quality audio to large areas like e.g. SiriusXM does to the continental USA in the frequency range between 2.320 GHz and 2.345 GHz [Reference Briskman and Prevaux1,Reference DiPierro, Akturan and Michalski2]. The radio frequency (RF) signals are transmitted from satellites in geostationary or highly elliptical orbits and are modulated with quadrature phase shift keying (QPSK). Usually, a single antenna mounted on the rooftop of a vehicle is used for mobile SDARS reception [Reference Rabinovich, Alexandrov and Alkhateeb3]. In severe multipath fading scenarios, e.g. underneath dense foliage, reception with a single antenna can be strongly impaired [Reference Brennan4,Reference Parsons5], as their signal-to-noise ratio (SNR) history (red and orange line) drafted in Fig. 1 shows along the driving path. Depending on the system design a low SNR could even be experienced in standard reception scenarios.
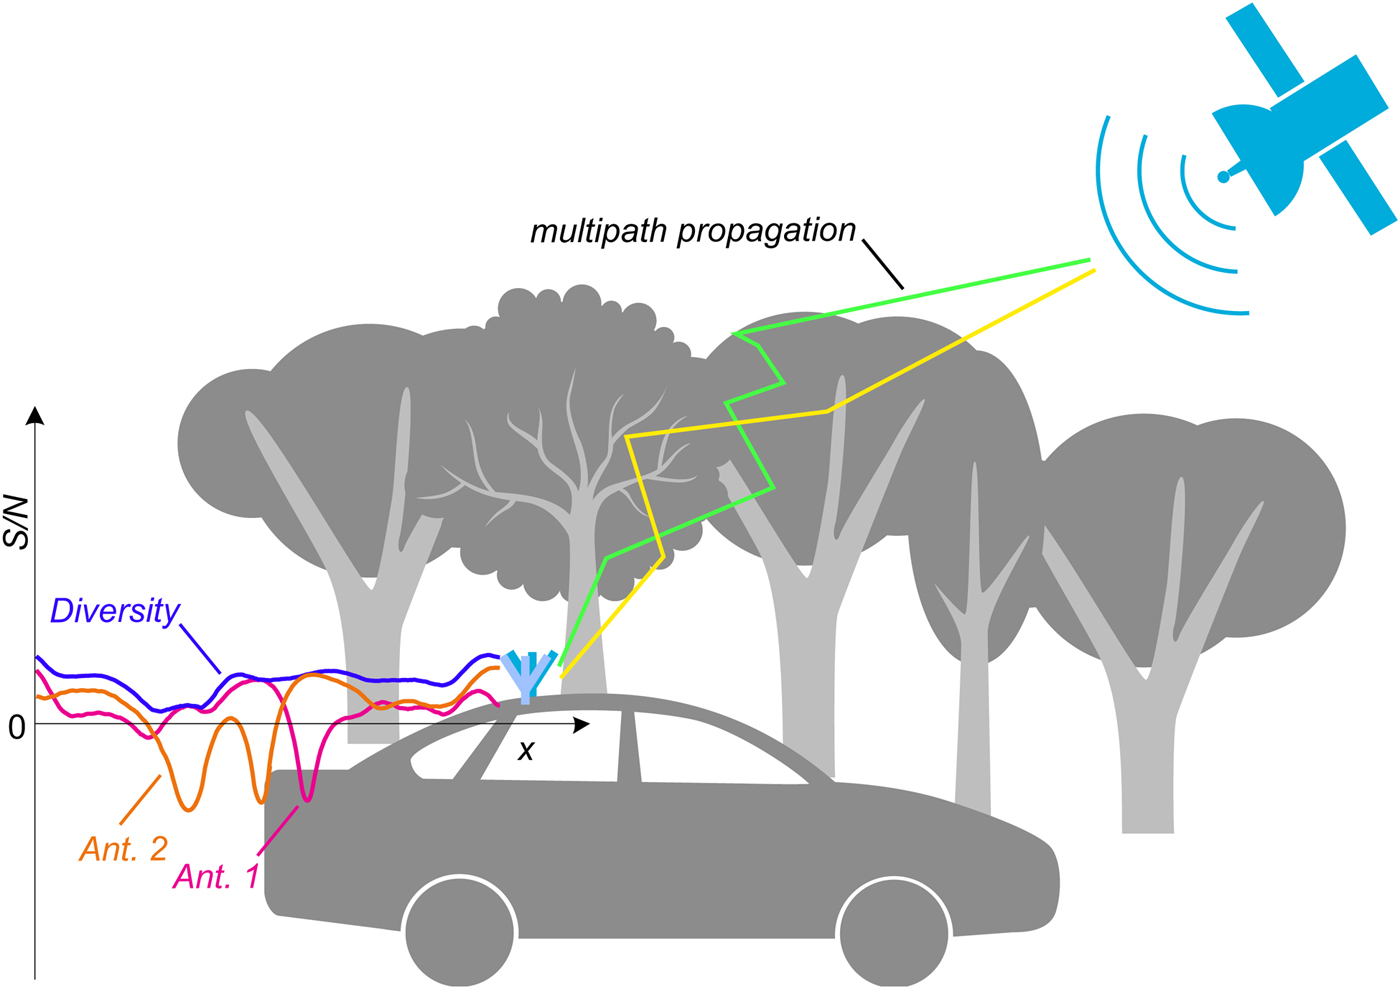
Fig. 1. SDARS reception in severe multipath fading scenarios: single antennas (orange and red line) experience deep signal fades whereas diversity (blue line) shows much better reception quality.
Antenna diversity systems in combination with antennas which provide statistically independent output signals allow for significant improvements of the received signal level in comparison with a single antenna [Reference Jakes6–Reference Mattheijssen8]. As it is drafted in Fig. 1 the SNR of the diversity signal (blue line) is significantly improved compared with the single antenna inputs by selecting and/or combining these signals. A simple scanning diversity system scans all available antenna signals for the one with the best SNR if the currently selected antenna's SNR falls below a threshold value [Reference Rappaport9]. Maximum ratio combining (MRC) diversity on the other hand weighs the antenna signals according to their SNR and aligns the signals in phase before combination thus achieving the optimum possible SNR with the given input signals [Reference Lee William7,Reference Rappaport9]. All RF signals must be available to an MRC receiver individually for analysis, therefore, a separate RF cable, variable gain amplifier, tuner and filter(s), analog-to-digital converter (ADC), and phase shifter for each antenna as well as a complex SNR estimation are necessary in such a system. This high hardware effort renders such a system prohibitively expensive for most automotive applications. Our scan-phase antenna diversity system extends the capabilities of a comparatively simple scanning diversity system by also enabling the phase detection and phase-aligned superposition of antenna signals [Reference Barié10,Reference Lindenmeier11], while still working with a standard single antenna receiver with only one RF cable.
In [Reference Lindenmeier11], the three mentioned diversity schemes were compared with respect to SDARS reception in a Rayleigh fading scenario. The best improvement of SNR is given by MRC diversity, but scan-phase antenna diversity nearly achieves the same result. Therefore, with scan-phase antenna diversity an almost optimal improvement is achieved with low technical effort. The interface between antenna assembly and receiver consists of only one RF cable, thus being the same as for a single antenna. This is important for car manufacturers, because often cables with a length of several meters have to be laid through the car towards the receiver. Using scan-phase antenna diversity, the same simple interface between the antenna assembly and the receiver as for a single antenna can be used and the radio can be kept unchanged. A block diagram as well as a picture of a scan-phase antenna diversity hardware demonstrator are depicted in Fig. 2. This hardware demonstrator was designed and built in cooperation with Fuba Automotive Electronics and implements all of the block diagram's components in a single printed circuit board (see Fig. 2). In multipath fading environments the use of several receiving antennas in combination with a scan-phase antenna diversity system has been shown, reducing audio mutes significantly compared with single antennas [Reference Senega12–Reference Senega, Nassar and Lindenmeier14]. In [Reference Senega and Lindenmeier15,Reference Senega, Kammerer and Lindenmeier16] measurements are presented which prove that even at critical mounting positions – e.g. on the dashboard or in a single side mirror – our scan-phase antenna diversity achieves excellent improvements of audio availability compared with single antenna systems.
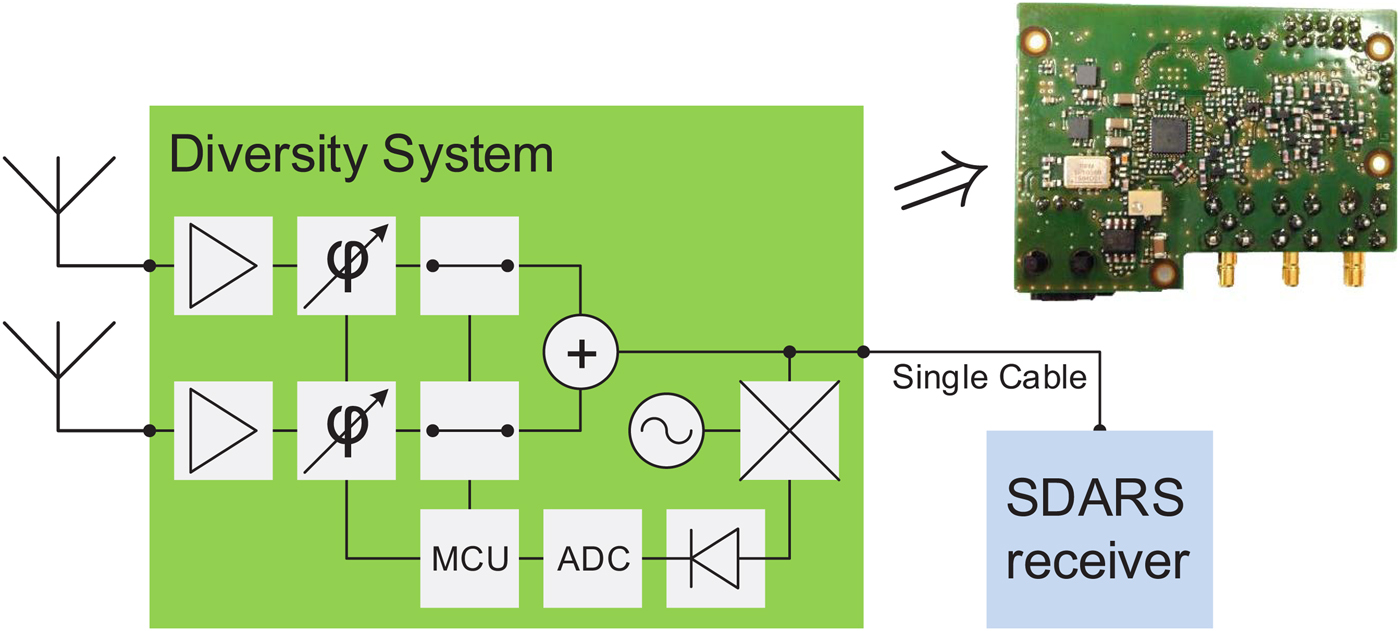
Fig. 2. Diversity system block diagram and printed circuit board of the hardware demonstrator which was used in our measurements. The printed circuit board is 60 mm × 45 mm in size.
In this paper, we describe the effect of noise on the accuracy of the level detection and phase calculation of a diversity algorithm. We show how a priori knowledge of the system's noise floor is applied in order to improve the satellite signal availability even in scenarios with very low SNR. The corrections are directly applied to the level measurement results which are used for the determination of the phase differences of the antenna signals. The noise correction method is applied in real test drive scenarios underneath dense foliage. Significantly, expanding on the theoretical considerations in [Reference Senega, Nassar and Lindenmeier17] a statistical analysis of the fading characteristics of the measurement scenario is given. Measurements of audio availability are performed using dislocated antennas as well as a micro-diversity antenna set on a single mounting position in this publication. While even a scan-phase antenna diversity system without noise correction already yields a strong reduction of audio mutes in comparison with a single antenna, the additional noise correction method leads to a significantly higher reduction of mute times by more than one order in magnitude.
Scan-phase antenna diversity
An improvement of the reception quality in terms of a reduction of the mute duration in fading scenarios is achieved by a scan-phase antenna diversity system [Reference Barié10]. A block diagram as well as a photograph of the compact printed circuit board with a size of 60 mm × 45 mm are depicted in Fig. 2. RF switches and phase shifters allow for selecting, phase-aligning, and combining the antenna signals. A small share of the output signal is down-converted in frequency, bandpass filtered, and a logarithmic detector generates a voltage which is proportional to the signal level (the channel selective logarithmic detector is the block with the diode symbol in Fig. 2). This voltage is then converted to a digital value by means of an ADC. A simple MCU reads these level measurement results and executes the diversity algorithm in periods of 200 μs [Reference Senega, Nassar and Lindenmeier14]. Since the RF signals from the satellites are QPSK-modulated the ideal signal phase varies in steps of 90°. Bit errors, thus, result only after the signal phase is distorted enough to be shifted into a different quadrant of the complex signal plane (equivalent to a phase shift of more than 45°). Although phase shifters with controllable steps of 90° would be sufficient, in order to correct these phase distortions, our diversity demonstrator enables a finer step width of 45°.
In the following, we describe the fundamental calculations of our scan-phase antenna diversity algorithm for the first time. In every period four test constellations with different combinations of antenna signals are set in order to measure the power levels from which the phase differences are determined. Fig. 3 shows a representation of an arbitrary signal constellation where A 1 and A 2 are the wave amplitudes of the signals of antenna 1 and 2, respectively, S is the sum of these amplitudes and T is the sum after rotating antenna signal A 1 by 90° in phase. The angle α describes the phase difference between A 1 and S and β between A 2 and S.
Fig. 3. Signal constellation of two single antennas showing the four test cases of the scan-phase antenna diversity algorithm in the complex plane.
The antenna selection as well as the calculation of mutual phase differences are only based on power level measurements of the four test cases with the power levels
 $$ P_{{{S}}}\sim \vert \underline{A}_1 + \underline{A}_2 \vert ^2 = S^2,$$
 $$ P_1 \sim \vert \underline{A}_1 \vert ^2 = A_1^2 , $$
 $$ P_2 \sim \vert \underline{A}_2 \vert ^2 = A_2^2 , $$
 $$ P_{{{T}}} \sim \vert {\rm j}\underline{A}_1 + \underline{A}_2 \vert ^2 = T^2. $$
From trigonometric considerations the absolute values of the mutual phase differences α and β are calculated from the levels P 1, P 2, and P S. The fourth test case allows for the calculation of the sign of the phase differences which are important for a correct phase alignment.
The law of cosines is applied if we consider for example the determination of α according to
 $$ 2 {A}_1 {S}\cos{(\alpha)}= {S}^2 + {A}_1^2 - {A}_2^2. $$
Additionally, we derive
 $$ \eqalign {{T}^2 &= {A}_1^2 + {A}_2^2 - 2 {A}_1 {A}_2 \cos{ \left( 180^{\circ} - (90^{\circ} - \varphi )\right) } = \cr & = {A}_1^2 + {A}_2^2 + 2 {A}_1 {A}_2 \sin{(\varphi) }.} $$
In Fig. 3 (green dotted line) it is visible that
 $$ {S} \sin{(\alpha)} = {A}_2 \sin{(\varphi)}. $$
In combination with equation (6) we obtain
 $$ 2 {A}_1 {S} \sin{(\alpha) } = {T}^2 - {A}_1^2 - {A}_2^2. $$
Dividing equation (8) by equation (5) yields tan(α) and thus α finally, can be expressed via the measured power values by
 $$ \alpha = \arctan{ \left( {P_{{{T}}} - P_{{1}} - P_{{2}}} \over {P_{{{S}}} + P_{{1}} - P_{{2}}} \right)} = \arctan{\left({N} \over {D} \right)},$$
where the four-quadrant arctan-function must be evaluated by considering the signs of both the numerator N = P T − P 1 − P 2 and the denominator D = P S + P 1 − P 2. The angle β is determined, respectively.
Due to the stepped phase shifter topology, there is no need to actually evaluate the arctan-function in the MCU which takes between 80 μs and 130 μs depending on the input values. In order to calculate the optimum settings for our phase shifters with a step width of 45° the following analysis is used instead. The analysis is based on the fact that  $\tan (22.5^{\circ }) = 1/\sqrt {2}$ and $\tan (67.5^{\circ }) = 1 + \sqrt {2}$ and makes use of the variables N a = |N|, D a = |D|, $D_{{{u}}} = D_{{a}}/\sqrt {2}$, and $D_{o} = D_{a} \cdot (1 + \sqrt {2})$. The phase evaluation is then done according to Table 1. This phase detection algorithm avoids the time consuming arctan function in the small MCU and replaces it with only a small number of very simple instructions, each of which is executed within one or a few MCU clock cycles. The maximum total time it takes to calculate one phase value according to this algorithm in our hardware demonstrator is measured to be 35 μs compared with approximately 130 μs for the arctan function.
Table 1. Evaluating phase differences of two signals from the four measured test cases for angle steps of 45° (ε < 22.5°)

Influence of noise on phase calculation
Due to the high free-space path loss of approximately 190 dB from the geostationary satellite to the receiving antenna low-power signals must be processed by the diversity system. A spectrum of such a noisy received antenna signal relative to the line-of-sight (LOS) level is depicted in Fig. 4. Other reasons for low signal power or high noise power – both of which result in lower SNR values – can be caused by multiple aspects of the overall reception system. For cars in which rooftop mounting of the SDARS antenna(s) is not possible, unconventional mounting positions can result in disturbed antenna patterns and reduced antenna gain and/or efficiency. These individual antenna impairments are overcome by the combination of multiple antennas in our diversity system. Nonetheless, these low signal powers necessitate in a high-level detection accuracy even in cases of very low SNR close to 0 dB.
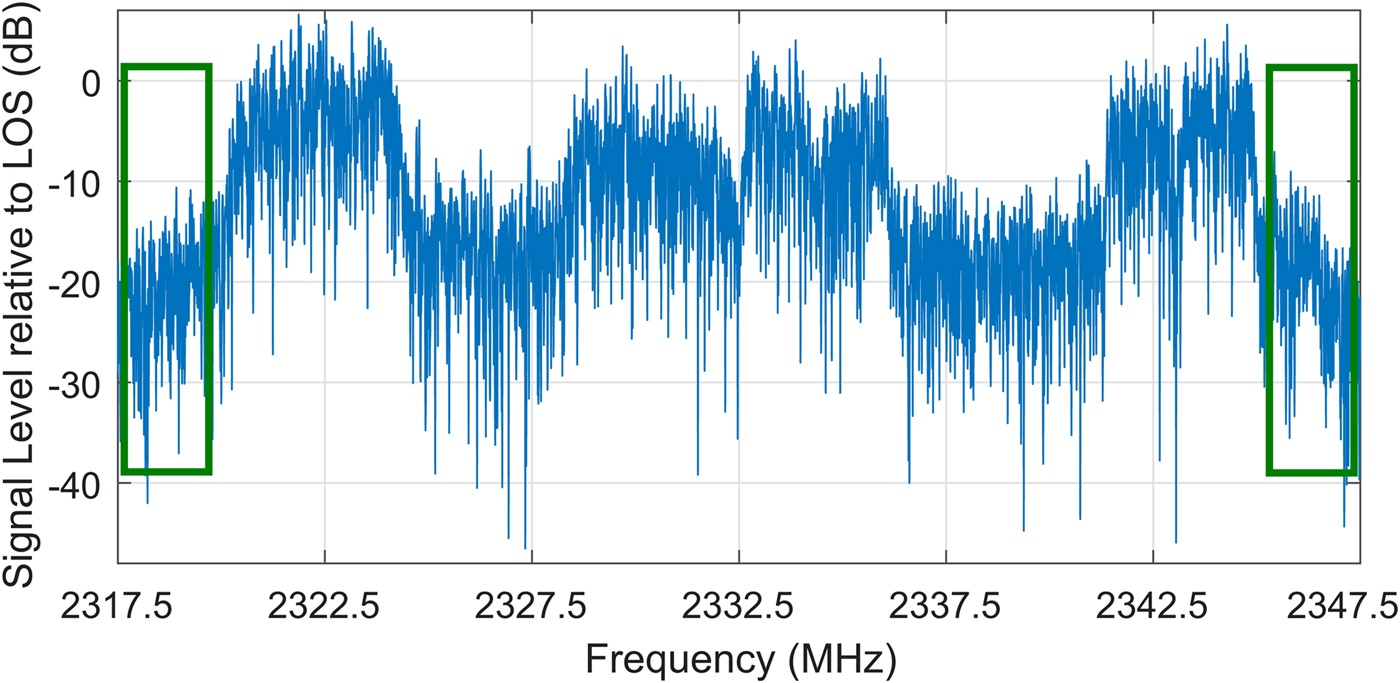
Fig. 4. Signal spectrum of a noisy satellite radio signal normalized with respect to the LOS level. Out-of-band noise levels can be measured in the frequency bands indicated by green rectangles.
An advantage of our approach to the correction of noise influences on the level detection accuracy is that with the same method we can correct for non-linearities in the detection circuitry. Those non-linearities are especially noticeable close to the lower end of the dynamic range of the logarithmic amplifier, as it will be shown later. By correcting for non-linear and noisy input levels we can even simplify the diversity hardware itself by reducing the gain of the level detection circuit or alleviating noise figure specifications, both of which can result in a reduced hardware effort.
In the following we derive a critical noise power PN crit above which phase distortions due to an erroneous calculation of the phase changes for signal optimization exceed 45°. This is considered as a critical value for the QPSK-modulated signals above which the probability of bit errors increases significantly. In Fig. 5 the complex signal vectors of A 1, A 2, and their superposition S are depicted. The black vectors show the wave amplitudes of which we assume that a phase aligned superposition will optimize the reception quality by perfectly aligning them at the phase of the current superposition S. Thereby the ideal signal amplitude (the sum of both individual signals) would be available to the receiver while avoiding phase distortions Δγ > 45° which would cause bit errors due to the phase modulation of the SDARS signals. With the influence of noise on the level measurements deviating phase results are calculated and result in an inferior alignment with lower amplitude and even phase deviations from the previous signal phase. The angle γ of S equals α in the case depicted in Fig. 5.
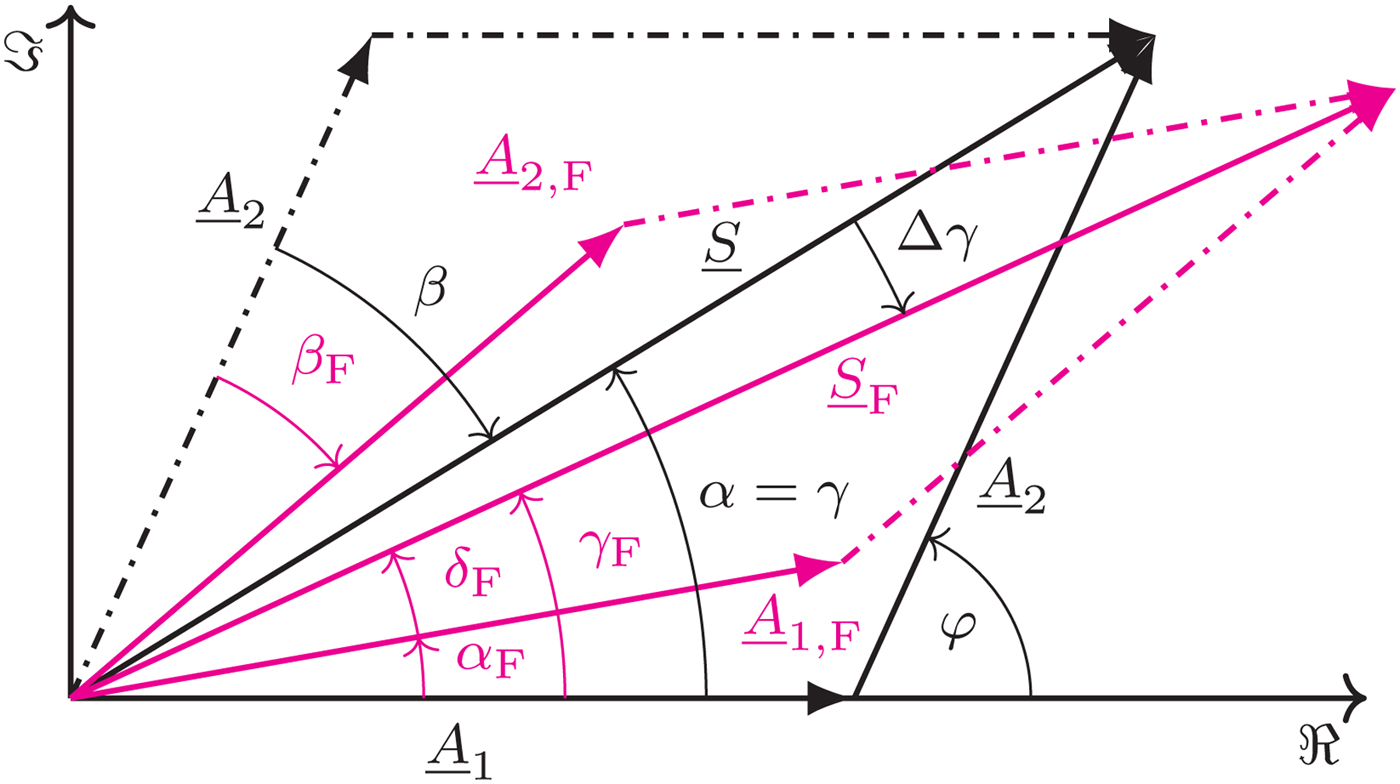
Fig. 5. Complex signal diagram with correct (black) and erroneous (red) summed signals due to noise-influenced phase calculations (e.g. due to low SNR signals).
An erroneous calculation resulting in phase distortions of the diversity signal arises if all signal levels are superimposed with the noise power PN. The phase calculation of α changes from equation (9) to
 $$ \alpha_{{{F}}} = \arctan \left({P_{{{T}}} - P_1 - P_2 - PN} \over {P_{{S{}}} + P_1 - P_2 + PN} \right). $$
Fig. 5 shows such a case in red where the antennas 1 and 2 are phased with angles α F and β F instead of the optimal values, leading to a new superposition of antenna signals with a phase deviation Δγ to the previous case. The phase distortion of the superposition of the antenna signals can be calculated according to
 $$ \Delta\gamma = \gamma_{{{F}}} - \gamma = \gamma_{{{F}}} - \alpha = \alpha_{{{F}}} + \delta_{{{F}}} - \alpha , $$
using the results of equations (9) and (10). With the power P S,n of S F = A 1,F + A 2,F and P T,n accordingly, the angle δ F is
 $$ \delta_{{{F}}} = \arctan \left( {P_{{{T},{n}}} - P_1 - P_2} \over {P_{{{S},{n}}} + P_1 - P_2} \right). $$
The power P S,n of the erroneous new signal sum is
 $$ P_{{{S},{n}}} = P_1 + P_2 + 2 \cdot \sqrt{P_1 \cdot P_2} \cdot \cos (\varphi - (\alpha_{{{F}}} + \beta_{{{F}}})). $$
The power P T,n can be derived accordingly. Bit errors can be avoided if phase distortions do not exceed a critical value of |Δγ| < 45° so that a critical noise power PN crit can be calculated at which the condition
 $$ \Delta\gamma \vert _{PN = PN_{{crit}}} = 45^{\circ}, $$
is met. This critical noise power PN crit depends on the signal constellation in terms of the ratio of the two antenna signals' powers as well as their phase difference φ at the beginning of the measurements. The resulting phase distortion is
 $$ \eqalign {\Delta \gamma = & \arctan \left( {P_{{{T}}} - P_1 - P_2 - PN} \over {P_{{{S}}} + P_1 - P_2 + PN} \right) \cr & + \arctan \left( {\sqrt{P_1 \cdot P_2} \cdot \sin ( \varphi - (\alpha_{F} + \beta_{F}) )} \over {P_1 + \sqrt{P_1 \cdot P_2} \cdot \cos ( \varphi - (\alpha_{F} + \beta_{F}) )} \right)\cr &- \arctan \left( {P_{{{T}}} - P_1 - P_2} \over {P_{{{S}}} + P_1 - P_2} \right) ,} $$
where α F and β F are also functions of the noise power PN. The power ratio of the individual antennas only needs to be considered in a certain range around 0 dB (equally strong antenna signals). This can be shown by a calculation of the SNR of the output signal from input signals with differing SNR values. A numerical evaluation of equation (15) for the critical noise power PN crit which meets equation (14) is sufficient for a range of − 7.7 dB ≤ P 1/P 2 ≤ +7.7 dB. This corresponds to an amplitude ratio in the range of  $(\sqrt {2} - 1) \lt \vert \underline {A}_1 \vert / \vert \underline {A}_2 \vert \lt 1/(\sqrt {2} - 1)$). At more extreme power ratios, the antenna with the lower power will be switched off due to the noise contribution of the antenna signal with the lower SNR to the combined signal. The whole range of phase differences 0° ≤ φ < 360° is considered here for completeness even if values close to 180° are highly unlikely due to the continuous operation of the fast scan-phase antenna diversity system.
The result of this analysis is depicted in Fig. 6 and shows that the highest influence of the noise power PN on the error of the calculated phase values arises around a phase difference of φ = 180° for similar signal levels of the two antenna signals. This is to be expected because of the cancelation of the signal sum in such a case, whereby, even small distortions of the measured level because of noise will result in large phase calculation errors.
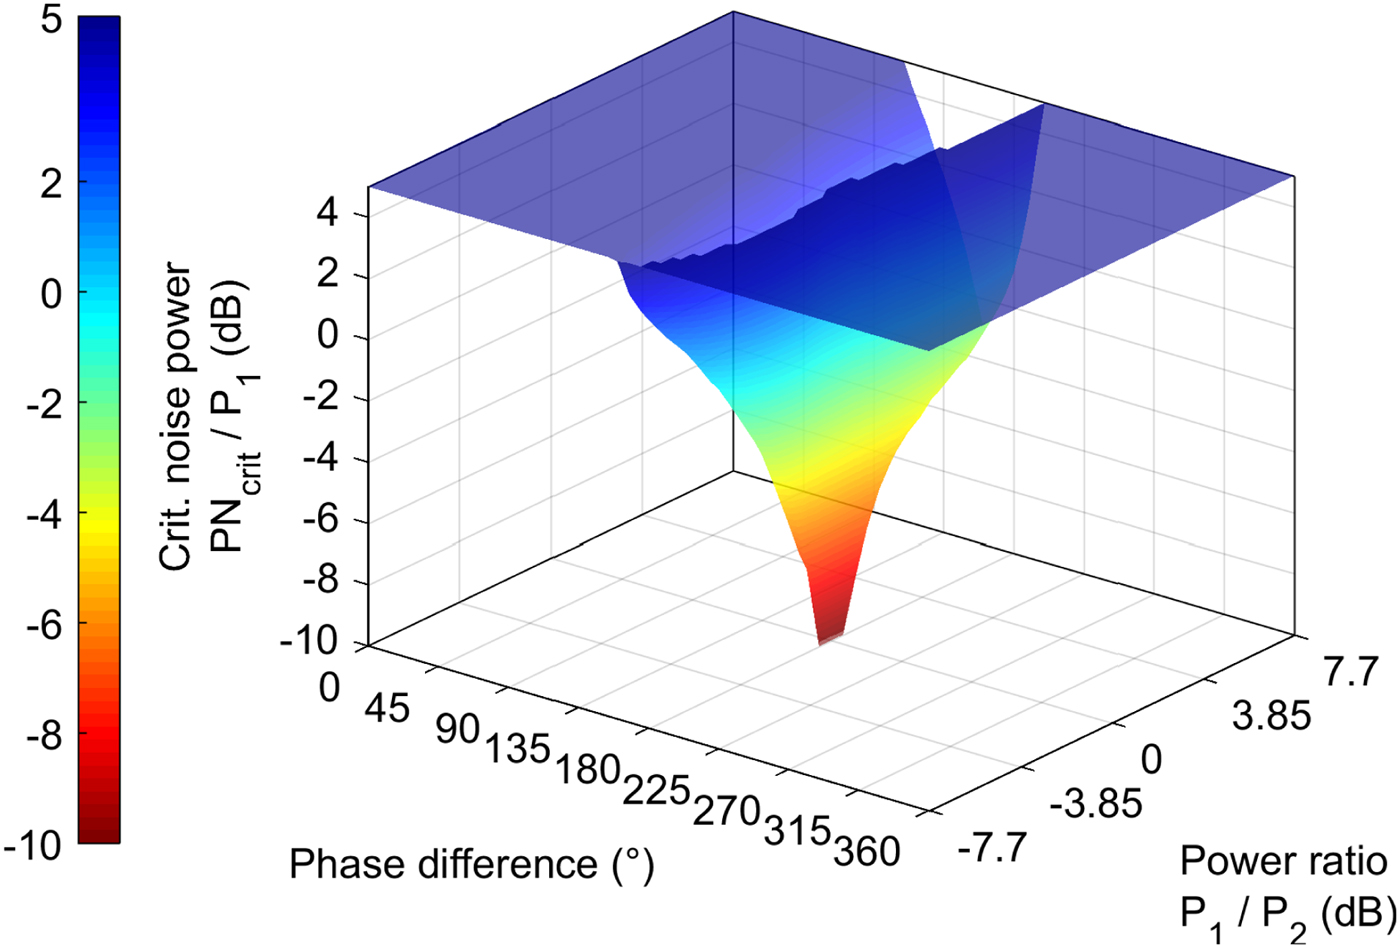
Fig. 6. Critical noise power ratio PN crit/P 1 for various power ratios P 1/P 2 and phase differences φ of the two antenna signals. The values are bound within the depicted axis limits.
Fig. 7 shows this in more detail for several phase differences φ between the two antenna signals around 180°. While a measure for the necessary detection accuracy in the presence of noisy signals is derived from these results, also the importance of fast diversity reaction times must be pointed out because phase differences are kept closer to 0° if optimizations in short periods are ensured.
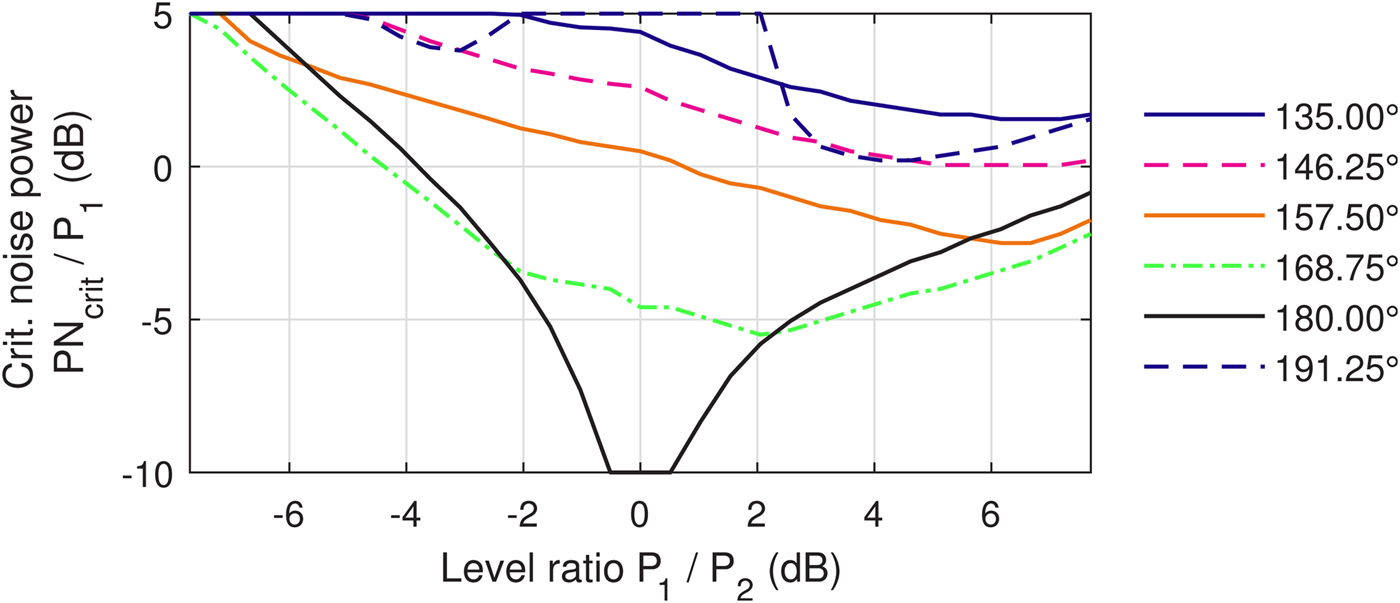
Fig. 7. Critical noise power ratio PN crit/P 1 for phase differences φ of the individual antenna signals close to 180°.
Improving the phase calculation accuracy
Based on the presented theory the noise level information is acquired from laboratory measurements of the system's noise floor. In frequency ranges where external noise received by the antenna cannot be neglected, out-of-band noise measurements could be applied in order to supplement the measured noise influences of the circuit itself as it is depicted in Fig. 4, but this is not implemented yet. For the pre-calculation of the values for noise correction we logged the level detection results for known input levels of a sinusoidal signal within the satellite signal's frequency band. Fig. 8 shows measured signal levels for a level sweep as well as corrected measurement results. In systems comprising a power measurement in linear values (equal or proportional to Watts) a constant noise power can simply be subtracted in order to gain the wanted signal power without noise. Because the level detection in the discussed diversity demonstrator yields logarithmic measurement results a more complex calculation must be used.
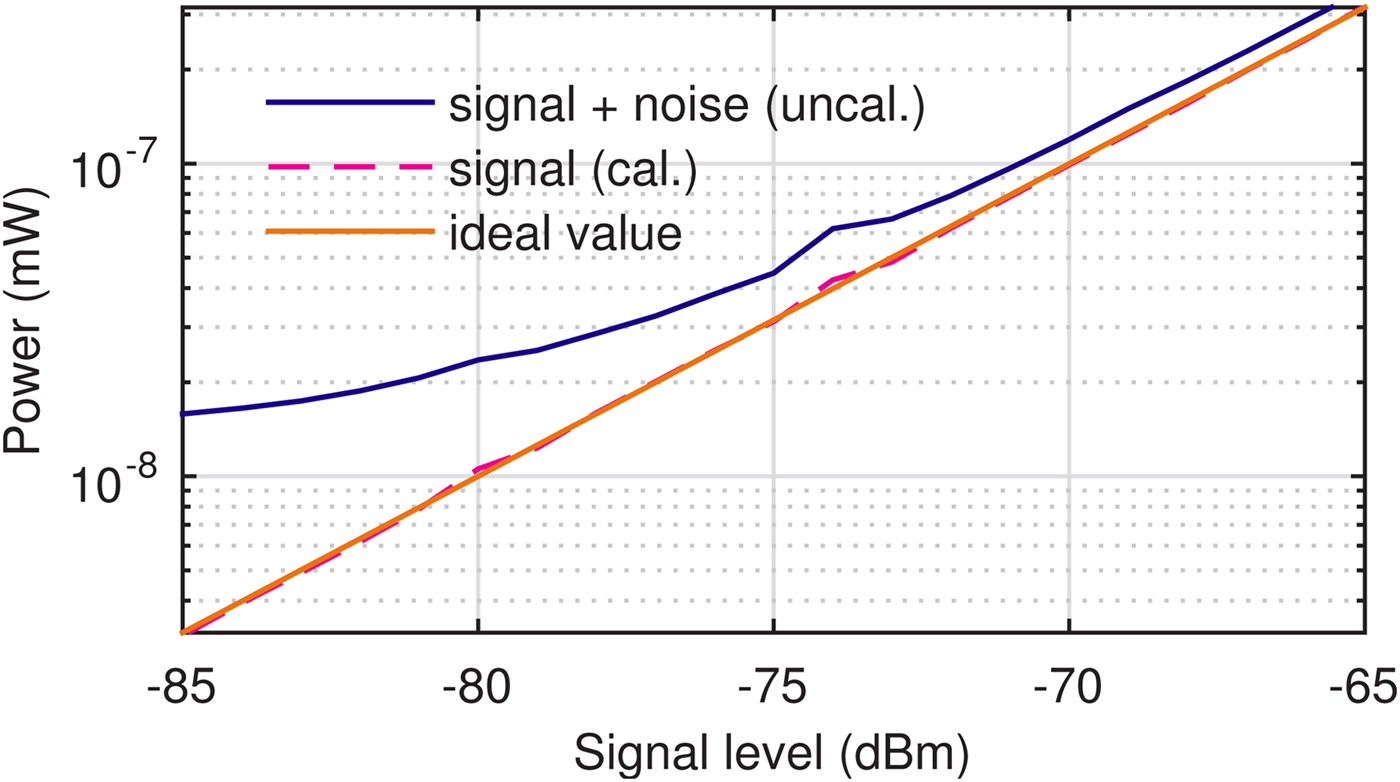
Fig. 8. Measured level value converted to power: Uncalibrated and calibrated result compared with ideal value.
The measured levels are matched to an extrapolated linear characteristic which is determined from measurements at high-input levels where distortions from noise are negligible. This is equivalent to reading the value of the ‘ideal value’ from Fig. 8 for the measured value of ‘signal + noise (uncal.)”. In order to keep processing time low and because memory usage is no significant concern, a pre-calculated lookup-table is used to convert the measured levels to corrected values. As it can be seen in Fig. 8 non-linearities in the level detection characteristic (e.g. the small bump in the blue line at −74 dBm) are corrected as well in the calibrated measurement result (dashed magenta line).
Another lookup-table converts the measured and corrected logarithmic values to their corresponding linear powers which are used in the phase calculations. Currently, this correction is applied assuming constant noise contributions to the received signal. In the future, we plan to extend this by performing additional measurements of out-of-band noise levels within the frequency bands indicated in Fig. 4. With this information changes in external noise sources as well as temperature-induced deviations from the pre-determined values will be accounted for.
Diversity system test drive results
Test track, signal recording, and statistical analysis
Test drives on a circular test track in a real fading scenario as well as laboratory measurements with recorded antenna signals from the same scenario have been conducted. Our equipment allows for the simultaneous recording of up to four antenna signals and also the playback of those recorded signals in order to perform repeated measurements of different hardware prototypes as well as diversity algorithms. It is based on a National Instruments PXIe platform with four Vector Signal Transceivers (VST) PXIe-5644 which can record up to 80 MHz of bandwidth in a frequency range up to 6 GHz [Reference National Instruments18]. Pre-amplifiers with a gain of 20 dB and a noise figure of 0.6 dB, which are specifically designed for SDARS applications, are used in order to reduce the noise figure of the recording and playback equipment. A bandwidth of 30 MHz (all available SiriuxXM bands have a total bandwidth of 25 MHz) has actually been recorded with a hybrid analog down-conversion to an intermediate frequency of 20 MHz followed by a digital down-conversion to the baseband, all in the VSTs. A statistical analysis of the reception scenario is presented which is based on the recorded test drives. The signal quality is measured for the diversity system without as well as the system with noise correction and compared with the ones of the respective single antennas using off-the-shelf SDARS receivers.
The antenna signals have been recorded in a real fading scenario in the USA in May 2016. The test track is a quasi-circular set of roads in hilly terrain underneath dense foliage of broad-leaf trees interspersed with a minor number of coniferous trees in the north-eastern USA. A map of the track as well as a photograph of a typical scene along the test track is depicted in Fig. 9. The total length of the test track is approximately 2 km, and two drives around the track are considered for a single measurement result. Taking the driving speed of approximately 40 km/h into account, this results in a total time of about 400 s per test drive, of which 380 s are actually analyzed in order to allow for the initial synchronization of the SDARS receiver in a newly started playback.
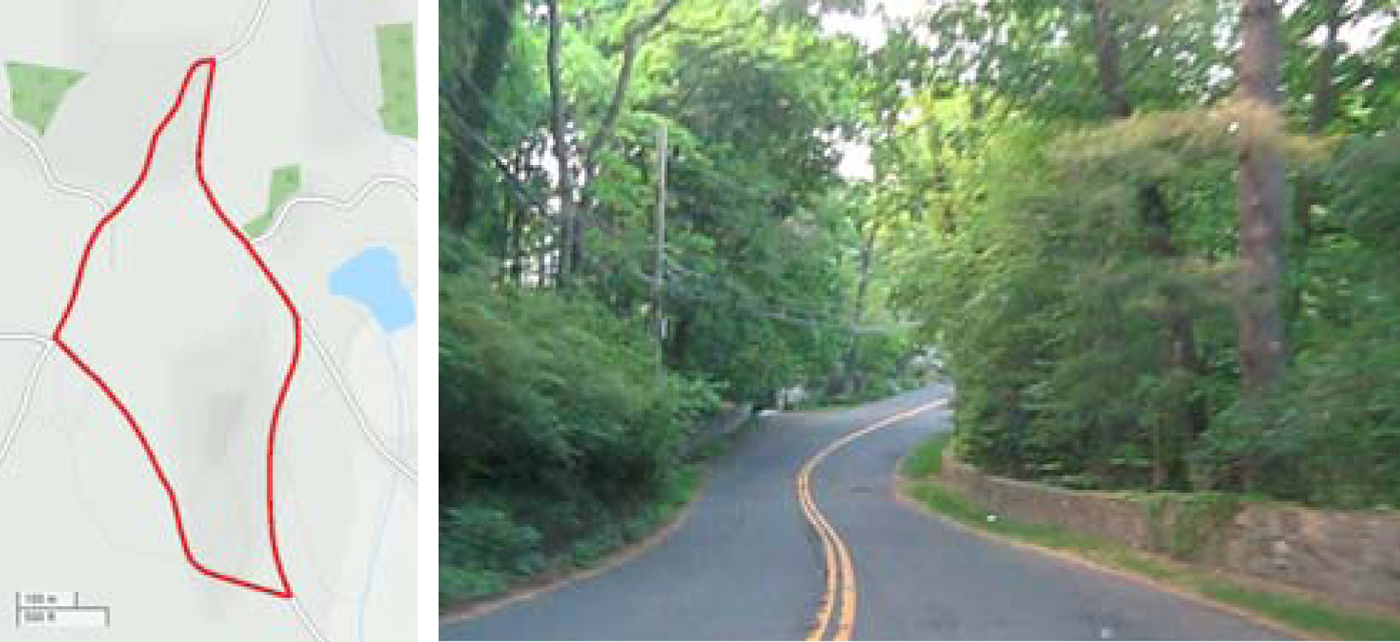
Fig. 9. Left: Test track underneath dense foliage in the north-eastern USA (red; map background © OpenStreetMap contributors). The total length of the track is approximately 2.15 km. Right: Photograph of a typical section of the test track.
For several different antennas and mounting positions RF antenna signals have been recorded and measured. Two off-the-shelf SDARS patch antennas mounted on both front fenders as well as a two-signal diversity antenna set consisting of two loop antennas in a single mounting volume are analyzed. Fig. 10 shows a picture of the antenna positioning. It can be noticed that both antennas are tilted away from the car's center line. This placement causes impairments on antenna pattern roundness, gain and/or received SNR as it is shown for example in [Reference Bekaryan19] which are unavoidable when unconventional antenna mounting positions are to be used because of the available antenna mounting volume, the size and shape of the available ground plane as well as shadowing caused by the car body itself.
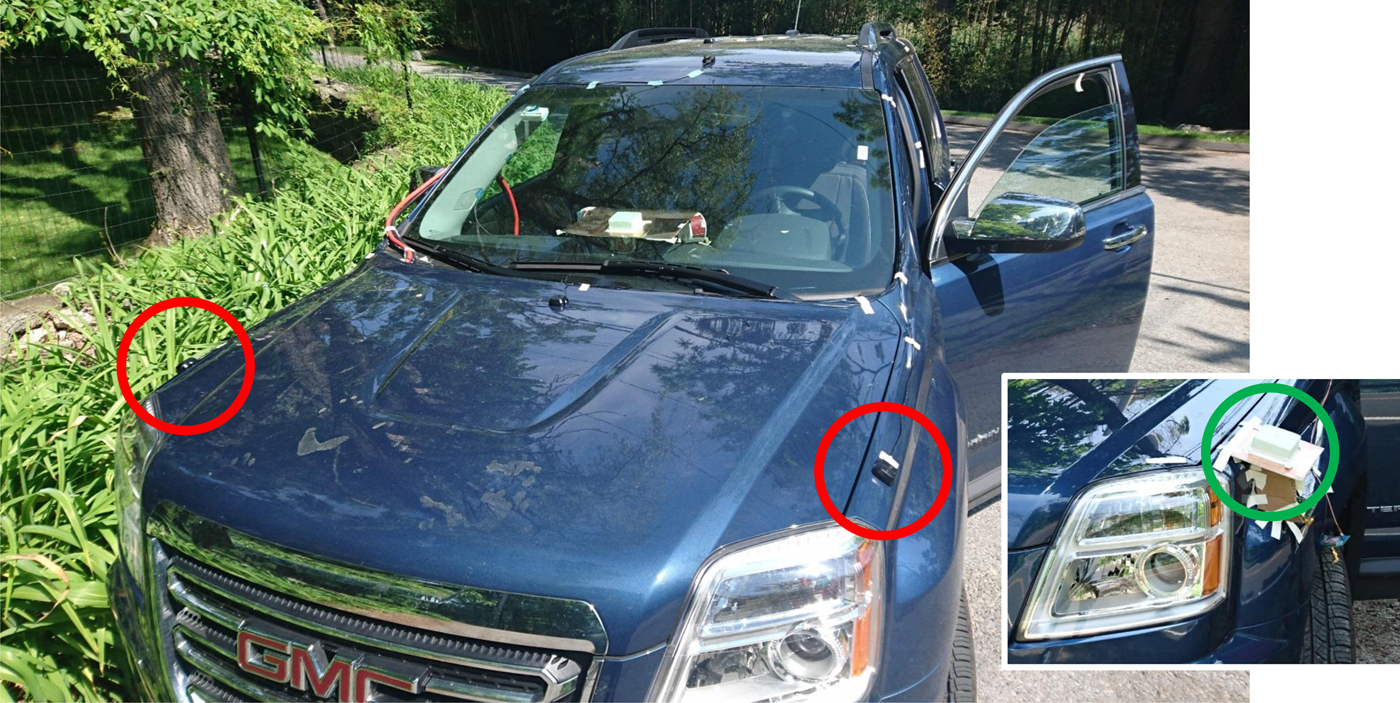
Fig. 10. Antenna mounting positions of the measured antenna sets on the front fender(s). Big photograph: two dislocated off-the-shelf patch antennas (red circles). Image inset: diversity antenna set (green circle) consisting of two loop antenna structures with two output signals on a single mounting position.
An analysis of the recorded antenna signals of the patch antennas shows the statistical properties of the reception scenario. In Fig. 11 a plot of the signal levels of the patch antennas over time of the received signal transmitted by a geostationary satellite is depicted. It can be noticed that two laps of driving along the same test track have been recorded. Slow fading effects are visible in a similar way in both halves of the recording, which are caused by obstructions along the track by the hilly terrain and high-foliage trees. Further differences can be noticed upon closer inspection of the depicted level plots. The fast fading due to multipath propagation in the dense foliage leads to high relative frequencies of low-signal levels as the probability density plot of the recorded antenna signal amplitudes in Fig. 12 shows.
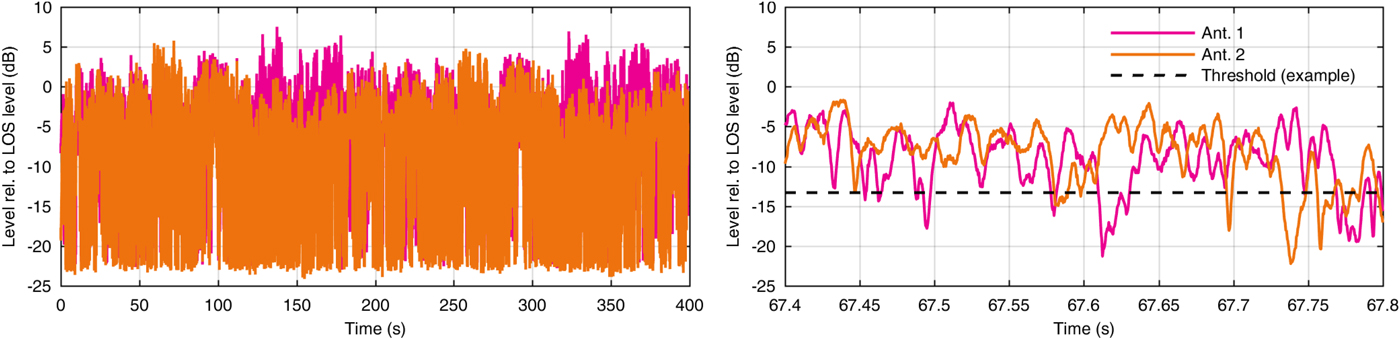
Fig. 11. Left: single antenna signal levels of the received signals of the geostationary SDARS satellite relative to the mean LOS signal level along two rounds on the test track. Right: detailed view of the single antenna signal levels and exemplary threshold for the analysis of the ratio of signal levels below the respective threshold .
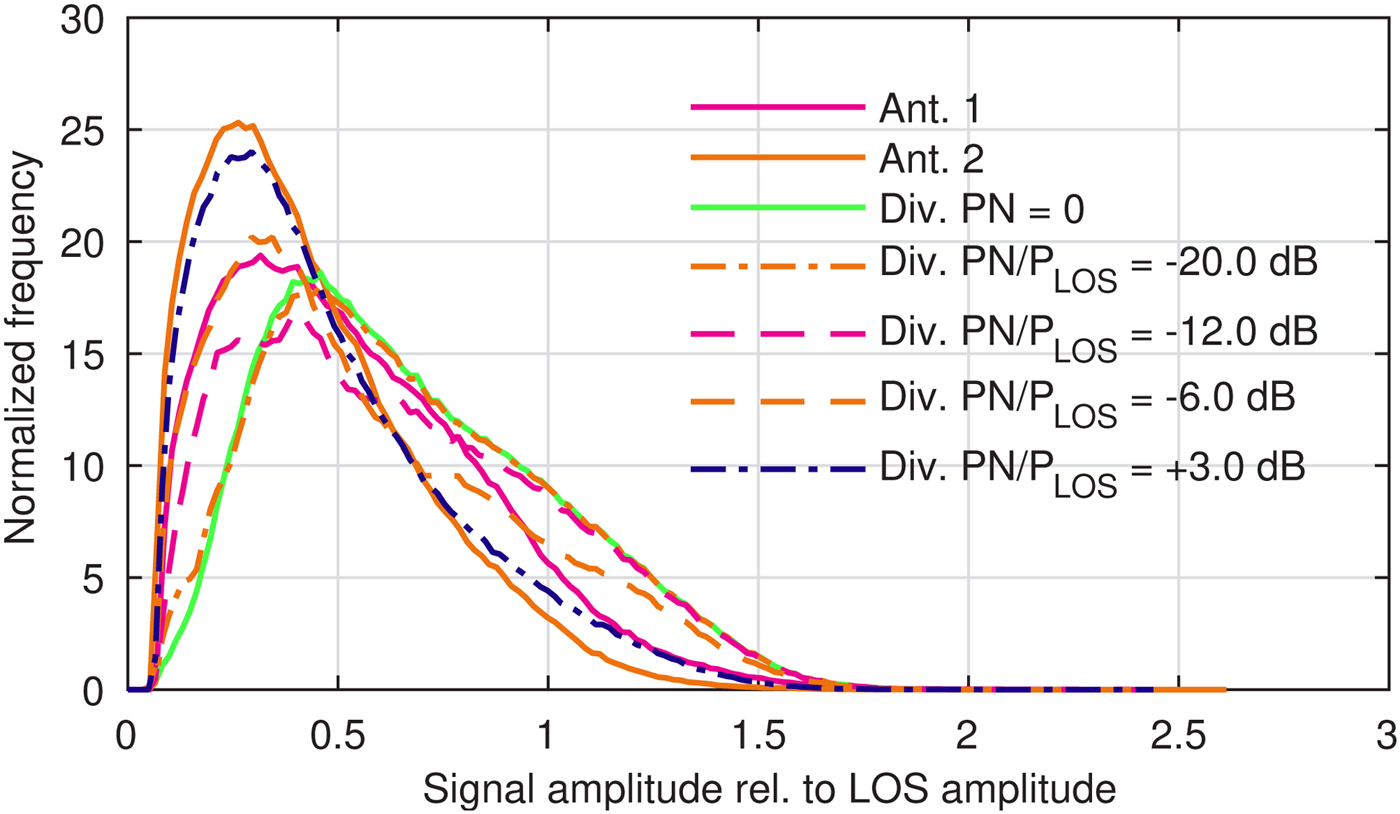
Fig. 12. Normalized histogram of the signal amplitudes of the geostationary satellite's signal received by two single antennas in a fading scenario as well as of a simulated scan-phase antenna diversity system with noise power PN in the level detection path.
In the following, we investigate the statistical behavior of a simulated scan-phase antenna diversity system (which implements the diversity algorithm presented in the previous sections) in the presence of a range of additional noise influences on measured levels which are used in the phase calculation. The diversity system's output signal amplitude has been analyzed and is depicted in Fig. 12. Simulations of an ideal system where the noise power PN = 0 have been conducted and are compared with results from simulations with noise influences in the range of − 20 dB ≤ PN/P LOS ≤ +3 dB in order to account for different levels of external and internal (relative to the diversity circuit) noise contributions. All simulations consider the 45° step size of the diversity system's phase shifters. It can clearly be seen that the simulated scan-phase antenna diversity system with low noise powers PN – which corresponds to a system which applies our noise power correction method – shows improvements of the signal amplitude statistics in two distinct aspects. Firstly, the average signal amplitude is improved compared with those of the two single antenna input signals. Secondly, very low signal amplitudes are much less common because the diversity system avoids antenna signals with very low-signal amplitudes by switching them off completely. This improves the SNR of the output signal because the noise influence by this antenna cannot enter the signal path to the receiver. With higher noise powers PN the phase calculation results differ from the true noiseless value which results in suboptimal phase alignment of the antenna signals. For PN/P LOS = −20 dB the histogram shows strong similarities to that of the ideal case PN = 0, whereas significant deviations from ideal results can already be noticed for PN/P LOS = −12 dB.
Based on the recorded signals the probabilities of the single antennas’ signal levels to fall below a threshold value have been analyzed. An example of such a threshold analysis is depicted in the detailed level plot on the right hand-side of Fig. 11. The probabilities have been calculated for a single frequency (of the geostationary satellite). In order to estimate the respective probabilities for both frequencies of the SDARS system, we utilize the fact that the signal levels of both frequencies are fading independently but with the same probability. Therefore, the squared probability values of the single-frequency results denote the estimated two-frequency fading probability and are depicted in Fig. 13. A simulated scan-phase antenna diversity system has been analyzed as well and the results are also depicted in Fig. 13. If for example a threshold of −13.2 dB below the average LOS level would denote the distinction between an available signal and an audio mute, then the two single antennas would show probabilities to fall below this threshold of approximately 1.56% and 3.85%, respectively. Applying the scan-phase antenna diversity system to these two antenna signals lower probabilities depending on the noise power PN are achieved. An approximate probability of 0,86% is calculated for PN/P LOS = −12 dB which is only 2% above the better single antenna in this scenario. This result can be improved to 0.23% for PN/P LOS = −20 dB. The ideal diversity system with PN = 0 yields a mute ratio of 0.11% based on the signal levels thus clearly showing the advantage of using our noise power correction method.
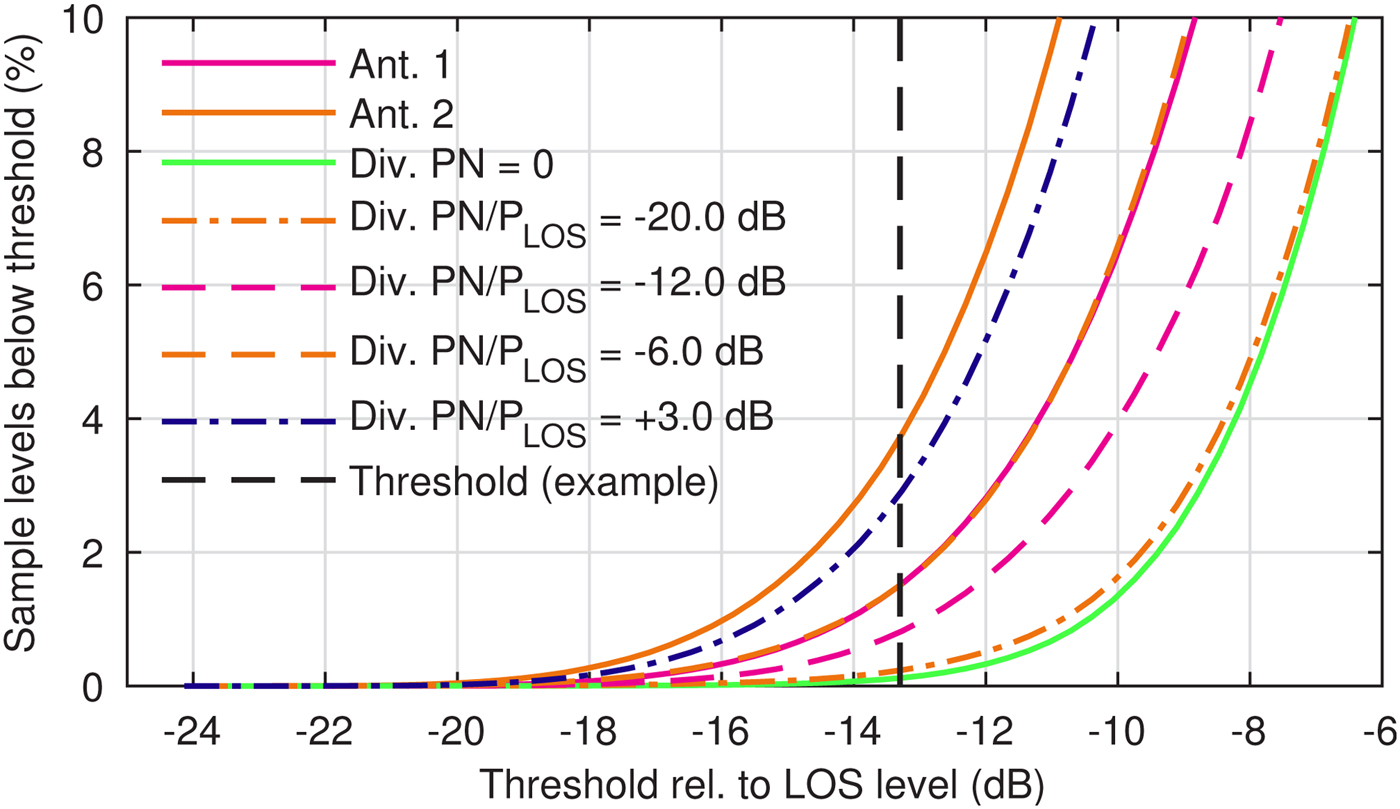
Fig. 13. Estimated fading probability (level falls below the respective threshold) of a two-frequency satellite signal of two single antennas as well as of a simulated scan-phase antenna diversity system with noise power PN in the level detection path.
The true audio availability of the antenna signals is not commonly available from simulations because the detailed description of the complex RF and audio signal processing in the receiver is confidential and thus non-disclosed. For the same reason the simulation of the improvement of the audio availability realizable by the diversity system compared with the single antennas is not commonly possible. Measurements of the improvement of audio availability realizable by the diversity system can be performed using our RF signal recording and playback equipment in the laboratory described in [Reference National Instruments18]. By using recorded antenna signals, we can repeatedly measure the audio availability of different diversity algorithms using true RF satellite signals from fading scenarios without the ambiguity of repeated test drives even on the same track (ambiguity because of the exact driving track on the road, weather conditions etc.). Also by supplying different systems with exactly the same signals the comparability of the corresponding results is ensured, thus, avoiding usual drawbacks of live test drives.
Measured signal availability
In order to assess the performance of single antenna reception as well as of our diversity system, we recorded the various antenna signals along the test drives as shown in Fig. 9. The audio availability of the two single antennas as well as of the scan-phase antenna diversity system has been measured using these recorded RF signals.
The diversity measurements compare the audio availability without and with the correction of noise influences on the level detection accuracy and are conducted using all available satellite signals and unmodified SDARS receivers. The average results of five individual measurements (each with a duration of 380 s) are given in Table 2 for the test case where dislocated patch antennas have been used. Fig. 14 shows the occurrence of audio mutes for the two single antennas and both diversity configurations as black dots. The displayed recordings are individual measurements which have been chosen to match the average mute durations in Table 2 closely. Our results show that the diversity system can significantly reduce audio mutes in fading scenarios from an average of 12.2 s of the single antennas to 3.34 s by a factor of approximately 4. Based on measurements from more complex system demonstrators higher improvement factors of around one order in magnitude could be achieved with more gain and lower noise figures of the level detection circuit due to the non-linearities at low signal levels. The correction of noise influences on the level detection further improves this results by reducing the mute time to 0.29 s which is by a factor of around 40 lower than the best single antenna, thus rendering a more complex hardware unnecessary.
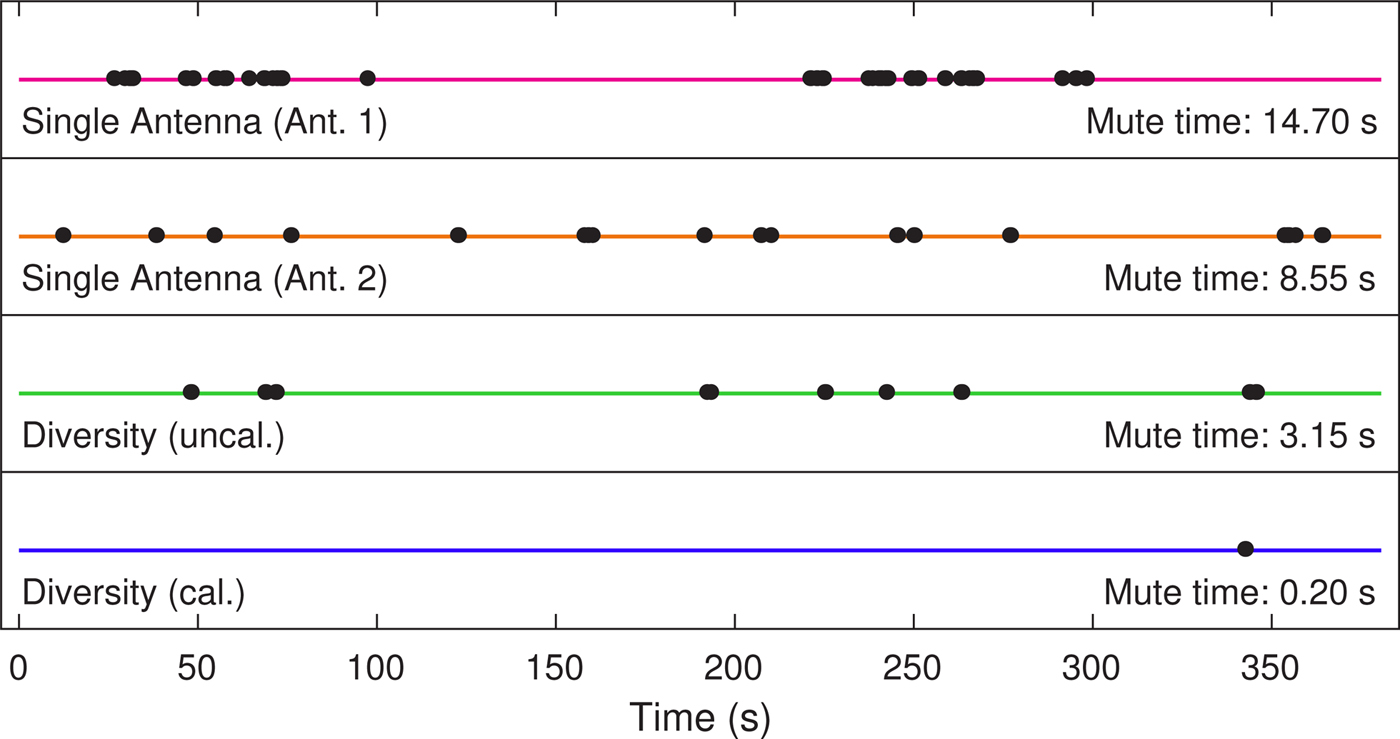
Fig. 14. Measured audio mutes of respective individual measurements of the single dislocated off-the shelf patch antennas and scan-phase diversity demonstrator from Fig. 2 with and without calibration. All available satellite signals have been used by the receiver.
Table 2. Comparison of average audio mute durations (each over five measurements of the respective setup) from all available satellite signals in a real fading scenario recorded on test drives in the USA: Conventional single antenna reception system and the compact diversity system on a single printed circuit board

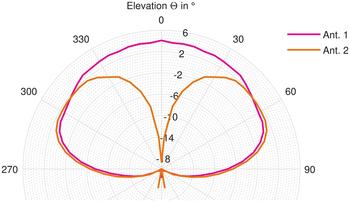
In addition to the dislocated antenna mounting positions previously described we also investigated a diversity antenna set with two SDARS antennas in a single mounting volume on the left front fender (see image inset in Fig. 10). The realized gain over the elevation angle Θ averaged over all azimuth angles Φ is depicted in Fig. 15. The antennas have been mounted on a circular ground plane with bent edges with a total diameter of 1.2 m and measured in an anechoic chamber. In such a mounting position especially Antenna 1 achieves a realized gain which meets the typical service requirements. Antenna 2 perfectly complements Antenna 1 in a diversity set since its highest gain is realized at an elevation angle Θ of 50° from zenith where geostationary satellites are located relative to the receiving antennas.
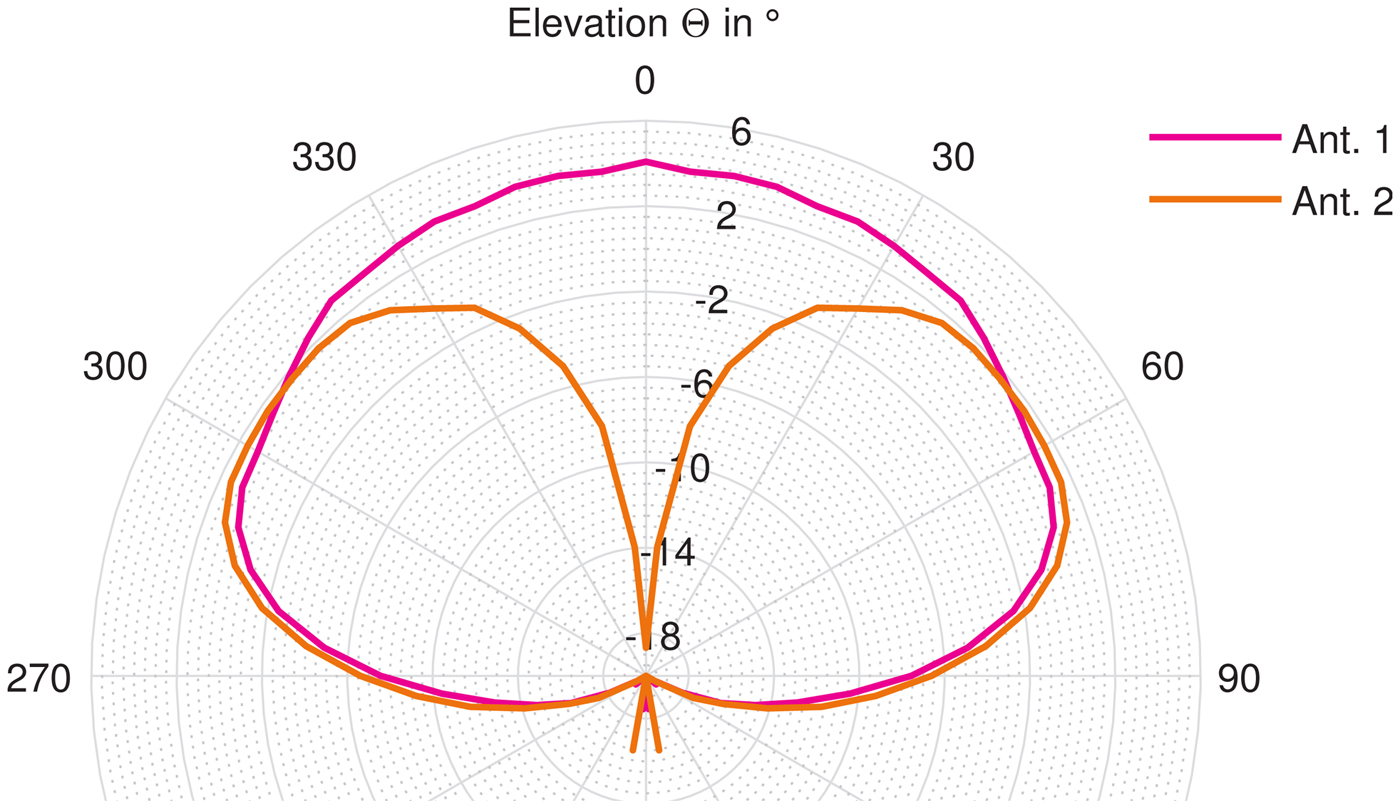
Fig. 15. Measured average realized gain of the two single antennas of the diversity antenna set on one mounting position (averaged over all azimuth angles Φ). The measurements were taken in an anechoic chamber, the antenna was mounted on a circular ground plane of 1.2 m diameter.
Mounting the antenna set at the exact hidden mounting position of an antenna in series production has been impossible, because the test car had to be handed back in a condition similar to the one in which it was given to us. The antenna was instead mounted on the outside of the car's chassis on a small, flat rectangular ground plane with a side length of 16 cm and a slant angle of approximately 20° (Fig. 10, right side). In critical mounting situations where even higher tilt angles, smaller ground planes and hidden mounting positions are chosen, antenna characteristics change dramatically and the average gain at the elevation angle of the satellite position may decrease by several dB. Even a curved rooftop, where a large metallic ground plane is available, can significantly modify the pattern of SDARS antennas at that position as shown in [Reference Bekaryan19]. In order to take this into consideration, we reduce the SNR at the input of the diversity circuit in a way which is equivalent to a slight decrease in antenna gain by 0.6 dB. This is done by inserting an attenuator, an amplifier and a further attenuator at each of the two input ports of the diversity circuit. These components lead to no additional gain with deviations of less than ±0.3 dB, but a decrease in SNR which corresponds to a decrease of 0.6 dB at the air interface. In Fig. 16 the measured audio mutes are shown for the single antennas as well as for diversity with and without noise correction.
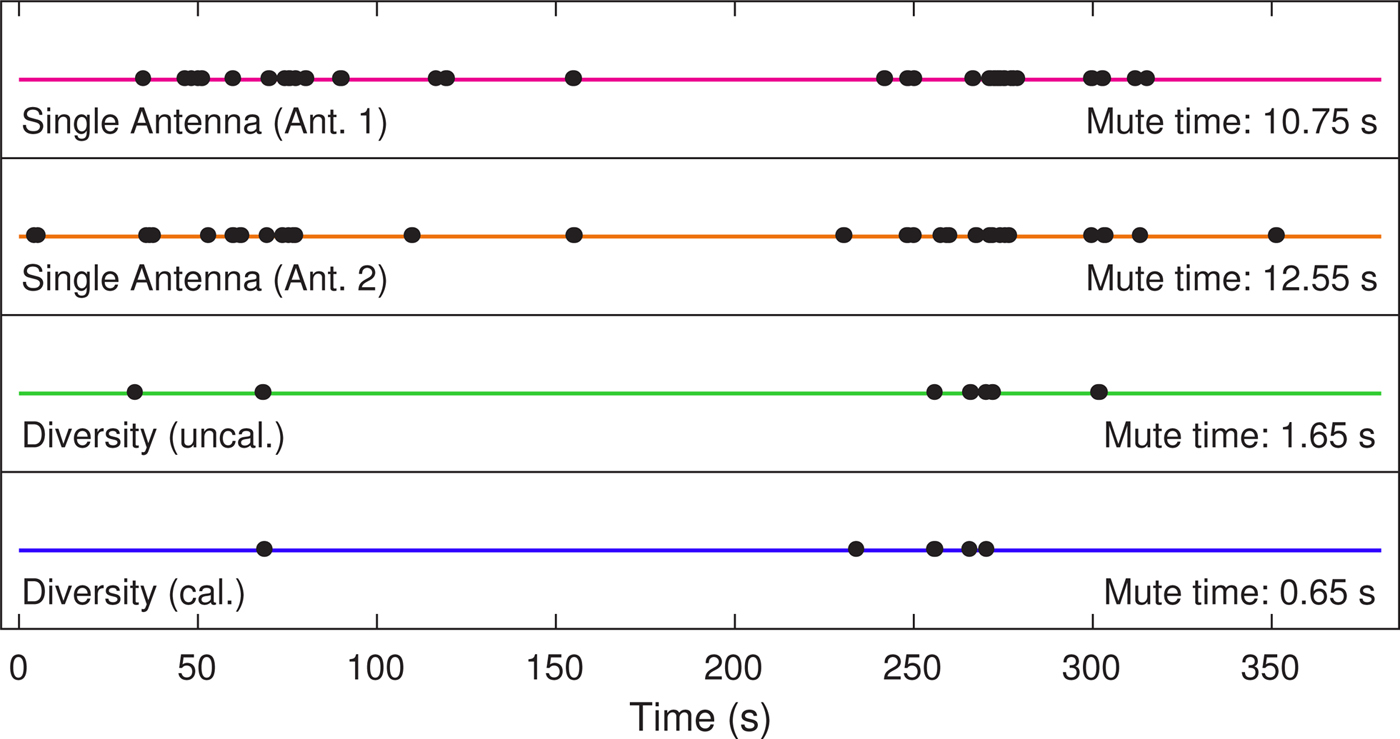
Fig. 16. Measured audio mutes of respective individual measurements of the diversity antenna set's single antennas at one mounting point and scan-phase diversity demonstrator from Fig. 2 with and without noise calibration. All available satellite signals have been used by the receiver.
The single antennas of this diversity set show an average mute duration of 12.0 s using all available satellite signals. The diversity system without noise correction achieves a total average mute duration of 1.71 s which is an improvement by factor 7. Applying our noise correction method the average mute time is reduced to only 0.76 s which is by a factor of 15.8 better than the average of both single antennas.
Conclusion
For antenna diversity of satellite radio systems at 2.33 GHz an analysis of noise influence on the diversity performance and a method for correction of this influence in a diversity algorithm are given. Thereby the diversity performance can be increased by one order of magnitude at low SNR conditions without the need for additional hardware or even with reduced hardware complexity compared to a system without noise correction.
Real scenario test drives underneath dense foliage have been conducted with standard antennas mounted on both front fenders of a test vehicle as well as with a diversity antenna set mounted only on one mounting position on the fender. A statistical analysis shows severe multipath fading in the test track underneath dense foliage for single antenna signals and significant improvements by the diversity system.
All transmitted satellite signals have been evaluated in audio availability measurements by standard single-input off-the-shelf SDARS receivers. In cases of low SNR the diversity system without noise correction reduces audio mutes by a factor of 3.5–7 depending on the antennas used. The presented noise correction leads to a reduction by a factor of approximately 16–40 compared with the average of the single antennas. Using diversity this way, even for a critical mounting position of the antennas, results are equal to those of standard antennas on ideal position on a car's rooftop.
Acknowledgments
The authors would like to thank Fuba Automotive Electronics for their support and cooperation.
 Simon Senega was born in Rosenheim, Germany in 1981. He studied electrical engineering and information technology at the Technische Universität München and graduated in 2007 with his diploma thesis. From 2007 to 2013 he worked on his Ph.D. thesis at the Institute of High Frequency Technology and Mobile Communication at the Universität der Bundeswehr München which he finished successfully in 2013. He is currently working as a postdoctoral research associate in the field of diversity reception techniques for various services at the same institute and is also working on his habilitation treatise.
 Ali Nassar was born in Foz do Iguaçu, Brazil, in 1987. He received the M.Sc. degree in electrical engineering and information technology (major in communication technology) from the Technische Universität München in 2012. In 2013 he joined the Institute of High Frequency Technology and Mobile Communication at the Universität der Bundeswehr München as a research associate. He is currently working on an algorithm for SDARS diversity mobile reception as part of his Ph.D. thesis at the same institute.
 Stefan Lindenmeier was born 1967 in Munich, Germany. After finishing his diploma studies in electrical engineering at the Technical University of Munich in 1994 he worked at the Ferdinand Braun Institute for High Frequency Technology in Berlin as a research engineer. In 1996 he received the Ph.D.-degree at the Technical University of Munich where he was assistant professor until 2000 and received the Venia Legendi in High Frequency Technology. In 2000 he then joined the DaimlerChrysler Research and Technology Centre in Ulm, Germany, where he became leader of the research group for antennas and RF-sensors. Since 2004 he is full professor and leader of the Institute of High Frequency Technology and Mobile Communications at the University of the Bundeswehr in Munich. 2004–2008 he was IEEE-MTT-S chapter coordinator for R8 and IEEE-R8 chapter coordinator for AP, BT and MTT. 2010–2012 he was dean of the Faculty of Electrical Engineering and 2012–2014 he was member of the University Senate. He is member of expert committees e.g. VDE-ITG-FA9.1 for antennas, URSI-commission-B, and Fraunhofer-FHR. His research topics are antenna technology, mobile communication- and reception- systems, microwave systems, radio location and radar technology, electromagnetic field modelling and electromagnetic compatibility, each with special focus on automotive applications. He is author of more than 170 scientific publications in these fields of research.


 Open access