


1. Introduction
Spatial market integration can be understood as the flow and transmission of goods and price information across regions. A majority of agricultural economics scholars believe that spatial market integration is directly related to the law of one price (Barrett, Reference Barrett2001). The market is perfectly integrated when the price difference of a homogeneous commodity between two separated markets will be, at most, equal to the transaction costs of goods and information flowing freely between them (Emmanouilides and Fousekis, Reference Emmanouilides and Fousekis2012). Perfect spatial market integration suggests the realization of the law of one price.
Conversely, complete spatial market segmentation is the condition of self-sufficiency without trade. Spatial market integration is an important measure of market efficiency. Spatial market integration can improve the efficiency of resource allocation, reduce social costs, and maximize social welfare, whereas spatial market segmentation will have negative effects on the healthy development of markets, increase the deadweight loss incurred by society, and reduce overall economic efficiency (Serra, Gil, and Goodwin, Reference Serra, Gil and Goodwin2006).
The study of spatial market integration, therefore, has always been a focus of governments and scholars around the world (Barrett, Reference Barrett1996; Fackler and Goodwin, Reference Fackler, Goodwin, Gardner and Rausser2001). The significant issue is the measurement of agricultural spatial market integration. Another concern is the influence of different markets. With the increasing integration of agricultural markets, some markets play a more important role and exert more influence on agricultural prices in other markets; thus, these markets are “price setters.” Other markets have little market power and are thus referred to as “price followers.” However, questions remain: How does agricultural spatial market integration evolve? Have any notable structural breaks occurred in the process of evolution? The latter two issues are important but scarcely presented in the existing literature. Thus, addressing the abovementioned issues in an integrated framework is the main challenge of this article.
This article has three contributions. Our first contribution is to present an integrated framework for studying agricultural market integration. We not only measure the degree of integration and pricing power of the agricultural market but also analyze the evolution of agricultural market integration. These analyses help us understand the dynamic process of integration rather than the only result that the market is integrated or segmented.
Our second contribution is to introduce the minimal spanning tree (MST) method to estimate agricultural market integration. The MST method can solve the abovementioned issues based on its four characteristics. First, the MST method applies the greedy algorithm to choose only the N − 1 strongest links between N markets, which should have N(N − 1)/2 links. This means that the MST method can reveal the simplest and strongest relationships between different markets. Second, the MST can present a network topology graph of N − 1 links, which visualizes the structure and relationships between markets. Third, the MST method provides some network topological indicators with good economic implications. Market degree and betweenness centrality reflect the market’s centrality and can be used to measure market power, and normalized tree length reflects the closeness degree of all markets and is an indicator of well-measured spatial market integration (Ji and Fan, Reference Ji and Fan2016). Finally, the MST method and its net topological indicators are easily combined with the rolling time window method to address the evolution of agricultural market integration.
Our third contribution is to study the evolution of agricultural spatial market integration as applied to the Chinese hog market. The Chinese hog market is interesting for four reasons. First, China has the largest hog market in the world in terms of production and consumption (USDA, 2018). Second, Chinese hog-producing areas and hog-consuming areas are numerous and dispersed across the country. Third, China first liberalized its hog market in 1985 and even further after joining the World Trade Organization in 2001, which increased hog price volatility. Fourth, China is the only country implementing a pork reserve policy to smooth the volatility of hog market prices, which it implemented in 2009, providing a practical case for investigating the influence of government policy on agricultural market integration.
Our empirical analysis is based on monthly data on Chinese hog prices for 20 hog-consuming and hog-producing areas over the period 2000–2016. We construct MST of 20 hog markets in China by using the Pearson correlation coefficients between price growth rates to calculate the edges of the MST, in which the shortest edges represent the largest Pearson correlation coefficients. Correlation coefficients between different markets are the earliest method used to estimate the integration degree and were proposed by Lele (Reference Lele1967). He argued that correlation between different markets can estimate the degree to which price formation in an individual market is influenced by prices in other markets and therefore can be considered an indicator of the extent to which the two markets are integrated. Therefore, MST based on Pearson correlation coefficients can provide good insights into the integration of hog markets in China.
The remainder of the article is organized as follows: Section 2 provides a brief literature review of hog market integration. Section 3 discusses the data used in our empirical investigation of the Chinese hog market, including sample choice and the statistical analysis of data. Section 4 presents the results of the integration and the pricing power of different hog markets in China. Section 5 provides the evolution of national hog market integration in China. Section 6 reports the empirical results of the robustness test, and Section 7 provides the main conclusions and policy implications.
2. Literature review
Agricultural market integration, especially grain spatial market integration, has been discussed extensively in the economic literature (Abidoye and Labuschagne, Reference Abidoye and Labuschagne2014; Goodwin and Piggott, Reference Goodwin and Piggott2001; Goychuk and Meyers, Reference Goychuk and Meyers2014; Tostão and Brorsen, Reference Tostão and Brorsen2005). Most scholars consider market integration studies based on the price method to be more credible than those based on other methods (Vinuya, Reference Vinuya2007), and thus, price method studies based on the law of one price are the most common type. For hog market integration, most of the literature focuses on spatial market integration in the Europe Union (EU) or the United States and Canada. Earlier studies often use cointegration models (e.g., Engle and Granger, Reference Engle and Granger1987; Johansen and Juselius, Reference Johansen and Juselius1990). For example, Sanjuán and Gil (Reference Sanjuán and Gil2001) used a multivariate cointegration test to assess the pork spatial market integration of seven EU countries, finding indications of a certain degree of integration. Vollrath and Hallahan (Reference Vollrath and Hallahan2006) used a vector autoregression model to test the hog spatial market integration between the United States and Canada, documenting evidence of market integration. Fousekis (Reference Fousekis2007) applied a vector correction model to investigate the integration of pork markets in 14 EU countries and found that pork markets in the EU are far from the idealized market in which prices are uniform.
As argued by Goodwin and Piggott (Reference Goodwin and Piggott2001), cointegration technology neglects the transaction cost, so threshold cointegration models are proposed, which provide a threshold value to represent the transaction cost. Meyer (Reference Meyer2004) used the threshold vector error correction model to test the integration of two major EU pig markets (Germany and Netherlands). Liu (Reference Liu2011) used both symmetric and asymmetric threshold error correction models to analyze the integration between the Finnish pork market and those of Germany and Denmark in the EU and showed that the pork market in Finland has a symmetric cointegration relationship with those in Germany and Denmark. Emmanouilides and Fousekis (Reference Emmanouilides and Fousekis2012) applied the exponential smooth transition autoregressive model to investigate the integration of four major EU pork markets (Germany, Spain, France, and Denmark), finding that they have a nonlinear integration relationship for all market pairs. Although threshold cointegration models are applied because they consider the transaction cost, some scholars argue that threshold cointegration models are still inappropriate because they rely on strong assumptions about constant transaction costs, continuous trade flows, or both (Miljkovic, Reference Miljkovic2009).
As the copula method has increased in popularity, it has been applied to investigate hog market integration. Recent research includes that by Grigoriadis, Emmanouilides, and Fousekis (Reference Grigoriadis, Emmanouilides and Fousekis2016), who applied the mixed R-vine copulas method to analyze the integration degree of seven major pig meat markets in the EU. They found that the markets of Belgium, Germany, and the Netherlands have a higher degree of integration with the others, whereas the Italian market exhibits a lower degree of integration. Although there are some studies on hog market integration, to our knowledge, no published study has analyzed the price influence of individual hog markets. Most scholars focus on the pricing power of the grain market. For example, Jian, Besseler, and Leatham (Reference Jian, Besseler and Leatham2000) confirmed that the United States is the price setter among the United States, Britain, Argentina, and Brazil based on the Granger causality test. Atanu (Reference Atanu2006) applied an error correction model to find that the United States is the pricing center of the world rice market.
All of the previously discussed research provides good references for this article, but the abovementioned methods appear unsuitable for solving the problems proposed in this article. The abovementioned methods are often used to investigate the integration of hog markets when considering a total of between two and seven markets. The reason for this approach is that the cointegration model and threshold cointegration model are applied to analyze spatial market integration mostly based on the pairwise procedure, which means that N markets require us to estimate N(N − 1)/2 models. The higher-dimensional copula method is also based on pair-cupula densities. Moreover, these models have no simple indicator to reflect the integration of all markets, such as normalized tree length as provided by the MST method. The total number of Chinese hog markets studied in this article is 20, so although the cointegration model, threshold cointegration model, and copula method are theoretically applicable, these calculations are difficult and complicated to perform from an actual operational perspective.
In contrast, the MST method is a much more suitable model for solving the issues in this article. One recent application of the MST method to market integration is that given by Ji and Fan (Reference Ji and Fan2016), who analyze the evolution of crude oil market integration in 24 countries. Unlike their study, which used Prim’s algorithm, we construct MST by using Kruskal’s algorithm. Kruskal’s algorithm always finds the shortest edge (largest correlation coefficient) to add into the graph regardless of whether it can temporarily connect with other edges, but Prim’s algorithm always chooses the next nearest vertex (market) to ensure that every edge added in the graph is connected. Because the shorter the edge is, the better integrated the markets on the ends of that edge are, Kruskal’s algorithm is much more suitable for use to study market integration. Therefore, our article appears to be the first to use the MST method based on Kruskal’s algorithm to analyze agricultural market integration. Its application to the Chinese hog market is also novel.
3. Data description
3.1. Sample selection
Nominal monthly hog price data (unit: yuan per kilometer) for 20 provinces/municipalities/autonomous regions over the period 2000 M1 to 2016 M6 (198 observations) were obtained from the Chinese Animal Husbandry Information Network (http://www.caaa.cn). The selected samples include 20 hog markets, each divided into a hog-consuming area and hog-producing area, which are distributed in six regions as follows: eastern China, southern China, central China, southwestern China, northern China, and northeastern China.
Hog-producing and hog-consuming areas are determined according to a comparison of per capita pork consumption and per capita pork production. Specifically, Heilongjiang, Jilin, Liaoning, Anhui, Shandong, Hebei, Henan, Sichuan, Jiangxi, Hubei, Hunan, and Guangxi are selected as hog-producing areas in which per capita pork production is higher than per capita pork consumption. These hog markets almost cover the top 10 major hog production regions in China. By contrast, Beijing, Tianjin, Shanghai, Jiangsu, Zhejiang, Fujian, and Guangdong are selected as hog-consuming areas in which per capita pork production is lower than per capita pork consumption. Figure 1 shows the distribution of 20 provinces/municipalities/autonomous regions in China in which the different regions are color coded. From Figure 1, we can see that hog-producing areas and hog-consuming areas have geographic agglomeration effects. The hog-consuming areas are mainly distributed in eastern coastal regions, which demand a large amount of pork because of their high population density and rapid economic development. The hog-producing areas are mainly distributed in inland regions that are suitable for feeding hogs because of built-in advantages, such as geographic environment, high production of grain, low wage cost, and government policy support.
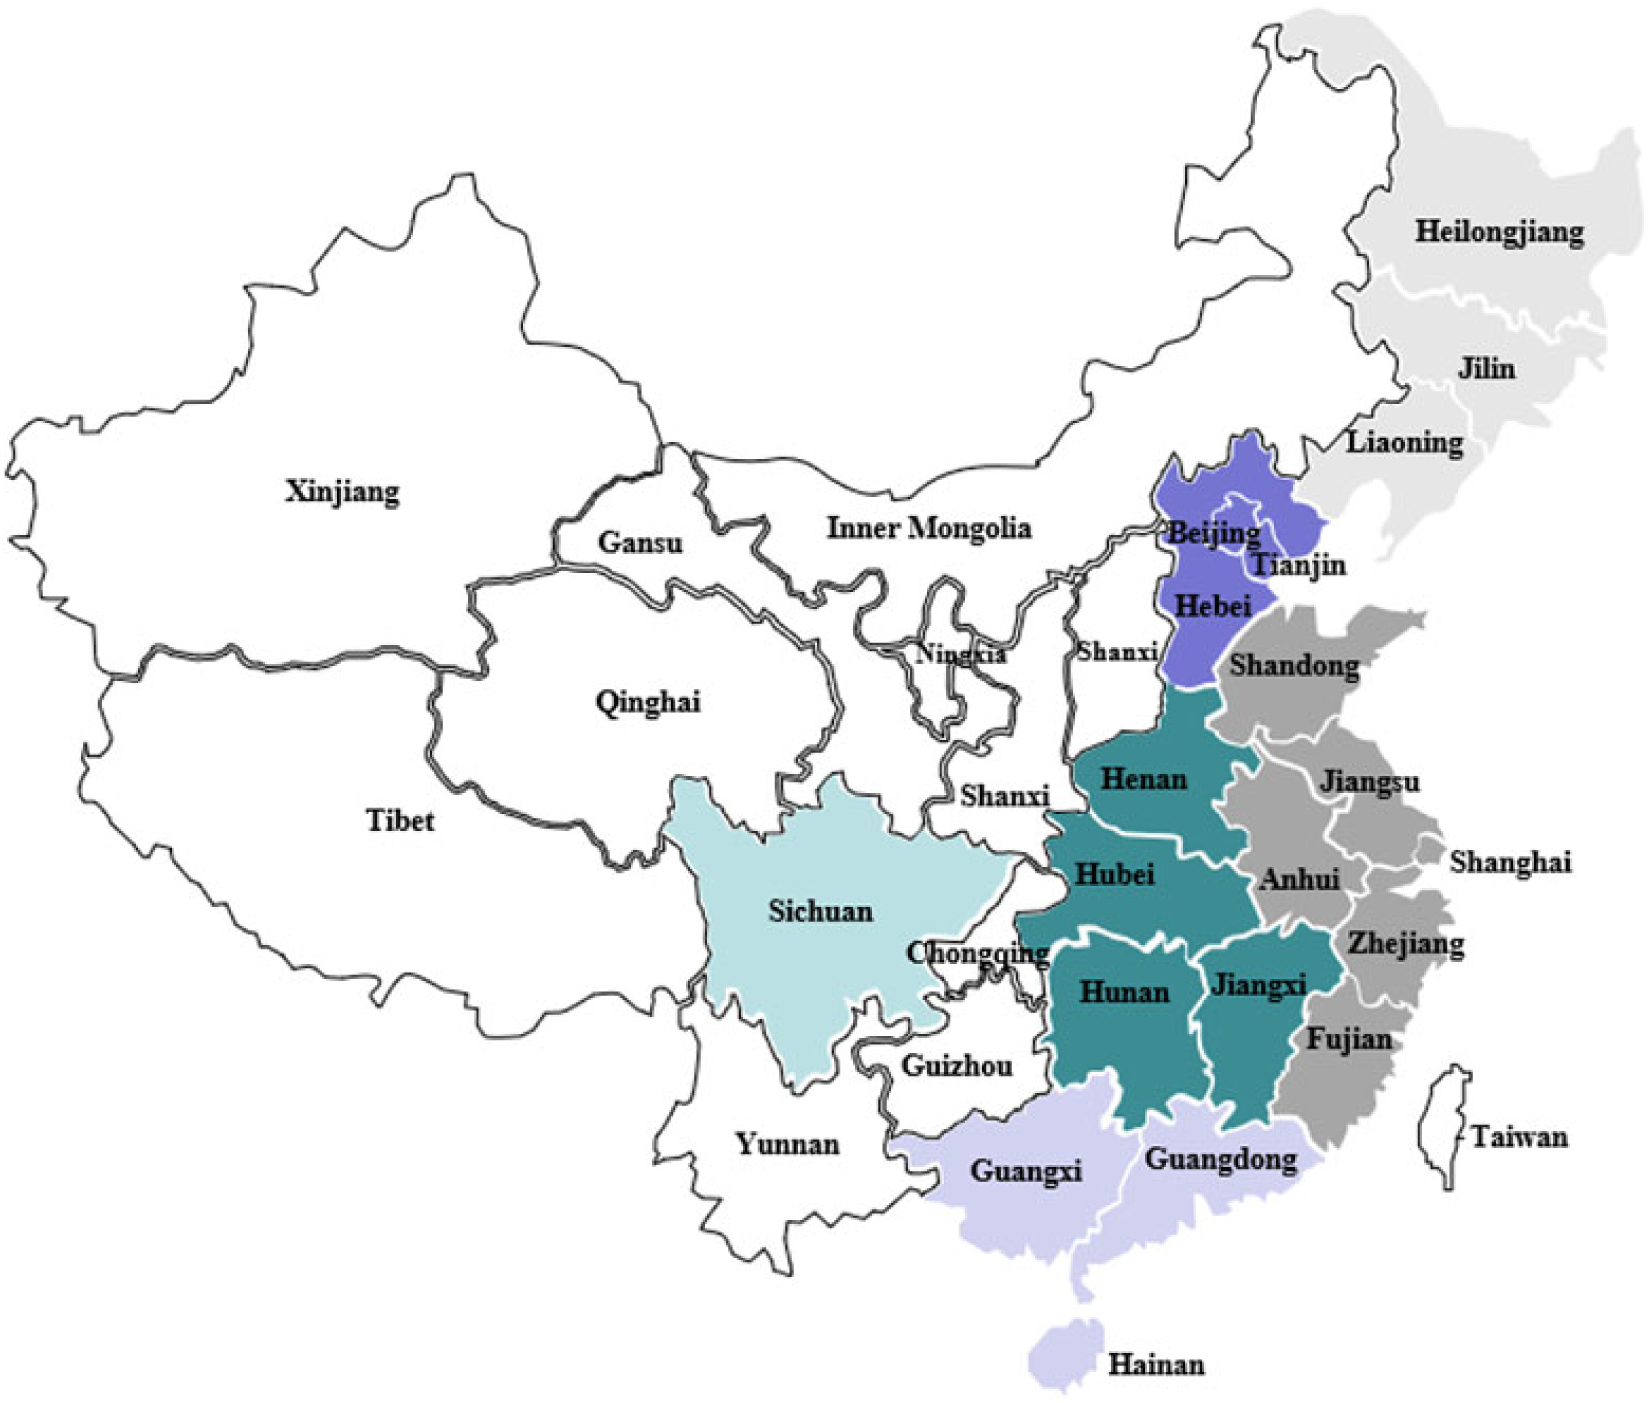
Figure 1. The distribution of 20 provinces/municipalities/autonomous regions in China. Note: Regions are color-coded as follows: eastern China, dark gray; southern China, light purple; central China, dark blue; southwestern China, light blue; northern China, dark purple; and northeastern China, light gray.
3.2. Unit root test and statistical analysis
To ensure the comparability of hog prices in different markets, a monthly consumer price index is used to remove the price influence of nominal hog prices and obtain real hog prices. Then, the augmented Dickey-Fuller (ADF) test proposed by Dickey and Fuller (Reference Dickey and Fuller1979) is used to examine whether real hog prices have unit roots. The unit root test results on real hog prices for 20 provinces/municipalities/autonomous regions are presented in Table 1. The results show that the real hog prices are nonstationary in levels but stationary in first differences at the 5% significance level. This confirms that all real hog prices have unit roots, so we will use the real hog price growth rates (ri,t ) to perform the following empirical analysis because of their stationary character.
 $${r_{i,t}} = \ln ({P_{i,t}}) - \ln ({P_{i,t - 1}}),$$
(1)
$${r_{i,t}} = \ln ({P_{i,t}}) - \ln ({P_{i,t - 1}}),$$
(1)
where Pi,t is the price of hog market i at time t.
Table 1. Augmented Dickey-Fuller (ADF) unit root test of real hog prices for 20 provinces/municipalities/autonomous regions

Table 2 provides the descriptive statistics of ri,t for 20 provinces/municipalities/autonomous regions. The analysis results are as follows.
Table 2. Descriptive statistics of real hog price growth rates in 20 provinces/municipalities/autonomous regions

Note: The value in parentheses is the t-statistics value corresponding to the null hypothesis: meani = 0 (i = 1, ⋯ 20).
First, from the mean value, we can see that the means of ri,t in 20 provinces/municipalities/autonomous regions are almost equal to zero, so we conduct the hypothesis test H0: meani = 0, where meani is the mean value of ri,t in hog market i (i = 1,⋯20). The results show that the null hypothesis is true at the 5% significance level for all hog prices, which means that hog prices alternate between increases and decreases. These results are evidence of the hog cycle in China.
Second, unlike the mean value, the volatilities of real hog price growth rates for the 20 provinces/municipalities/autonomous regions are quite different. According to the standard deviation, we can see that the volatility of ri,t in Tianjin is highest, with a higher maximum value and the lowest minimum value. From a regional perspective, the average volatilities of ri,t are highest in northeastern China and lowest in southern China, two areas located on opposite sides of China.
Finally, the Jarque-Bera (JB) test indicates that the real hog price growth rates in different markets do not follow the same distribution. Specifically, 10 hog price growth rates of 20 provinces/municipalities/autonomous regions follow a normal distribution at a 5% significance level. For the rest, 7 hog price growth rates present a right-skewed distribution with a positive skewness value, which has more samples on the left of the mean hog price than a normal distribution, and 3 hog price growth rates present a left-skewed distribution with a negative skewness value. Moreover, the kurtosis values are greater than 3, which is the value of a normal distribution, showing an obvious peak and a fat tail distribution.
4. Integration of regional markets and price influence analysis
In this section, we use Kruskal’s algorithm (Kruskal, Reference Kruskal1956) based on a Euclidean distance matrix to construct an MST. The distance matrix is defined as
 $${d_{ij}} = \sqrt {2(1 - {\rho _{ij}})} ,$$
(2)
$${d_{ij}} = \sqrt {2(1 - {\rho _{ij}})} ,$$
(2)
where ρij is the Pearson correlation coefficient of the price growth rates of hog markets i and j, and dij is the distance between market i and market j. Generally, dij = 0 if the price time series from the i and j markets are perfectly correlated, and dij = 1 if the price time series from the i and j markets are perfectly uncorrelated, indicating that smaller values of dij imply higher correlations and stronger compactness between hog markets.
Then, the distance matrix is used as edges to construct the MST (see Figure 2) in which the different regions are symbol coded. As shown in Figure 2, hog markets in all regions except central China are linked, showing the highly integrated intraregional hog market. In particular, the hog markets from southern China, in which Guangxi and Hainan are directly connected to Guangdong, are the most integrated. This finding indicates that the hog market in Guangdong plays an important role in southern China. With respect to the integration of interregional hog markets, the hog markets in northeastern China are linked to those in northern China, and the hog markets in southwestern China are linked to those in northern China. In addition, the hog markets in northern China, southern China, and central China are each connected to those in eastern China. This situation suggests that interregional hog markets are relatively highly integrated. These results show that national hog spatial market integration has been verified and that the national hog market shows a high geographic agglomeration effect, which means that geographic distance is an important factor determining hog market integration.
Figure 2. Minimal spanning tree for the full sample. Note: Symbols of the provinces are coded in terms of districts as follows: eastern China (#), southern China (☆), central China (*), southwestern China (○), northern China (◊), northeastern China (△).
Furthermore, most hog markets in eastern China are located in the center of the MST, which suggests that this may be an important pricing region for the national hog market. The hog markets from eastern China are all congregated around Shandong except for Fujian and Shanghai, which are linked to Hunan. This finding further suggests that the hog market in Shandong may have an important influence on the national hog market.
To further verify the pricing power of hog markets in China, we use two network topology indicators—namely, market degree and betweenness centrality—to more accurately reveal the importance of each hog market (see Table 3). The specifications of market degree and betweenness centrality are referred to by Ji and Fan (Reference Ji and Fan2016). According to the market degree indicator, defined as the number of links connected to any given market, the hog markets in Shandong and Hunan have the highest degree of 4, followed by the four hog markets in Guangdong, Zhejiang, Hebei, and Jilin, which have a market degree of 3. In addition, betweenness centrality can be used to find markets that serve as a bridge from one part of the graph to another, which is considered an important and useful measure of the market’s centrality in the MST (Sieczka and Holyst, Reference Sieczka and Holyst2009). Shandong has the largest betweenness centrality, while Zhejiang and Guangdong rank second and third, respectively. Based on the previous analysis, the hog market in Shandong plays an important role in the national hog market and can be called the price setter, and the hog markets in eastern China can be regarded as a pricing region, with the strongest market power in the national hog market. Thus, the hog markets in eastern China, especially in Shandong, set the general trend for the national hog price.
Table 3. Measurement results of network topology indicators

Sichuan, the largest hog producer with the most breeding farms (households), only has a degree of 1 and betweenness centrality of 0, which places Sichuan at the fringe of the MST. This finding suggests that the hog market in Sichuan has weak pricing power, which means that it is a price follower, whereas Shandong, only the fourth largest hog producer, is the price setter. The reasons for this situation are that the influence of a hog market may depend on not only hog production and the number of breeding farms (households) but also the large-scale hog-breeding level, geographic location, per capita income, and many other factors.
First, the large-scale hog-breeding level in Sichuan is far lower than that in Shandong. According to data from the China Animal Husbandry and Veterinary Yearbook 2015 (Editorial Committee of China Animal Husbandry and Veterinary Yearbook, 2016), although the number of hog-breeding farms (households) and the scale of pork production in Sichuan are the largest in China, accounting for 15.49% and 9.30% of the total, respectively, large-scale farms (households) owning more than 500 hogs account for only 0.22% of the total in Sichuan Province. The large-scale hog-breeding level of Sichuan is the lowest in the 20 provincial hog markets. In contrast, the number of hog-breeding farms (households) in Shandong is approximately 1/7 of that in Sichuan, but 11,688 large-scale hog-breeding farms (households) in Shandong own more than 500 hogs in Shandong, which is many more than in Sichuan; therefore, the large-scale hog-breeding level in Shandong is approximately 70% higher than that in Sichuan. Because a higher large-scale hog-breeding level of the hog market means stronger market power, Shandong has greater market power than Sichuan.
Furthermore, Shandong’s geographic advantage is considerably greater than that of Sichuan. Although Sichuan is adjacent to seven provinces/municipalities/autonomous regions, these are mainly located in northwestern and southwestern China. These regions, in which the per capita income level is lower, belong to neither the major hog-consuming nor the major hog-producing areas; therefore, it is impossible for these regions to demand a large amount of pork. In contrast, Shandong is located in eastern China, which is the most economically developed area, and the provinces/municipalities adjacent to Shandong belong to either a major hog-producing area or a major hog-consuming area. The higher per capita income level and the better geographic location trigger a greater domestic hog trade and circulation; as a result, Shandong attracts more attention from the other regions than Sichuan. These potential factors place Shandong at the center of the MST.
5. The evolution of national hog market integration
Because of the influences of farming practices, policies, environmental conditions, and many other factors, the integration of the national hog market and the market power of hog markets in different provinces/municipalities/autonomous regions can change over time. Because the Pearson correlation coefficient is the foundation of constructing an MST, we apply the time-varying characteristics of the Pearson correlation coefficients by using the rolling time window method to reflect the dynamic evolution of the hog market. It is worth mentioning that the Pearson correlation coefficient captures the linear comovement of hog prices, so the Kendall rank correlation coefficient considering both linear and nonlinear relationships could be a theoretically superior measure for constructing an MST to study the market integration (e.g., Fousekis and Grigoriadis, Reference Fousekis and Grigoriadisin press). However, because of the similar trends of hog prices in different provinces/municipalities/autonomous regions of China (Pan and Li, Reference Pan and Li2015; Wu, Reference Wu1999), using the Pearson correlation coefficient to study hog market integration in China is still a valuable attempt. Here, mean(t), var(t), ske(t), and kur(t) are defined as the varying mean, variance, skewness, and kurtosis of the correlation coefficients:
 $$ mean\left( t \right) = {2 \over {N(N - 1)}} \sum\nolimits_{(i,j)} \rho _{ij}^{{T_1}}(t),$$
(3)
$$ mean\left( t \right) = {2 \over {N(N - 1)}} \sum\nolimits_{(i,j)} \rho _{ij}^{{T_1}}(t),$$
(3)
 $$var\left( t \right) = {2 \over {N(N - 1)}}\sum\nolimits_{(i,j)} {{{\left[ {\rho _{ij}^{{T_1}}\left( t \right) - \overline {{\rho ^{{T_1}}}\left( t \right)} } \right]}^2}} ,$$
(4)
$$var\left( t \right) = {2 \over {N(N - 1)}}\sum\nolimits_{(i,j)} {{{\left[ {\rho _{ij}^{{T_1}}\left( t \right) - \overline {{\rho ^{{T_1}}}\left( t \right)} } \right]}^2}} ,$$
(4)
 $$ske\left( t \right) = {2 \over {N(N - 1)}}\sum\nolimits_{(i,j)} {{{\left[\rho _{ij}^{{T_1}}\left( t \right) - \overline {{\rho ^{{T_1}}}\left( t \right)} \right]}^3}/va{r^{3/2}}(t)} ,$$
(5)
$$ske\left( t \right) = {2 \over {N(N - 1)}}\sum\nolimits_{(i,j)} {{{\left[\rho _{ij}^{{T_1}}\left( t \right) - \overline {{\rho ^{{T_1}}}\left( t \right)} \right]}^3}/va{r^{3/2}}(t)} ,$$
(5)
 $$kur\left( t \right) = {2 \over {N(N - 1)}}\sum\nolimits_{(i,j)} {{{\left[ {\rho _{ij}^{{T_1}}\left( t \right) - \overline {{\rho ^{{T_1}}}\left( t \right)} } \right]}^4}/va{r^2}(t)} ,$$
(6)
$$kur\left( t \right) = {2 \over {N(N - 1)}}\sum\nolimits_{(i,j)} {{{\left[ {\rho _{ij}^{{T_1}}\left( t \right) - \overline {{\rho ^{{T_1}}}\left( t \right)} } \right]}^4}/va{r^2}(t)} ,$$
(6)
where $\rho _{ij}^{{T_1}}\left( t \right)$
is the Pearson correlation coefficient between markets i and j in a time window [t, t + T
1] and T
1 is the window width. Here, we set T
1=24 months and window step length = 1 month.
$\rho _{ij}^{{T_1}}\left( t \right)$
is the Pearson correlation coefficient between markets i and j in a time window [t, t + T
1] and T
1 is the window width. Here, we set T
1=24 months and window step length = 1 month.
Figure 3 presents the time-varying mean, variance, skewness, and kurtosis of the Pearson correlation coefficients. As shown in Figure 3, the integration of the national hog market has increased since 2000; after 2012, it remains steady at a relatively high level of approximately 0.9. The variance in the correlation coefficient continues to decline, and after 2012, it reaches a very low level, close to zero. The correlation between the mean and variance is significantly negative, at 0.9789. Similarly, the correlation between skewness and kurtosis presents a negative relationship with a correlation coefficient of 0.2818. A higher mean and lower variance indicate that the national hog market is becoming more strongly integrated and that the links between the hog markets in provinces/municipalities/autonomous regions are becoming more stable. The results suggest that the national hog market is seeing strong improvements in efficiency. Thus, hog market liberalization reform has had remarkable effects in China. In addition, although the Chinese government initiated a pork reserve policy with the purpose of stabilizing hog market price volatility in 2009, the policy seems to have a slight negative influence on hog market integration. This can be explained by the extremely low proportion of pork reserved by the Chinese government within total pork production, given that China has the highest pork production in the world and the difficulty of pork preservation.
Figure 3. Time-varying mean, variance, skewness, and kurtosis of the correlation coefficients.
Another method to reveal the evolution of the national hog market is the dynamic measure of the normalized tree length, which is defined as
 $$L\left( t \right) = {1 \over {N - 1}}\sum\nolimits_{{e_{ij}} \in MST} {{e_{ij}}} ,$$
(7)
$$L\left( t \right) = {1 \over {N - 1}}\sum\nolimits_{{e_{ij}} \in MST} {{e_{ij}}} ,$$
(7)
where L(t) is the normalized tree length, N − 1 is the number of edges in the MST, and eij is the edge in the MST. Generally, the greater the decrease in the normalized tree length, the more integrated the national hog market is. Figure 4 shows that the normalized tree length decreases gradually. This finding indicates that the correlation between markets is more stable. Thus, different dynamic measures reach a uniform conclusion suggesting that as integration of the national hog market strengthens, the distances between the hog markets shortens, and the relationship between the hog markets grows increasingly close.

Figure 4. Normalized tree length of the time-varying minimal spanning tree.
We next test whether there are structural breaks in the evolution of national hog market integration. The unit root test results (see Table 4) of the normalized tree length show that L(t) has a unit root, so we use the unit root test with structural breaks (Clemente, Montañés, and Reyes, Reference Clemente, Montañés and Reyes1998) to explore the structural breaks in the normalized tree length. The empirical results reveal that the normalized tree length had a significant structural break in April 2007. To ensure the robustness of the empirical results, the article applies the same method to test the structural breaks of the time-varying mean and variance of the correlation coefficients, and these tests produce uniform conclusions. Therefore, we divide the sample into two periods: period 1, 2000.1–2007.3; and period 2, 2007.4–2016.6.
Table 4. The augmented Dickey-Fuller (ADF) unit root test of normalized tree length

To illustrate the change in the correlation structure of the hog markets in the two periods, we give the MSTs and two market power indicators for each period. As shown in Figure 5, in the first period, the degree of integration in the national hog spatial market is lower, and the relationship between hog markets is unclear. According to the betweenness centrality in period 1 (see Table 5), the only consistent result is that the hog market in eastern China occupies the most important position in the national hog market because the provinces with the two top values for betweenness centrality are Jiangsu and Shandong, located in eastern China. Sichuan ranks third, which means that Sichuan had certain pricing power before 2007 but subsequently gradually lost that market power.

Figure 5. Minimal spanning tree for period 1. Note: Symbols of the provinces are coded in terms of districts as follows: eastern China (#), southern China (☆), central China (*), southwestern China (○), northern China (◊), northeastern China (△).
Table 5. Measurement results of hog spatial market integration in different periods

As shown in the MST for the second period in Figure 6, the MST from top to bottom shows a geographic distribution from the south to the north of China with a strong geographic agglomeration effect (see Figure 1). With respect to intraregional hog market integration, Guangxi and Hainan are linked to Guangdong in southern China, and Liaoning and Heilongjiang are linked to Jilin in northeastern China. In addition, all the hog markets except one are linked together in other regions. This condition suggests that intraregional hog spatial market integration is extremely high, especially among the hog markets in northeastern and southern China. With respect to interregional hog market integration, the hog markets in southern China and southwestern China are linked with those in central China, and the hog markets in northeastern China and northern China are each connected to those in central China, which are in turn linked to those in eastern China. Therefore, the integration of the national hog market strengthened greatly during the second period.
Figure 6. Minimal spanning tree for period 2. Note: Symbols of the provinces are coded in terms of districts as follows: eastern China (#), southern China (☆), central China (*), southwestern China (○), northern China (◊), northeastern China (△).
As shown in Table 5, the top five measurements of betweenness centrality in the second period are recorded for Jiangsu, Hunan, Shandong, Anhui, and Henan, which are mostly located in eastern China; therefore, the hog markets in eastern China play an important role in the national hog market. Specifically, the market power of the hog market in Jiangsu has weakened, whereas the market power of the hog markets in Shandong and Anhui has strengthened since the structural break. Therefore, the hog markets in eastern China have consistently been the most influential markets, especially the hog market in Shandong, which plays an important role in the national hog market. Thus, the hog markets in eastern China, especially in Shandong, can reflect changes in the national hog price. Similarly, Liu et al. (Reference Liu, Mao, Ma, Wang, Han, Li and Xia2016) showed that the hog production and consumption of the eastern coastal region have a significant influence on the spatial distribution pattern of national hog prices, supporting our result that the hog markets in eastern China are the pricing center of the national hog market.
In addition, the influence of hog markets in Hunan and Henan has increased significantly, which can be further verified by the locations of Hunan and Henan in Figure 6. As shown, the hog market in Henan is a bridge connecting hog markets in northeastern China and northern China with hog markets in eastern China; meanwhile, the hog markets in southern China and southwestern China are linked to those in eastern China through the hog market in Hunan. As a result, the hog markets in Hunan and Henan also occupy an important strategic position in the national hog market because Hunan and Henan are the main domestic hog producers and exporters in the southern and northern regions, respectively.
Therefore, the market power of hog markets in eastern and central China has increased significantly compared with that in the first period. These hog markets play an important role in the national hog market, as evidenced by the fact that the hog markets in eastern and central China are in the center of the MST and have the highest betweenness centrality. In contrast, the hog markets in southern China, northern China, and northeastern China are on the fringe of the MST, which suggests that the hog markets in these regions have weak market price influence.
6. Robustness of the market relationships
This section examines the robustness of the market relationships over time using the frequency of the links. We calculate the frequency of the links in a full sample and subsample MST for those links also appearing in the time-varying MSTs. In Section 5, a moving window is specified with a width of 24 months, and 174 MSTs over time are computed because of the total sample size of 197.
To test the robustness of the links in the full-sample MST, we count the number of times each link appears in the 174 MSTs. Generally, the 20 markets have 189 possible links in the market. According to our statistics, only 1 link (Shandong-Fujian) does not appear in the moving MSTs, whereas 188 links do appear in the 174 MSTs with different frequencies. Specifically, the highest frequency (31%) link is Hebei-Henan, whereas the lowest frequency (1%) link is Shandong-Fujian. The mean frequency of all links is approximately 10%, and the frequency of only 70 links is higher than the mean frequency. In 70 links, a frequency of only 1 link is above 30%, a frequency of 10 links is between 20% and 30%, a frequency of 20 links is between 15% and 20%, and a frequency of 39 links is between 10% and 15%. These results show that the links among the 20 hog markets are unstable and complex. Thus, it is even more difficult and important to find the key links among the hog markets.
Figure 7 presents the frequency of the links in descending order, and the results imply that the relationships between different hog markets are not constant because of changes in technology, policy, the economic environment, and other factors. The frequency of only 5 links is lower than the mean frequency, whereas the others are higher than the mean frequency. The top 6 of the 189 links in terms of frequency are Hebei-Henan, Sichuan-Hunan, Hainan-Guangdong, Heilongjiang-Jilin, Guangxi-Guangdong, and Jilin-Tianjin. These results show that the links of the 20 hog markets are robust. Specifically, the links among 3 hog markets in southern China, the link between northeastern China and northern China, the link between southwestern China and central China, the link between northern China and eastern China, and the link between southern China and eastern China are relatively robust, whereas the links between northern China and eastern China are unstable.
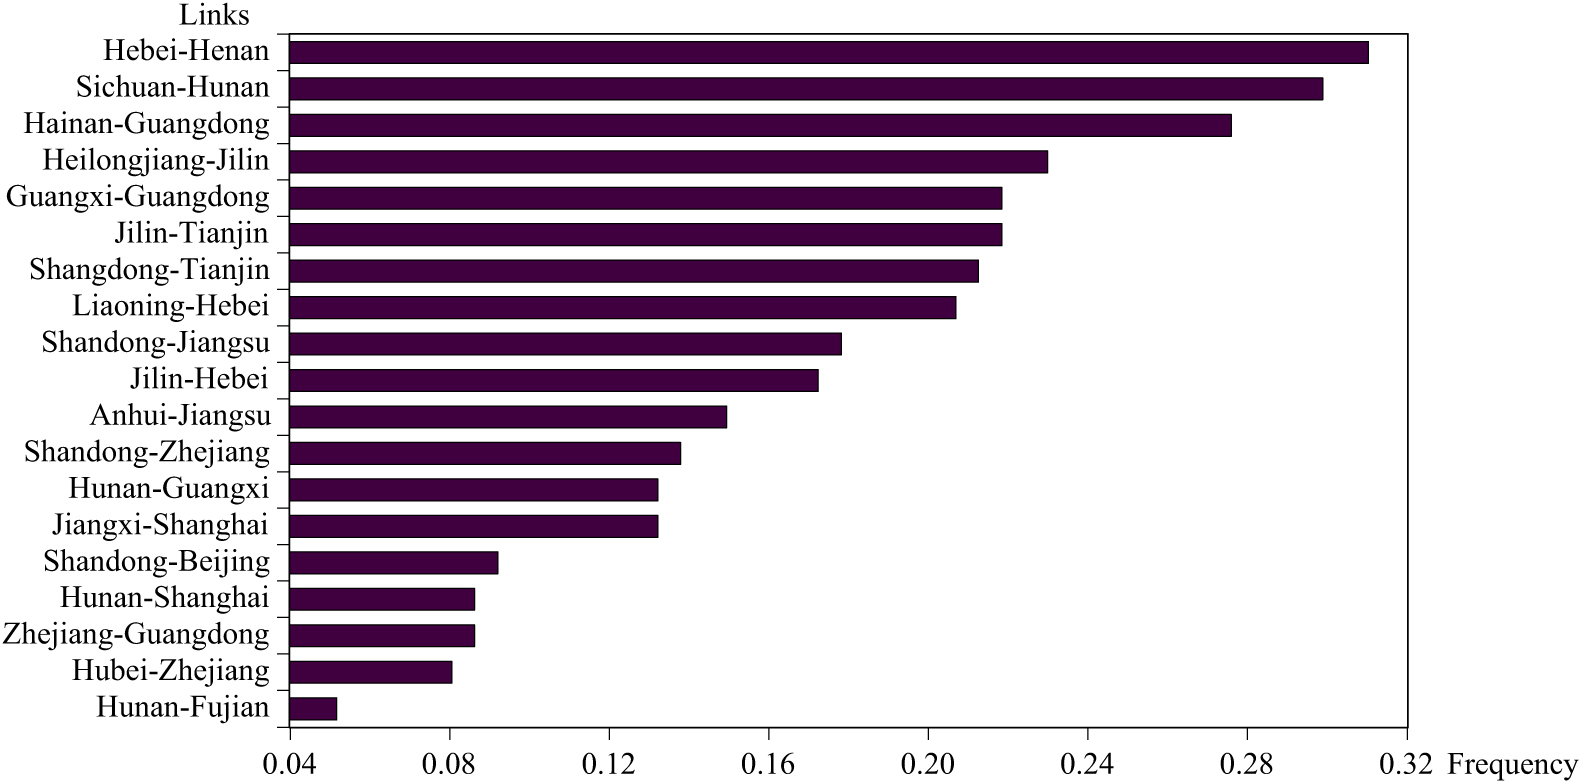
Figure 7. Frequency of the links in the full-sample minimal spanning tree.
Figure 8 shows the frequency of the links in the second-period MST for those links appearing in the time-varying MSTs. As shown in Figure 8, the links between the hog markets have become more stable than those in the first period. The relationship robustness of the hog markets is higher in the second period, as evidenced by the fact that the frequency of 19 links is higher than the mean frequency (10%).

Figure 8. Frequency of the links in the second-period minimal spanning tree.
7. Conclusions and implications
This study provides a new perspective that can be used to identify national hog market integration. After constructing the MST, we analyze the relationships between different hog markets, which hog markets behave as price setters and which simply follow others, how the national hog spatial market integration evolves over time, whether there are any structural breaks in the integration process of the national hog market, and whether the empirical results are robust. Consequently, new conclusions have been drawn.
First, the integration of the national hog market has strengthened gradually, reaching a high stable level. This change indicates that hog market liberalization reform has had significant effects on increasing market efficiency and that the pork reserve policy has had a slight negative influence on hog market integration.
Second, geographic distance is a primary factor affecting hog market integration. The correlation structure of the hog markets shows strong geographic agglomeration effects. Specifically, the hog markets in all regions (except central China), and especially in southern China, are closely linked. Moreover, the hog markets in northeastern China and northern China, the hog markets in southwestern and central China, and the hog markets in northern/southern/central China and eastern China are linked together.
Third, because of the influence of the external environment, particularly factors such as technology, the economy, and policy, national hog spatial market integration in China experienced a structural break point in April 2007. Before April 2007, the intraregional and interregional hog spatial market integration was weak, with a low degree of national hog market integration, whereas after that date, national hog spatial market integration significantly increased, showing a strong geographic agglomeration effect, as evidenced by the fact that the MST from top to bottom shows the geographic distribution from the south to the north of China.
Fourth, the results based on both all-sample data and subsample data analysis show that the hog markets in eastern China, especially in Shandong, are the pricing center of the national hog market. This result is relatively robust. The comparisons are analyzed before and after the structural changes of the national spatial market integration in China, revealing that the market price influence power of the hog markets Hunan and Henan in the central region has improved since 2007, and Hunan and Henan have become the key provinces linking the other regions to eastern China. The hog market in Sichuan, which is China’s largest hog producer, had a certain pricing power before 2007 but then lost this market power gradually and was ultimately located at the fringe of the MST; this means that Sichuan is a price follower because the pricing power of hog markets in China depends on not only the number of breeding farms (households) and hog inventory but also the large-scale breeding level, geographic location, per capita income, and many other factors.
Fifth, robust test results show that the links between different hog markets given by the all-sample MST are relatively stable. Among them, the links between three hog markets in southern China are the most stable, and the links between the regional hog markets, except for the link between central China and eastern China, are also stable. Compared with the results based on an all-sample data analysis, the links given by the second-period MST are much more robust. This finding suggests that relationships between the hog markets become more stable as the integration of the national hog market becomes stronger.
Based on these conclusions, the policy suggestions are given as follows:
1. The government should monitor and publish the key information influencing the national hog price in eastern China (especially in Shandong), Hunan, and Henan, such as hog inventory, inventory of farrowing sows, and the number of piglets. These data can help breeding farms (households) understand and anticipate the present and future trends in national hog prices. Meanwhile, the price changes in those hog markets closely linked by the MST should be understood by the breeding farms (households) so that they can determine a reasonable breeding scale and thereby reduce their market risk given the expected hog price changes.
2. The first choice of an area to implement a price regulation policy, such as a pork reserve policy, should be eastern China, and Shandong can be taken as a priority. In this way, the policy’s effect will be transmitted from eastern China to the other regions, and the costs of the policy can be reduced by avoiding the implementation of the same policy repeatedly in different regions.
3. The highly integrated national hog market shows that the price comovement of hog markets in different provinces/municipalities/autonomous regions has been enhanced, suggesting that systemic risk in the national hog market has increased significantly. Therefore, cooperation among provincial governments should be strengthened by promoting domestic hog circulation and combining policy regulations and market mechanisms to prevent the excessive volatility of hog prices. These measures can guarantee the income of breeding households and promote the healthy and sustainable development of the hog industry.
The analysis in this article focuses on the Chinese hog market and can be extended in several directions. First, we build the MST based on the Pearson correlation coefficient reflecting only the linear relationships of the hog prices, so building the MST based on other general measures that can capture not only linear but also nonlinear comovement, such as Spearman or Kendall rank correlation coefficients, will be an interesting topic for future study. Second, our empirical findings are specific to the Chinese hog market. It would be practicable to apply the research method to other agricultural markets or other countries. Third, the feasibility of applying the cointegration model, threshold cointegration model, and copulas method to analyze the integration of numerous markets remains to be examined with the development of computer and econometric techniques.
Author ORCIDs
Fanghui Pan 0000-0001-8104-1549
Financial support
Support was provided by the National Natural Science Foundation of China (Grant No.71503036), University Nursing Program for Young Scholars with Creative Talents in Heilongjiang Province (Grant No. UNPYSCT-2017030), and the China Postdoctoral Science Foundation (Grant No.2013M540267).


 Open access