


1. Introduction
Low adoption of the food safety measures, inadequate storage and mishandling of food products post-harvest, and use of unsafe food additives and chemicals are major food safety issues in developing countries (Grace, Reference Grace2015; Kader and Rolle, Reference Kader and Rolle2004; Kumar et al., Reference Kumar, Thapa, Roy and Joshi2017; Thapa et al., Reference Thapa, Kumar, Roy and Joshi2019). Due to a lack of basic food safety knowledge, population in low- and middle-income countries tends to exhibit low demand for food safety even though they are the most affected by unsafe food, as access to both preventive and curative health care is constrained. According to the World Bank in 2018, food-borne illnesses cost about $110 billion/year in low- and middle-income countries (Jaffee et al., Reference Jaffee, Henson, Unnevehr, Grace and Cassou2018). Food safety outcomes depend on the behavior and actions of different stakeholders, including farmers, food handlers and distributors, food manufacturers, and food service operators. They also depend on the consumer awareness and practices. Consumers’ demand for food safety in turn depends on their food safety consciousness (FSC).
FSC is particularly important in the context of countries with scarce regulatory capital. This is because only when consumers are aware can they create a demand pull for the delivery of food safety. The importance of assessing the demand for food safety and its determinants cannot be overstated. Yet, to the best of our knowledge, studies do not exist that examine the effects of FSC on purchasing behavior of consumers. Using the unique data collected from dairy consuming households from Nepal, we assess how FSC affects households’ choice for purchasing safer milk products; that is, how it induces demand for food safety.
The contribution of the study lies in the originality of data and the empirical results. In a poor country like Nepal, access to safe food can be comparatively important, as the poor have low access to both preventive and curative health care. Understanding consumers’ awareness toward food safety and their practices concerning food preparation has become a subject of great interest to food producers, retailers, politicians, and health promoters (Wilcock et al., Reference Wilcock, Pun, Khanona and Aung2004). Notwithstanding the importance, the literature on the demand side of food safety in countries like Nepal is almost nonexistent. The primary data collected on consumer knowledge, attitudes, and practices are novel and contribute to filling in the research gap in the literature.
Nepal presents an ideal case to study the link between consumer awareness and demand for food safety. About 70% of milk in Nepal is sold through informal market channels (NDDB, 2012). Milk transacted through these channels is neither pasteurized nor labeled, and usually does not follow most of the good agricultural practices (GAP). In the small segment of branded dairy products, both pasteurization and labeling exist. Without pasteurization and adoption of GAP, the milk from the informal sector tends to be prone to adulterants such as water, benzoic and salicylic acid, detergents, urea, formalin, sugar, carbonates, and ammonium sulfate, partly due to pricing by fat content at the first point of sale (NDDB, 2016; Thapa et al., Reference Thapa, Kumar, Roy and Joshi2019).
In 2011, the Department of Food Technology and Quality Control (DFTQC) found about 16% of food had some kind of adulteration. Among the different food commodities, milk led the share of adulterated products. According to media reports, coliform bacteria were found in the processed milk, and outdated sugar was used for producing dairy products (Rijal, Reference Rijal2016). The consumers were also cognizant about the food safety issues in milk in Nepal. The National Dairy Development Board (NDDB) in 2014 revealed that about 50% of surveyed consumers’ prime concern was quality of milk, including food safety (NDDB, 2014). Importantly, in the same survey, 15% of consumers opined that an education campaign to increase the FSC of the consumers was needed.
In this paper, we first test for the determinants of FSC and then test the hypothesis that greater FSC is associated with greater expenditure in milk due to payment of premium for quality and safety. Apart from being a possible determinant of expenditure on dairy, FSC also plays a role in influencing the choice of marketing outlet driven by subjective beliefs on providing quality and/or food safety.Footnote 1
Despite the importance of FSC, the literature provides little or no evidence on its impact on consumers’ purchasing behavior. Importantly, unlike previous studies that employed a stated preferences method (Angulo and Gil, Reference Angulo and Gil2007; Birol et al., Reference Birol, Karandikar, Roy and Torero2015; Buzby et al., Reference Buzby, Fox, Ready and Crutchfleld1998; Ehmke, Lusk, and Tyner, Reference Ehmke, Lusk and Tyner2008; Krishna and Qaim, Reference Krishna and Qaim2008; Wolf, Tonsor, and Olynk, Reference Wolf, Tonsor and Olynk2011), which may result in the hypothetical bias, we try to elicit the revealed preference for food safety by using data on milk prices, expenditure, and choice of market outlets. If consumers’ choices about products depend on nonprice attributes such as food safety, their FSC would bear on consumers’ purchasing behavior.
Using a principal component approach, we compute a food safety consciousness index (FSCI) as an indicator of FSC similar to Birol et al. (Reference Birol, Karandikar, Roy and Torero2015).Footnote 2 The FSCI is created from the knowledge, attitude, perceptions, and practices (KAPP) information collected through the survey. On the side of analysis of the linkages, the study uses survey data from 1,029 households from four districts of Nepal and employs instrumental and quantile instrumental variable (QIV) models to estimate the heterogeneous effects of the FSC on the weekly milk expenditure.
The study is organized as follows: Section 2 presents the data and descriptive statistics. Section 3 presents the empirical methods used. Section 4 discusses the empirical results. Finally, Section 5 concludes with some implications.
2. Data and descriptive statistics
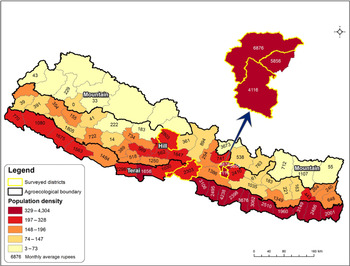
The study uses primary data collected by the International Food Policy Research Institute and Integrated Institute of Development Studies (IIDS) in 2015. The data were collected from four districts of Nepal: Chitwan, Kaski, Lalitpur, and Kathmandu. Chitwan is in the Terai region (the foothills), and Kaski, Kathmandu, and Lalitpur are in the hilly region. These districts were selected owing to diverse types of milk marketing systems and a large middle-income population. These areas are also densely populated and have comparatively high milk consumption in Nepal (Figure 1).Footnote 3 We also created the variables related to district-level milk production (NMOAD, 2015). While district-level milk production influences the supply of milk, the population forms a proxy for milk demand. Both the demand and supply side factors are expected to influence the weekly milk expenditure via milk prices and quantity supplied and demanded and are included in the expenditure analysis.
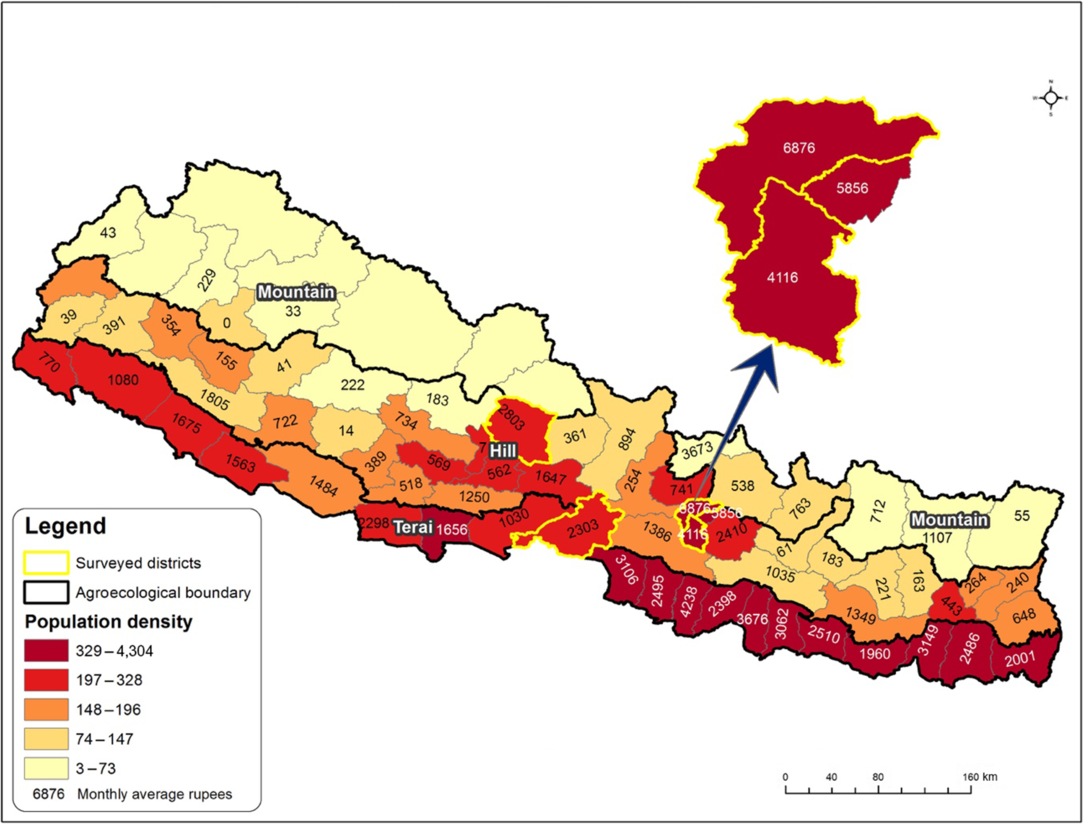
Figure 1. Population density and the average monthly household milk expenditure (Rs) in a district. Note: The figures in the map denote the average monthly household purchase of milk (in Rs) in a district. Data source: Nepal Living Standard Survey 2010–2011.
We targeted households from residential areas in both urban and peri-urban areas, focused on dairy consumers and not producers. We administered surveys in the urban and peri-urban/rural areas of the four districts. We followed a stratified multistage sampling approach where the primary stage units were the wards, and the second (last) stage units were households. A total of 1,040 respondents were surveyed from 26 wards of these districts. The number of wards was determined in proportion to the district population. Two villages were selected randomly from each ward.
The household listing was done in each selected location by trained enumerators. Subsequently, 20 households were selected from a location using a systematic random sampling approach. Only 1,029 households were found to purchase dairy products and were considered in this study: 154 from Chitwan, 197 from Kaski, 400 from Kathmandu, and 278 from Lalitpur. Note that in spite of the sampling design, the milk-purchasing households surveyed are not a representative sample of the Nepali population. Therefore, our results need to be cautiously interpreted when generalized to the entire Nepali population.
The survey assessed dairy consumption, purchasing patterns, and consumer awareness regarding food safety. Further, the survey collected information on socioeconomic characteristics, dairy consumption, purchasing patterns, and food safety awareness, as well as the choice of market outlets. About 93%, 68%, and 37% of households consume milk, curd, and ghee more than once a week, respectively. Our study focused on milk, as it is the most frequently consumed dairy product in the country.
Most consumers (49%) purchase milk from unorganized retailers (milkmen also called doodhwalas). About 22% of milk-consuming households purchase milk from their neighbors, followed by those who purchase from private dairy (17%), dairy cooperatives (11%), and organized retailers (1%). Purchasing milk from neighbors is popular in the suburban and rural areas. As the milk sold by the milkmen and neighbors is not scientifically tested and labeled, there is likely greater food safety risk in the milk purchased from the milkmen and the neighbors.
Table 1 shows the summary statistics of the variables used in the analysis. The first outcome of interest in this study is the average weekly milk expenditure. The average weekly milk expenditure of a household is Rs 448, with a maximum of Rs 4,500. The average quantity of milk purchased by a household in a week is about 7 liters (i.e., about 1 liter/day). On average, about 24% of households are infrequent milk consumers (i.e., consume milk three times a week or less). We expect that the frequent milk consumers are more likely to care about food safety and comparatively inclined toward higher milk expenditure.
Table 1. Descriptive statistics of the variables used in the analysis (Nepal Dairy Survey 2015)
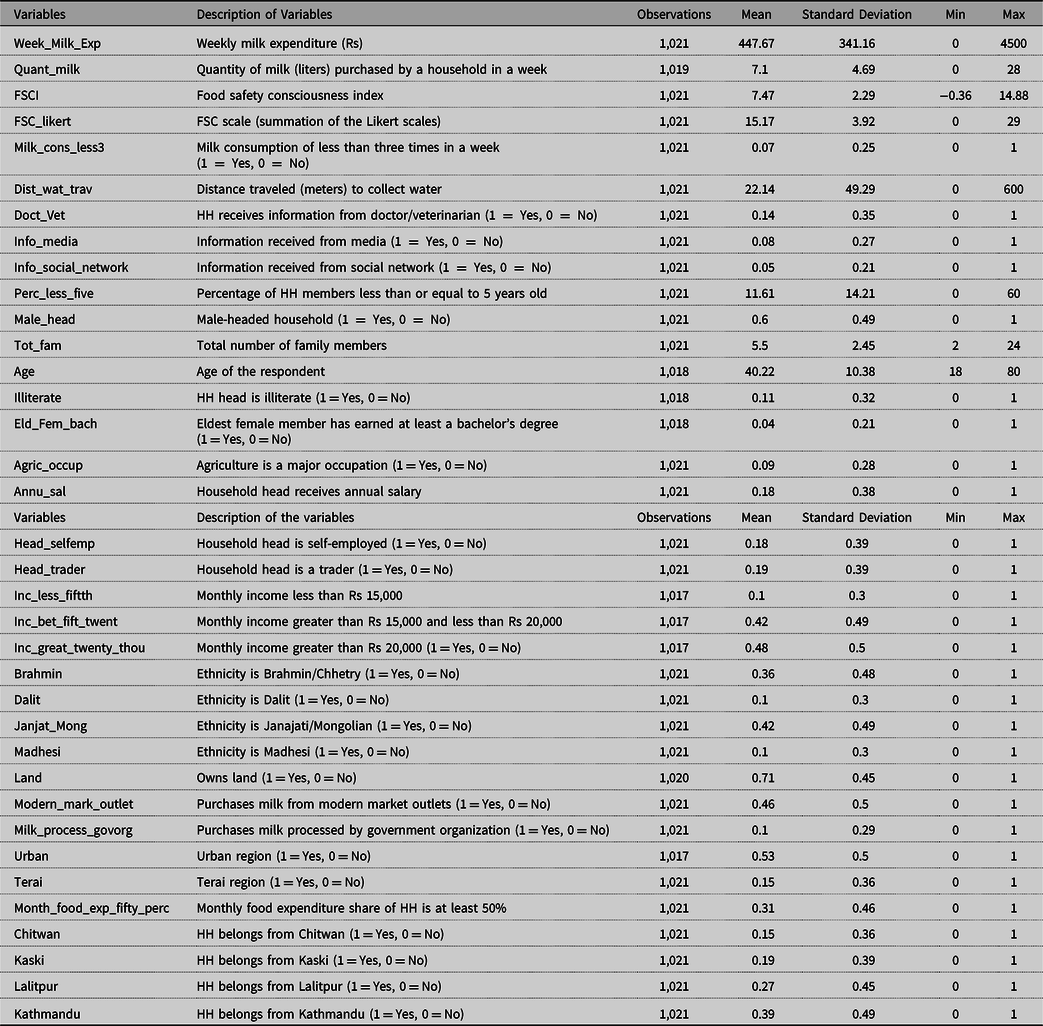
As information can play an important role in determining FSC, we incorporate access to different sources of information about food safety. About 8% of households receive information from print media, 14% from doctors, and 5% from their social networks. Regarding demographic characteristics, the average age of a household head is 40 years, females head about 40% of the households, and average household size is 5. Increase in household size expectedly leads to an increase in the weekly milk expenditure of the households. On average, about 12% of household family members are under the age of 5. Households dominated by the children are relatively more likely to be food safety conscious. Of the sampled households, 53% are urban. About 11% of household heads are illiterate, and only 4% of the eldest female members of the household have an education at the bachelor level. Household heads with higher education may have higher earnings and be more likely to incur higher weekly milk expenditure.
In terms of monthly income, about 10% households have income below Rs 15,000; 42% have an income between Rs 15,000 and Rs 20,000; and 48% have income above Rs 20,000. As different ethnic groups are likely to have unique food habits, we also include ethnicity-related variables in our analysis. About 42% of households are Janjati (tribal) and Mongolian, followed by Brahmin or Chhetry (36%), Madhesi (10%), and Dalit (10%). Controlling for ethnicity helps control for omitted variables such as traditions/festivals, behavioral norms, and food culture that are likely to influence the level of FSC, weekly milk expenditure, and choice of market outlets.
About 71% of households in our sample own land. Regarding occupation, about 19% of households are traders, 18% are self-employed, and 17% are salaried job holders. More than 31% of households have a monthly food expenditure share greater than 50% of the total expenditures, implying a largely poor population. About 46% of households (less than half) purchase milk from a formal market. About 51% of households purchase branded milk, whereas about 42% purchase milk from private processors and only 10% purchase milk produced by the government-owned Dairy Development Corporation (DDC). Milk purchased from formal markets is perceived to be safe for consumption and fetches higher prices in comparison to the milk purchased from informal milk outlets.
3. Empirical framework
We estimated separate models for the factors influencing the FSC, assessing the effects of FSC on weekly milk expenditure, and factors influencing the probability of purchasing milk from modern marketing channels versus from traditional marketing channels.
3.1. Factors influencing food safety consciousness
We computed FSCI as a proxy of FSC. Section 4.2 explains the construction of FSCI. Subsequently, variants of FSC are discussed in detail. We classified the sample into three groups based on the percentile of the FSCI. Those households falling below the 25th percentile were considered as low FSC, between 25th and 75th percentiles as medium FSC, and those above the 75th percentile as high FSC. We plan to assess the factors influencing a shift toward higher FSC. Since the dependent variable is categorical and ordered in nature, an ordered probit model was used as follows:
 $${Y^*} = {\beta _0} + X'\beta + \varepsilon, $$
where Y * is unobserved. What we observe is:
 $$Y = 0\, {\rm {if}}\, {Y^*} \le 0\, \left({\rm Low\, \,FSCI\, \,group} \right)$$
 $$Y = 1\;\; {\rm {if}} \;0 \lt {Y^{*}} \le {\mu _1} \left( {\rm Medium\, \,FSCI\, \,group} \right)$$
 $$Y = 2\;\; {\rm {if}} \,{\mu _1} \lt {Y^*} \le {\mu _2} \left( {\rm High\, \,FSCI\, \,group}\right).$$
Here the µs are the cutoff points and are unknown parameters to be estimated with the βs, and ε is an error term assumed to be normally distributed. Once the mean and variance are normalized to 0, the probabilities for each group can be written as follows:
 $${\rm{Prob}}\left( {y = 0|X} \right) = 1 - \phi \left( { - X'\beta } \right),$$
 $${\rm{Prob}}\left( {y = 1|X} \right) = \phi \left( {{\mu _1} - X'\beta } \right) - \phi \left( { - X'\beta } \right),$$
 $${\rm{Prob}}\left( {y = 2|X} \right) = 1 - \phi \left( {{\mu _1} - X'\beta } \right).$$
For all these probabilities to be positive, it must be true that 0 < µ 1 < µ 2 · φ is the cumulative density function. Since these coefficients relate to the latent variable, we need to estimate the marginal effects of the independent variable on the probabilities as follows:
 $${{{\rm{dProb}}\left( {y = 0|X} \right)} \over {{\rm{d}}X}} = - \varphi \left( { - X'\beta } \right)\beta ,$$
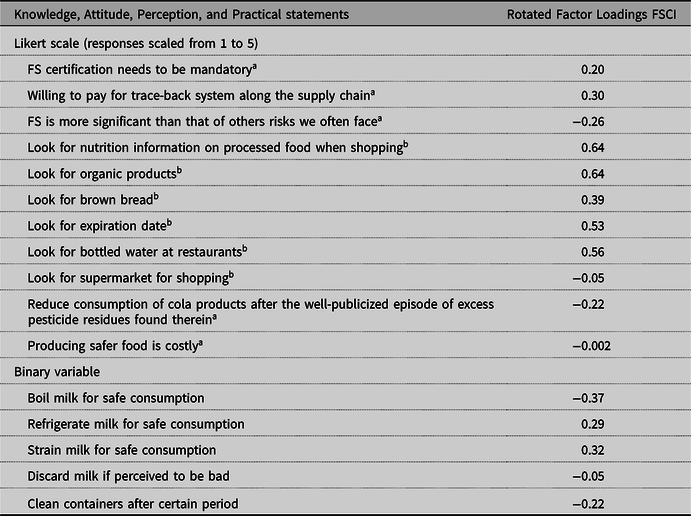
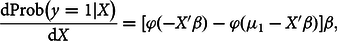 $${{{\rm{dProb}}\left( {y = 1|X} \right)} \over {{\rm{d}}X}} = \left[ {\varphi \left( { - X'\beta } \right) - \varphi \left( {{\mu _1} - X'\beta } \right)} \right]\beta ,$$
 $${{{\rm{dProb}}\left( {y = 2|X} \right)} \over {{\rm{d}}X}} = \varphi \left( {{\mu _1} - X'\beta } \right)\beta .$$
Here φ is the probability density function.
3.2. Association of food safety consciousness index with weekly milk expenditure
Regardless of the price, households with high level of FSC are expected to purchase safer, nutritious, and branded food products. To assess the relationship, we estimate the equation (8),
 $${\rm{ln}}{Y_1} = {\alpha _1} + {\beta _1}{\rm{ln}}\,FSCI + {\gamma _1}X + {\varepsilon _1},$$
where Y 1 denotes the weekly milk expenditure; FSCI denotes the FSCI; X is the vector of control variables; and ε is an error term with mean zero. We performed the log transformation for both the FSCI and the dependent variables (weekly milk expenditure) to facilitate interpretation in terms of elasticity. If FSCI were to be exogenous to weekly milk expenditure, the coefficient βi would represent the true average effects of FSCI on outcomes such as milk expenditure. However, the FSC level is not randomly assigned to the households, and there may be omitted variables that are likely to influence both the FSC and the outcomes such as milk expenditure.
Examples of such observed and unobserved omitted variables comprise factors such as habit formation, that is, number of years of dairy consumption; local food safety events such as scandals related to dairy products; exposure to food safety awareness program conducted by DFTQC, consumer organizations, or Dairy Development Corporation (DDC). These factors are likely to influence FSC and weekly milk expenditure. In our case, the endogeneity problem is likely due to omitted variables rather than simultaneity.
The vector of control variables X are percent of children less than or equal to 5 years in a family, household head type, family size, age of the household head, literacy status of the household, occupation type, employment status, income, land ownership, choice of market outlet types, frequency of milk consumption, and residential location. Milk is an important children’s food. Therefore, households with higher percentages of children are likely to buy more milk and incur higher milk expenditure. We also control for the age of the household head as it is likely to influence milk expenditure. Younger household heads may be more aware of the health and nutritive value of the milk, and therefore likely to purchase a higher quantity of milk. On the other hand, an older household head is likely to be more educated and possibly also higher-earning, leading to greater milk expenditure.
Education status of the household head is also likely to positively influence milk expenditure due to likely higher-income greater awareness about benefits of milk. Household milk expenditure also varies based on the employment status of the household head. Household heads receiving annual salaries may have comparatively stable earning that bears on expenditure on high-value items like milk. Land is an important asset and signals the wealth and income status of the household. Households owning land are expected to purchase more milk on average than landless households.
Also, a household with a higher frequency of consumption is likely to frequently purchase milk and incur higher milk expenditure. Therefore, we include the frequency of milk consumption as one of the covariates. Choice of market outlet may influence the weekly milk expenditure. Usually, milk sold through modern market outlets is likely to fetch higher prices and thus households buying milk from such outlets are likely to incur higher expenditure. We also control for location-specific characteristics to account for unobserved geographical heterogeneity.
Our identification strategy relies on the use of an instrumental variable (IV) (i.e., finding a variable or variables correlated with FSC and uncorrelated with the error term in equation [8]). There are two key assumptions of the IV method. First, the instruments must be correlated with the endogenous variable, which can be tested with “first-stage F-statistics” from first-stage regression. Small values (less than 10) of first-stage F imply failure of the first assumption. Second, the instruments must be uncorrelated with the error.
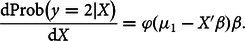
The instrumental variable employed to establish the casual relationship is the distance (in meters) traveled to collect drinking water. The average distance traveled by a household to collect drinking water is about 22 meters, with a maximum of 600 meters. We expect that households with higher FSCI scores are less likely to collect water from distant water sources (mainly from wells, rivers), which may not be safe for drinking. In fact, as shown in Figure 2, the distance to collect drinking water is negatively and significantly correlated with the FSCI. However, the distance traveled to collect drinking water is not expected to influence the weekly milk expenditure incurred by the households.Footnote 4 Thus, the identifying assumption is that the instrumental variable is uncorrelated with ε 2 in equation (8). The instrumental variable regression model is estimated as follows:
 $${\rm In}\,{Y_1} = {\alpha _2} + {\beta _2}\,{\rm In}\,{\widehat {FSCI}} + {\gamma _2}X + {\varepsilon _2},$$
where  ${\widehat {FSCI}}$ is the predicted value of FSCI obtained from the first-stage regression of FSCI on instrumental variable and all the control variables (X) in equation (9) as shown below:
 $${\rm{In}}\,FSCI = {\alpha _3} + {\beta _{3d}}D + {\gamma _3}X + {\varepsilon},$$
where D is the distance traveled to collect drinking water and is an error term with mean zero. If our instrument (D) is valid and exogenizes FSCI relative to weekly milk expenditure, the coefficient β2i is the local average treatment effects [LATE]) of FSCI on the outcome variable.Footnote 5
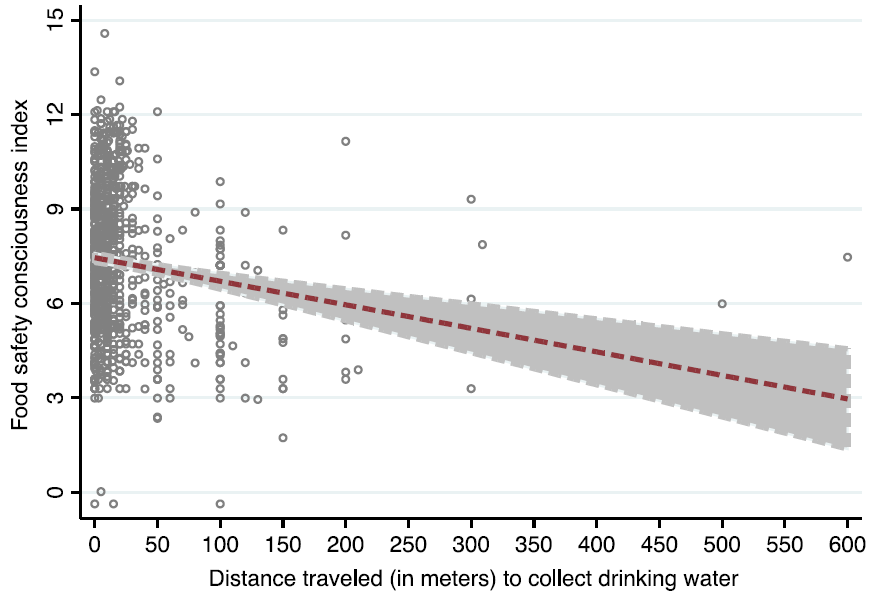
Figure 2. Distance traveled (in meters) by sampled households to collect drinking water. Source: Nepal Dairy Survey 2015.
We also conduct QIV estimation to account for the large variations in weekly milk expenditure, as simply analyzing the means may not reveal the true picture. We estimate the effects of FSCI across the conditional weekly milk expenditure distribution. Unlike the above approach, we now also account for the potential heterogeneity by assessing whether the same level of FSCI could be more effective at different levels of the weekly milk expenditure distribution. Addressing such heterogeneity leads to the efficient estimates. As suggested by Chernozhukov and Hansen (Reference Chernozhukov and Hansen2005), the quantile outcome is related to its quantile function as shown below:
 $${Y_1} = \left( {FSCI,X,{U_d}} \right), \,{\rm where }\, {U_d}\sim U\left( {0,\!1} \right),$$
where the weekly milk expenditure variable is conditioned on the distribution (q = {0.10, 0.25, 0.50, 0.75, 0.90}); X is the vector of control variables; and Ud is the rank variable that determines the outcome heterogeneity among households with similar characteristics and FSCI levels located at different levels of the weekly milk expenditure. The rank Ud represents unobserved characteristics and determines the relative ranking in terms of potential outcomes. We also report results from a quantile regression, which can be used as a benchmark to compare the results from the QIV estimation.
3.3. Food safety consciousness and the probability of purchasing from modern marketing channel versus traditional marketing channel
Since the dependent variable of interest, the type of marketing channel, is a dichotomous variable, we implement the probit model accounting for the endogenous regressor (FSCI). Given our endogenous regressor (FSCI) is continuous and the model is nonlinear, we use the two-step control function approach. In the first stage, we estimate equation (10) and obtain, in a reduced form, the generalized residuals ε. We then add these residuals to the second stage as follows:
 $${M_h} = {\alpha _0} + \varphi FSC{I_h} + \gamma {X_h} + \rho {\varepsilon _h} + {\vartheta _h},$$
where Mh is the type of market outlet selected by the h th household. This is a binary variable coded as 1 if a household purchases milk from the modern marketing channel and 0 otherwise, and  $\vartheta $ is an error term assumed to be independently and identically distributed. The model transforms to a probit model if the added residual variable is insignificant. Our assumption is that the instrumental variables are orthogonal to the error term of the structural equation. We use Newey and West (Reference Newey and West1987) minimum chi-square estimator to obtain the two-step estimates. Finally, we estimate the average marginal effects to estimate the effects of FSCI on the probability of purchasing milk from the modern market outlet.
4. Results and discussion
4.1. Consumers’ awareness and perception of food safety
Focus group discussions were conducted for the development of the questions related to the consumers’ awareness and perception of food safety. The discussion, attended by 15 participants, was organized in Kathmandu in July 2015. The participants represented DFTQC, Department of Livestock, consumer associations, dairy processing industries, dairy farmers, and urban consumers. The group deliberated on the concerns and issues related to the food safety issues in milk consumption in Nepal.
Several questions were formulated based on focus group discussions. These questions were asked to the surveyed households to examine consumer awareness and perceptions about food safety. Eleven questions were coded according to a five-point Likert scale, and five awareness questions were coded with binary options (Table 2). Since incorporating all these variables that measure similar concepts can introduce collinearity in the regression analysis, we use factor analysis to combine multiple statements into a single factor, that is, the FSCI which we use to measure the level of consumer awareness and attitudes toward food safety.
Table 2. Computation of FSCI using factor score approach
a Likert scale with categories (1 = strongly disagree, 2 = disagree, 3 = neither agree nor disagree, 4 = agree, 5 = strongly agree).
b Likert scale with categories (1 = never, 2 = rarely, 3 = sometimes, 4 = often, 5 = always).
An iterated principal factor extraction method was used for factor analysis. Following Child (Reference Child2006) and Harman (Reference Harman1976), we retain the factor of eigenvalues greater than 1. Loadings above 0.30 (absolute terms) were considered as factoring together. These loadings indicate how well the factors represent the actual data and account for the variance in the observed variables (Table 2). Finally, we created a weighted FSCI variable for ith household by multiplying the kth variable with their respective loading, cik and summing across 16 variables as follows:
 $$FSC{I_i} = \mathop \sum \nolimits_{k = 1}^{16} {c_{ik}}{x_{ik}}.$$
We also created an alternative variable to the FSC variable by simply adding the points assigned to answer several food safety awareness questions. Similar to the FSCI, households receiving higher scores are considered more food safety conscious. We use this measure to assess the robustness of the findings related to FSCI.
Table 2 presents the individual statements and their factor loadings used for computing the FSCI variables. Households with a higher level of FSCI are considered more food safety conscious. Although the FSCI does not have a direct interpretation, the individual statement can be used to assess the consumers’ awareness and perception of food safety.
While purchasing food, about 9%, 10%, 2%, and 27% of households, respectively, often or always look for nutrition information, organic products, brown bread, and expiration dates, respectively. About 22% of consumers order bottled water in restaurants, and about 44% purchase food from supermarkets. On average, these statistics indicate a low level of food safety and nutrition consciousness. There are several possible reasons for this. For example, households may not be familiar with the potential benefits of brown bread and organic products, may not have understood the importance of expiration dates, and may not be aware of the food quality available in the supermarkets.
While assessing the consumers’ perception of food safety reflected by the percent of households that agree with the respective food safety statements, we find about 70% of households agree or strongly agree that food safety certification needs to be made mandatory; 65% of households agree or strongly agree that an additional cost should be incurred for a trace-back system; yet 45% agree or strongly agree that food safety risk is less significant than other common risks; and 74% agree or strongly agree that safe foods need to be produced at an increased cost.
We also examine the status of practices adopted by the households for safer milk consumption. Although 92% of households boil milk before consumption, about 92% of households did not discard milk that is deemed unsafe for consumption. While 16% of households use a refrigerator for storing milk, only 6% practice straining. Usually the straining is done to remove dust, hairs, and other external materials from the milk. Although consumers seem to have a strong perception of food safety, the practices adopted for safe milk consumption are not commensurate.
4.2. Factors influencing food safety consciousness
Table A1 in the Appendix provides the results from the main models, that is, both the OLS and the ordered probit. In case of OLS, we transform the FSCI into logs to facilitate the interpretation (in terms of percentage change). For the ordered probit model, we obtain the marginal effects to facilitate the interpretation of the coefficients.
Table 3 shows the marginal effects from the ordered probit model.Footnote 6 We cluster the standard error at the community level and report the robust standard errors. Infrequent dairy consumers (proxied by a frequency of milk consumption of three times a week or less) have about 14% lower probability of being in the high FSC category relative to the frequent dairy consumers (who consume milk more than three times a week). Households receiving food safety information from their social network have 12% higher chances of being highly food safety conscious. Chandra et al. (Reference Chandra, Munasib, Roy and Sonkar2015) also find statistical evidence of peer effects in consumers’ attitudes toward various food safety attributes and practices among dairy consumers in India.
Table 3. Marginal effects from ordered probit model assessing the factors influencing the food safety consciousness
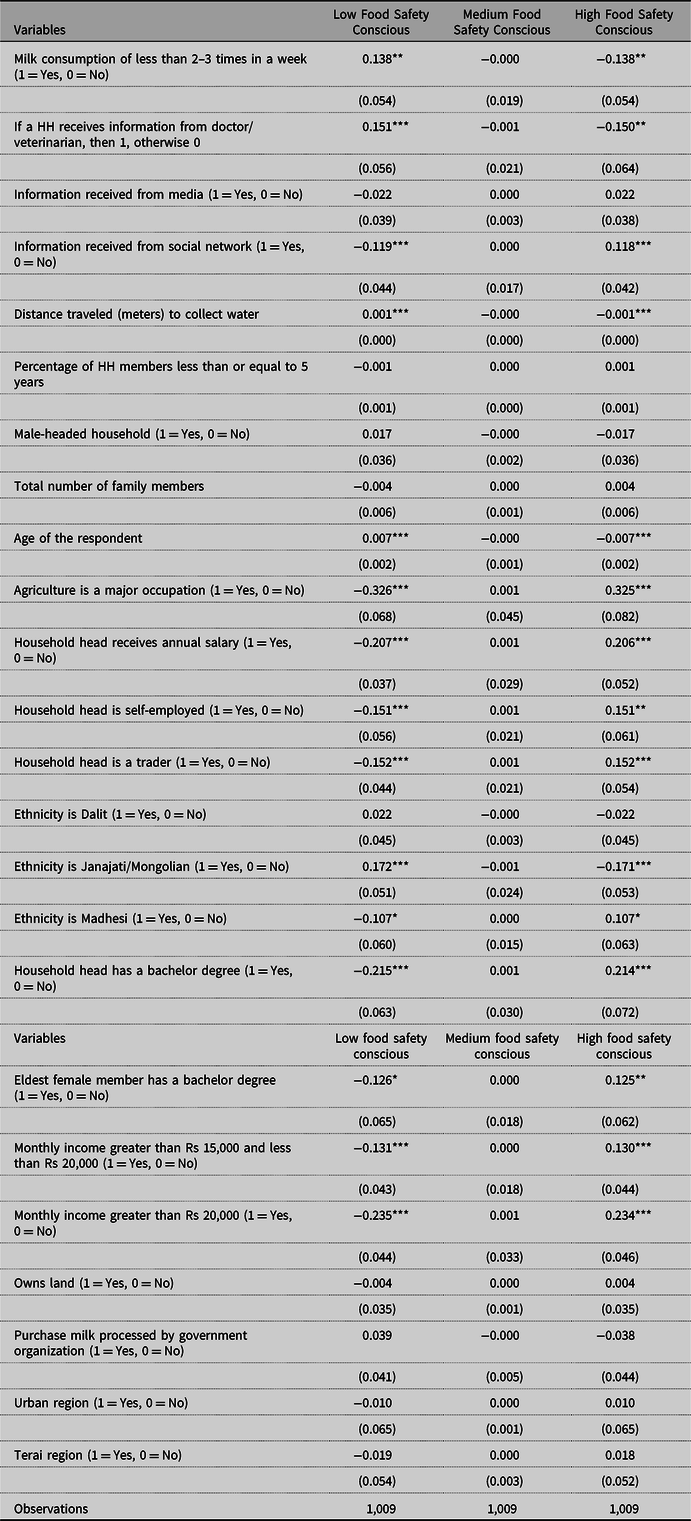
***P<0.01, **P<0.05, *P<0.1
Note: Standard errors in parentheses.
Increase in age of the household head reduces the probability of being in the high food safety conscious category. Importantly, FSC varies significantly among ethnic groups. Madhesi households are more likely to be food safety conscious than Brahmin or Chhetry households. Higher education increases the probability of falling into the high food safety conscious category. Households with higher incomes are also likely to have higher FSC.
Households with a monthly income greater than Rs 20,000 have about 23% higher chance of being among the higher food safety conscious households, while households with a monthly income between Rs 15,000 and Rs 20,000 have about 13% higher chance of being in the higher food safety conscious households group in comparison to the reference category (i.e., households with a monthly income of less than Rs 15,000).
4.3. Impact of food safety consciousness on milk expenditure
Table 4 shows the results for weekly milk expenditure. Using the variance inflation test, we find a variance inflation factor of less than the cutoff value of 4 for all variables. This suggests that the independent variables included in the model are not highly correlated to create the multi-collinearity problem.
Table 4. Impact of food safety consciousness on weekly milk expenditure (Rs) using instrumental variable approach
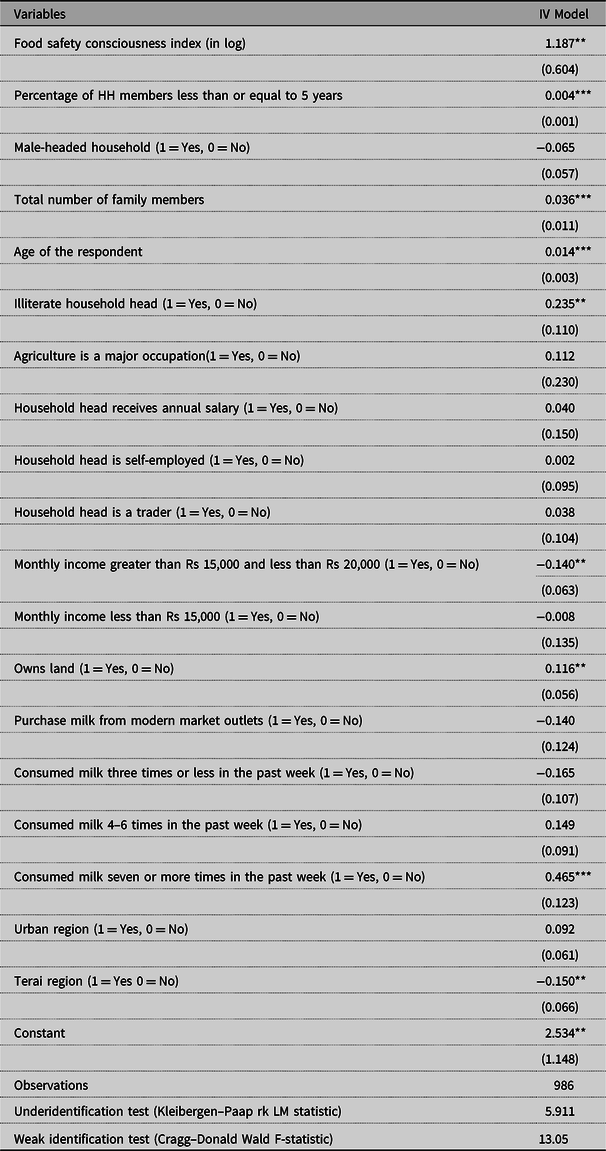
***P<0.01, **P < 0.05, *P < 0.1.
Note: Robust standard errors in parentheses.
Owing to common factors leading to endogeneity, we implemented the IV approach to estimate the impact of FSCI on weekly milk expenditure accounting for within-cluster correlation of the disturbances. Before estimating IV model, we conducted a diagnostic test to assess the suitability of the instrument. The first-stage regression results revealed F-statistics of at least 10 for both models and revealed the instrument to be statistically significant at less than the 1% level with the t-statistics of greater than 3; thus, weak identification is likely not a concern. For each endogenous variable, it requires at least two instruments to conduct the exogeneity test. Therefore, we are not able to conduct an instrument exogeneity test as we only have one instrument and thus our equation is exactly identified.Footnote 7
Following Angrist and Pischke (Reference Angrist and Pischke2008) and Chernozhukov and Hansen (Reference Chernozhukov and Hansen2005), we also conducted a reduced-form test. The reduced-form test is done in the instrumental variable regression model to detect if there is an evidence of a causal relationship flowing between the endogenous variable and the dependent variable of interest. Here, the instrument is directly regressed to the dependent variable. Any evidence of statistical significance indicates the causal relationship between endogenous variable and dependent variable. Table A2 presents the results of a reduced-form regression of weekly milk expenditure on the distance traveled to collect drinking water. The reduced-form relationship between the IV and the dependent variable is significant at 1% level, indicating evidence of a causal relationship between FSCI and milk expenditure.
An increase in FSCI by 1% is associated with an increase in weekly milk expenditure by 1.19% and is statistically significant at less than 5% level. Other factors positively influencing the weekly milk expenditure are family size, number of children below age of 5, age of the household head, land ownership, and the frequency of milk consumption.
4.4. Food safety consciousness and choice of modern marketing outlets
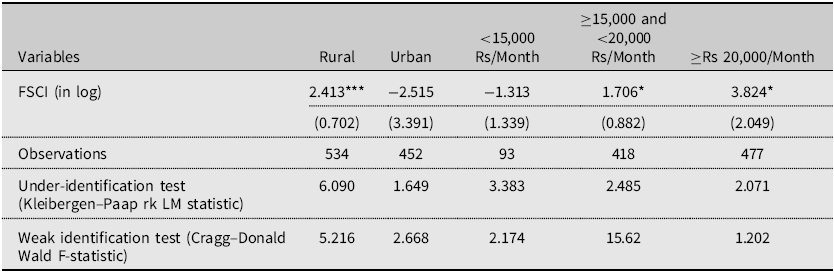
We assess effects of FSC on the probability of purchasing milk from modern market outlets (Table A3). First, we estimate the linear probability model, followed by the probit and ivprobit models. Since the residuals estimated from the ivprobit model are not significant, we simply interpret the marginal effects from the probit model in terms of association rather than causation. Results indicate that an increase in FSCI by 1% is associated with a 36% increase in the probability of purchasing milk from modern milk outlets and is statistically significant at less than 1% level. In addition to FSCI, the factors positively and significantly influencing the choice of modern market outlets are percent of children below age of 5, age of the household head, and land ownership. Households from urban region are more likely to choose modern market outlet which may be due to the supply factors.
We further assessed the effects of FSC on the probability of choosing the specific type of outlet (Table 5). We find positive effects of FSC on the probability of purchasing milk from cooperatives, that is, statistically significant at 10% level. An increase in FSCI by 1% is associated with a 6% increase in the probability of purchasing milk from milk cooperatives. Usually milk cooperative associations are concerned with their reputation and be aware of the milk quality they sell. In fact, Dongol, Thapa, and Kumar (Reference Dongol, Thapa and Kumar2017) find that the farmers in Nepal associated with a milk cooperative have a 17% higher probability of milk acceptance by consumers in Nepal.
Table 5. Marginal effects of food safety consciousness on the probability of selecting specific market outlet
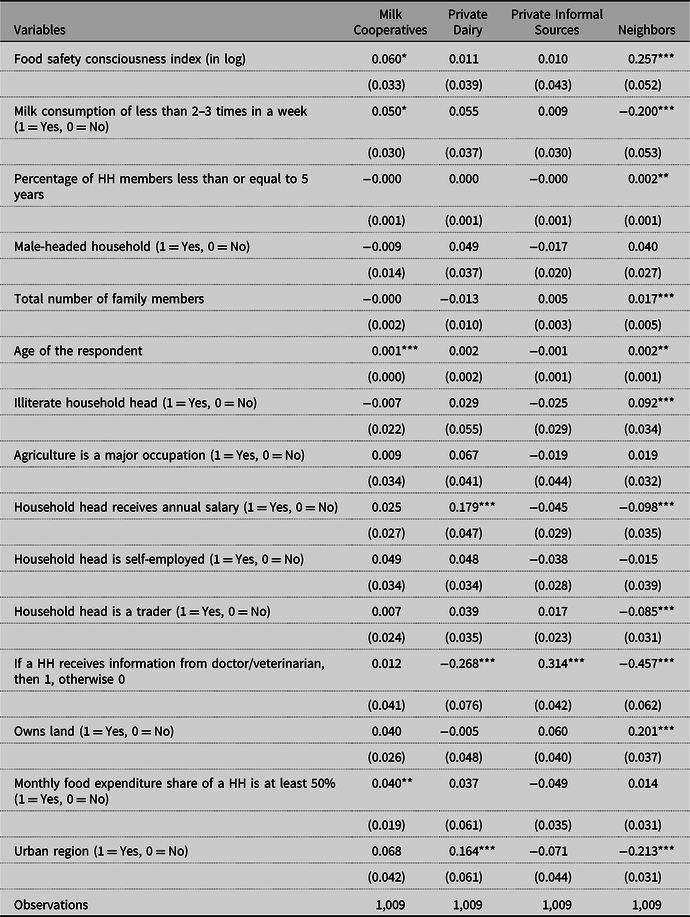
***P < 0.01, **P < 0.05, *P < 0.1.
Notes: Standard errors in parentheses. Marginal effects obtained from post-estimation of the probit model.
Although no significant effects of FSC were found on the probability of choosing private formal dairies and informal market sources, we find positive effects of FSC on the probability of purchasing milk from neighbors. An increase in FSCI by 1% is associated with a 26% increase in the probability of purchasing milk from neighbors. While infrequent dairy consumers have a 5% higher probability of purchasing milk from milk cooperatives, frequent dairy consumers have a 20% higher probability of purchasing milk from the neighbors.
4.5. Heterogeneous effects of food safety consciousness on milk expenditure
Table 6 reports the estimated coefficients associated with weekly milk expenditure at five points of the FSC distribution (quantiles 0.1, 0.25, 0.5, 0.75, and 0.90).Footnote 8 We first present the results from the quantile regression as a baseline result and is reported in the columns labeled QE.Footnote 9 We also took into account the potential endogeneity related to the omitted variable bias, and the results are reported in the columns labeled QE-IV.
Table 6. Quantile effects by weekly milk expenditure (Rs)
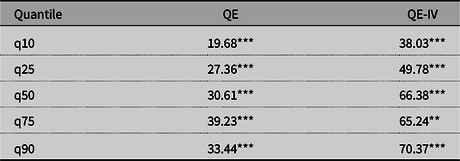
***P < 0.01, **P < 0.05, *P < 0.1.
Note: The coefficients are reported for the food safety consciousness index.
The impact of a marginal increase in FSC is higher at the top of the weekly milk expenditure distribution and decreases monotonically toward the bottom of the distribution. These results reveal that the impact of increasing FSC will be highest at the top of the weekly milk expenditure distribution. Overall, the findings from the quantile analysis show the underlying heterogeneous effect of FSC on weekly milk expenditure.
4.6. Robustness check
We conducted robustness checks to assess whether our main results are likely to change under different model specifications or across different sample sizes. Also, we assess whether the findings are likely to change under the different measures of FSC. As discussed earlier, we created an alternative of FSC index by summing the points that correspond to answers to several food-safety-awareness questions.
Our results are robust to alternative measure of FSC (Table A4). Although there is a change in magnitude, the statistical significance and the sign of the elasticity estimates remain preserved. We also assess whether the findings from the weekly milk expenditure apply to the specific income groups and regions (urban as well as rural and suburban; Table A5). For the weekly milk expenditure model, we find FSC estimates to be positive and statistically significant only for the rural households. Similarly, the FSC estimate was positive and statistically significant for households with income greater than Rs 15,000/month. Overall, the results are robust across the changes in model specifications and across alternative measures of the FSC variable.
5. Conclusion and policy implications
One of the ways to promote the dairy industry can be by increasing consumer awareness toward food safety such that greater value is generated in the dairy value chain. This study examines the factors influencing FSC and estimates its effects on weekly milk expenditure and the probability of selecting market outlet. The primary data were collected using the pretested survey instrument from 1,029 households selected randomly from four districts (Chitwan, Kaski, Kathmandu, and Lalitpur) of the country. We collected information related to the consumption of dairy products, such as purchasing patterns, consumer awareness and perception of food safety, milk price paid, the sources of purchase, and the socioeconomic characteristics of households.
Increasing FSC of consumers is important for several reasons. First, only safety-conscious consumers can be active partners in reducing the prevalence of foodborne diseases. Second, such consumers can be willing to pay a premium price for safe food thereby creating a demand pull for market for safe product (Birol et al., Reference Birol, Karandikar, Roy and Torero2015). Producers will comply with food safety measures only if they receive a price that covers their cost of production including the cost of compliance (Kumar et al., Reference Kumar, Thapa, Roy and Joshi2017).
First, we assess the consumers’ awareness and perception of food safety reflected in the percent of households who agree with specific food safety statements. Then, simple linear regression and the ordered probit models were used to estimate the factors influencing FSC. The instrumental variable approach was used to estimate the possible causal impact of FSC on weekly milk expenditure and probability of purchasing milk from modern market outlets. We also used the QIV approach to estimate the heterogeneous effects of FSC on weekly milk expenditure. Further, a robustness test was conducted to assess the robustness of the findings against the change in the model specifications, sample sizes, and an alternative of FSCI.
The perceptions on milk food safety are not extended into practices adopted for the safe milk consumption in Nepal. About 92% of households still do not discard milk deemed unsafe for consumption. The results show that infrequent dairy consumers have about 14% lower FSC, while households receiving food safety information from their social network have about 12% higher FSC. FSC significantly varies among ethnic groups. Education, income, and social network were found to be the major factors positively influencing FSC.
The results from the instrumental variable approach revealed that an increase in FSC by 1% increases the weekly milk expenditure by 1.19%. The results from the probit model indicated that an increase in FSC by 1% is associated with a probability of selecting modern milk outlet by 36%. Among the milk outlet types, FSC consumers have a higher probability of purchasing milk from neighbors and milk cooperatives. The results from the QIV regression approach found that the impact of increasing FSC is highest at the top of the weekly milk expenditure distribution. Overall, the results are highly robust across the change in model specifications and the subjective judgment of the FSC variable.
Based on the findings, some implications follow. Although the government enforces regulatory compliance through inspections and testing of the food products, it is important to provide food safety information to the consumers to increase their level of food safety awareness. This might translate to the purchase of safer food products in the long run. Since we found a low level of food safety and nutrition consciousness among the surveyed households, the government needs to prioritize and implement consumer awareness activities and programs to increase knowledge in this area.
Overall, we find high market potential for dairy products in domestic markets. However, to tap the market potential, raising food safety awareness is crucial. Our results show that FSC does influence greater expenditure. This implies a latent demand for product attributes such as food safety. Our study indicates that the food safety conscious consumers are more likely to choose the formal market outlet. Therefore, any consumer awareness programs and policies that increase the FSC level of consumers will lead to increased probability of purchasing safe dairy products from the formal market outlet. At a policy level, this clearly marks the need for credible systems for certification so that awareness of food safety translates into actual choices that reflect the latent demand. The study establishes indirectly a willingness to pay for safer and better-quality products. Finally, our findings are likely to have implications not only for Nepal but also for other settings where rapid urbanization, rising incomes, and changing lifestyles have fueled the demand for milk and milk products.
Acknowledgments
The authors would like to thank Integrated Institute of Development Studies (IIDS), Nepal for conducting the survey and Mr. Pankaj Koirala for his initial efforts in preparing the cleaned data sets. The opinions expressed herein are those of the authors and do not necessarily reflect the views of the sponsoring agency or the institutions where authors are currently affiliated. The authors would also like to thank two anonymous reviewers whose comments and suggestions have led to improve the manuscript. GT conceptualized and designed the study and its methodology. Data acquisition was done by AK, DR, and PKJ under the supervision of AK. Data analysis and software was performed by GT. Original draft of the article was written by GT. AK, DR, and PKJ reviewed the original draft of the article and provided suggestions.
Financial support
This work was supported by the Policy Reform Initiative Project in Nepal, which is funded by the United States Agency for International Development.
Conflicts of interest
None.
Appendix A. Additional Tables
Table A1. Regression results for factors influencing food safety consciousness using OLS and ordered probit models
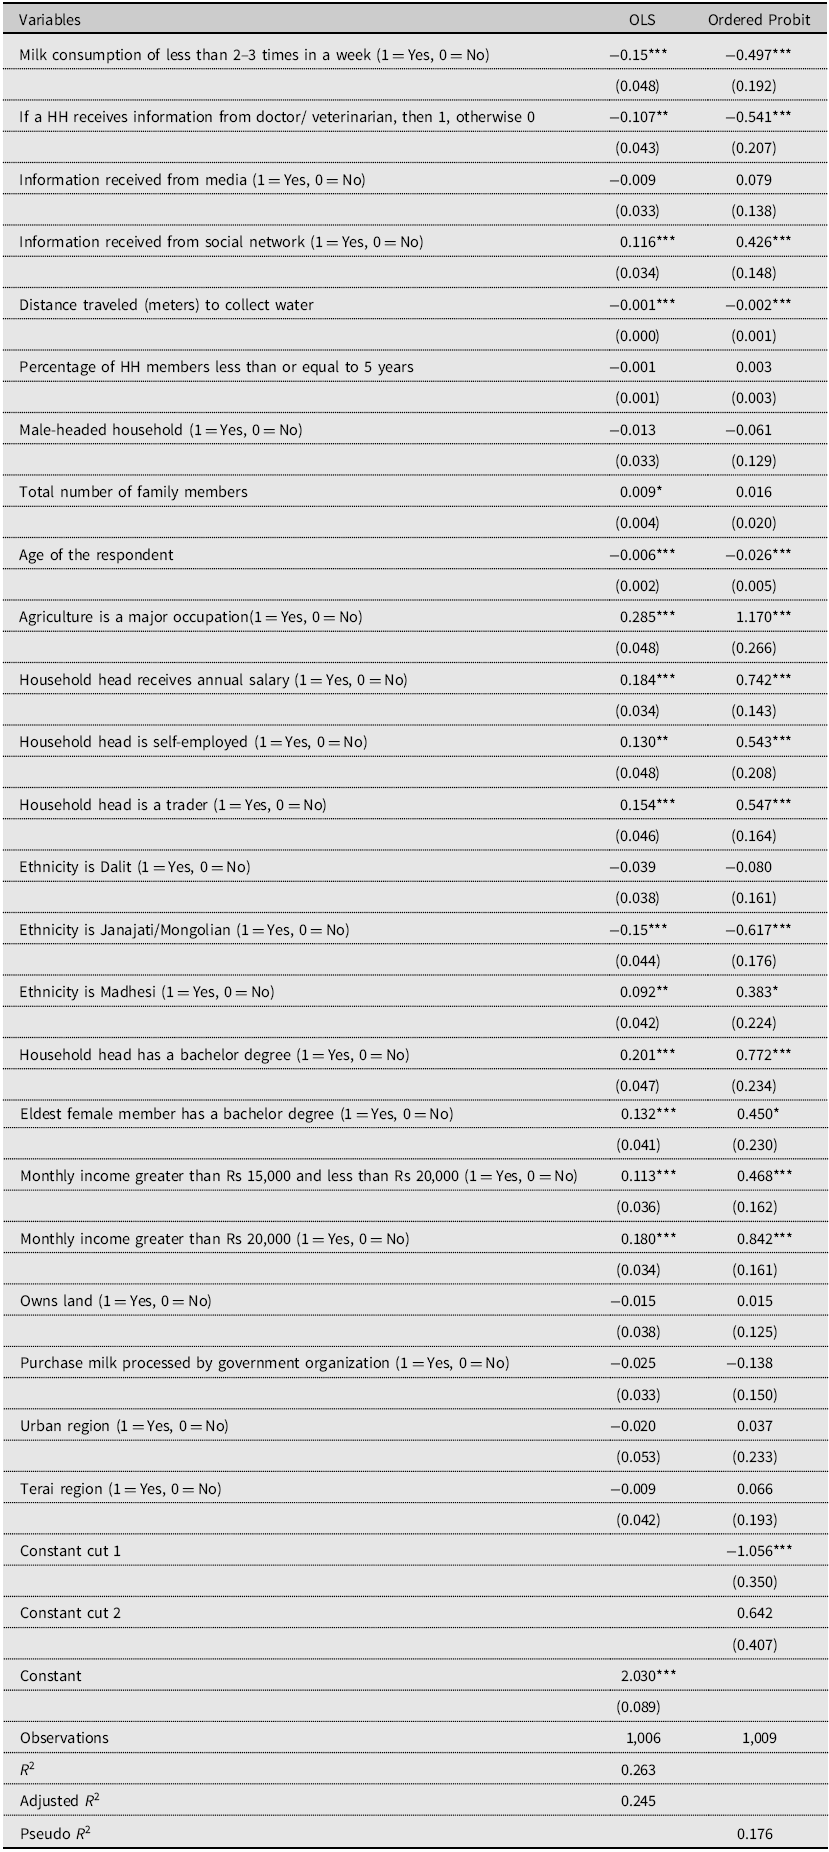
***P < 0.01, **P < 0.05, *P < 0.1.
Notes: For OLS model, the FSCI-dependent variable is logarithmically transformed. Robust standard errors in parentheses. Authors’ calculations.
Table A2. Reduced form test
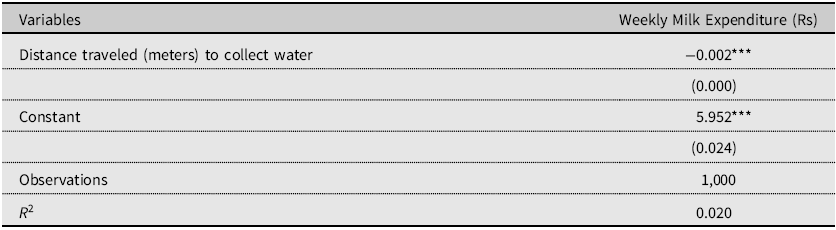
***P < 0.01, **P < 0.05, *P < 0.1.
Notes: Standard errors in parentheses. Authors’ calculations.
Table A3. Effects of food safety consciousness on the probability of purchasing milk from modern market outlets
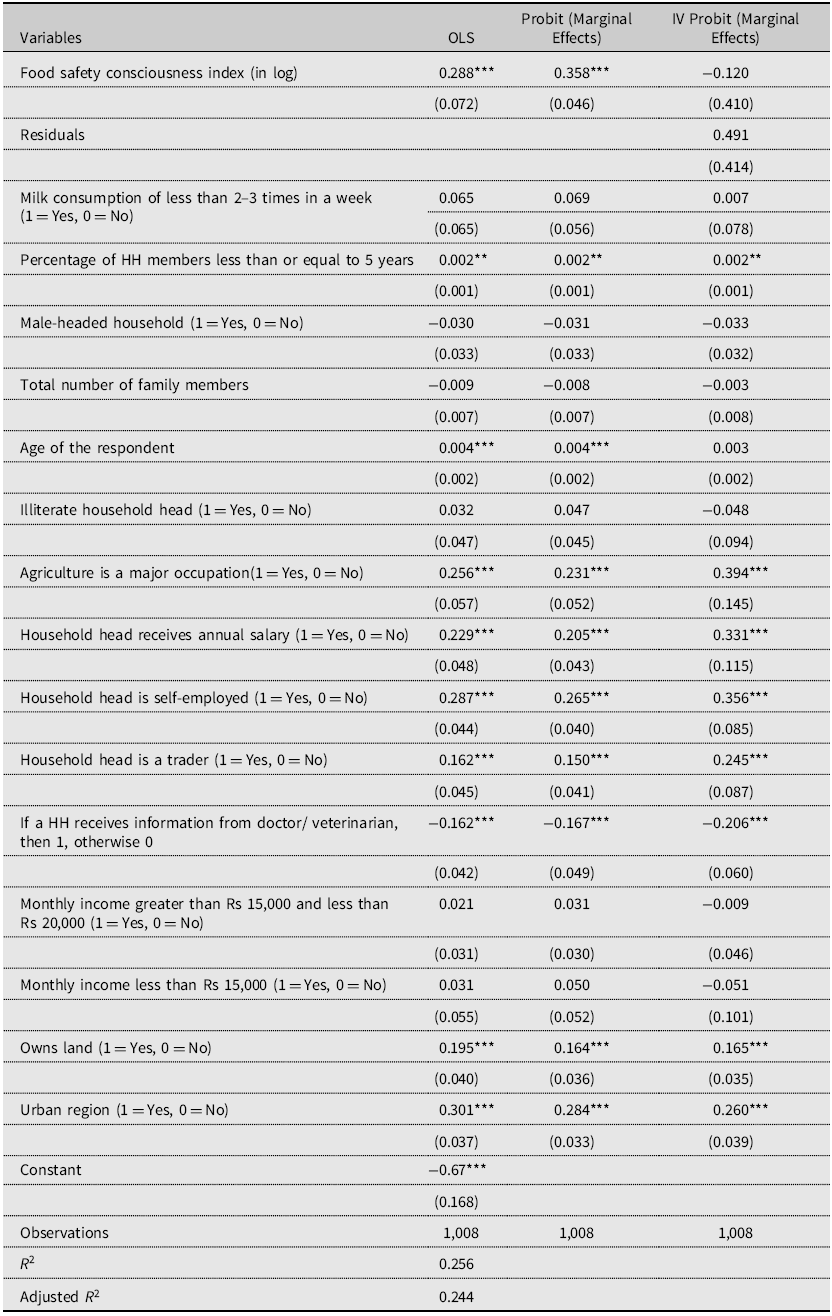
***P < 0.01, **P < 0.05, *P < 0.1.
Note: Robust standard errors in parentheses.
Table A4. Robustness test—Use of proxy indicator of food safety consciousness
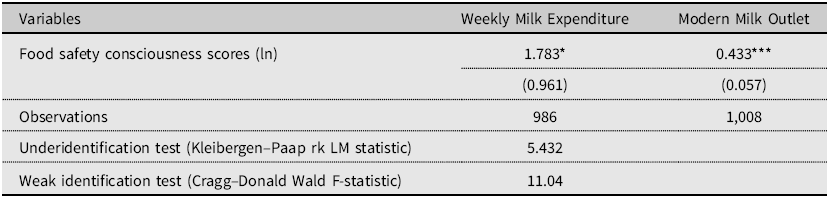
Table A5. Robustness test of results from weekly milk expenditure based on the subsample analysis
***P < 0.01, **P < 0.05, *P < 0.1.
Notes: Robust standard errors in parentheses. Authors’ calculations.


 Open access