


1. Introduction
In 2014, feeder cattle prices (750-pound steer) increased 37% ($59/hundredweight [cwt.]) in Tennessee from January to December, but feeder cattle prices proceeded to drop by 37% ($76/cwt.) from January 2015 to December 2015 (McKinley, Reference McKinley2016). Large feeder cattle price swings were also experienced at the national level in the futures market and other regional feeder cattle markets (McKinley, Reference McKinley2016). Like all agricultural commodities, managing cattle price risk is vital to remain profitable, but it is a complex challenge. Researchers have investigated the effectiveness of risk management tools such as futures and options, forward contracting, and livestock insurance policies to help producers make better risk management decisions (Burdine and Halich, Reference Burdine and Halich2014; Hall et al., Reference Hall, Knight, Coble, Baquet and Patrick2003; Hill, Reference Hill2015; Williams et al., Reference Williams, Saffert, Barnaby, Llewelyn and Langemeier2014), but producers have been reluctant to adopt these management tools (Hill, Reference Hill2015). The recent feeder cattle price volatility, however, has resulted in a growing interest in these tools by producers.
Hall et al. (Reference Hall, Knight, Coble, Baquet and Patrick2003) surveyed cattle producers in Nebraska and Texas to examine their perceptions of potential risk factors affecting farm income and found drought and cattle prices were the primary sources of risk to producers. They found that producers had limited confidence that price risk management tools, such as forward contracting and futures and option contracts, could be effective in reducing their price risk. This perception was explained by producers’ lack of understanding, training, and motivation to utilize the tools (Hall et al., Reference Hall, Knight, Coble, Baquet and Patrick2003). Understanding futures and option contract markets and effectively using them to manage price risk require a significant time investment that most producers do not have to invest (Fields and Gillespie, Reference Fields and Gillespie2008). Additionally, the lack of confidence in the effectiveness of price risk management tools could be caused by scale issues preventing small producers from using the available tools efficiently (Burdine and Halich, Reference Burdine and Halich2014). Futures and option contracts for feeder cattle trade in 50,000-pound increments (55 to 71 head of feeder cattle with weights ranging from 700 to 899 pounds); thus, a small producer may have to overhedge (selling fewer pounds of cattle than hedged through the contract), which could increase his or her risk or cause the producer to not utilize the tools (Griffith, Lacy, and McKissick, Reference Griffith, Lacy and McKissick2014).
Livestock risk protection (LRP) insurance is a possible alternative to the price risk management tools previously mentioned. LRP has the capability of addressing the scale issue and may be easier for producers to understand compared with futures and option contracts (Griffith, Reference Griffith2014). LRP was introduced to the cattle industry in 2003 as a single-peril price risk insurance program for feeder cattle and fed cattle that provides an indemnity payment if a regional cash price index (CME Feeder Cattle Index [CME FCI]) falls below an insured coverage price on the end date of the policy (Coelho, Mark, and Azzam, Reference Coelho, Mark and Azzam2008; U.S. Department of Agriculture, Risk Management Agency [USDA-RMA], 2010). LRP policies can be purchased by producers with various price coverage levels over various lengths of time, and producers’ premiums are a function of the coverage level and coverage length. A key difference between LRP and futures and option contracts is the flexibility in the quantity of cattle that can be covered at one time. For instance, a feeder cattle producer can purchase LRP on as few as one animal, whereas the smallest unit of purchase for futures and option contracts is 50,000 pounds of feeder cattle. Moreover, insurance is widely used by the general public, which means cattle industry participants may feel more comfortable using an insurance product rather than a derivative (i.e., futures and option contract) (Griffith, Reference Griffith2014).
A number of studies have compared the level of price protection provided by the use of LRP relative to other price risk management tools (Burdine and Halich, Reference Burdine and Halich2014; Coelho, Mark, and Azzam, Reference Coelho, Mark and Azzam2008; Feuz, Reference Fuez2009). Coelho, Mark, and Azzam (Reference Coelho, Mark and Azzam2008) compared LRP basis and futures basis for fed cattle and found LRP basis was less variable than futures basis, which can be advantageous for hedgers using LRP. Feuz (Reference Fuez2009) compared expected net returns and variability of net returns from using cash, futures, options, LRP, and Adjusted Gross Revenue-Lite pricing strategies in a cow-calf production system. Feuz (Reference Fuez2009) determined futures, put options, and LRP were effective tools at reducing variability of net returns, while also finding that LRP and put option contracts were equally as effective at reducing price risk. Burdine and Halich (Reference Burdine and Halich2014) evaluated net payouts (indemnities minus premiums) for producers in summer grazing programs (mid-April purchase dates) and winter backgrounding programs (mid-October purchase dates) given producer risk preference. Their simulation analysis showed net payouts increased with a decrease in feeder cattle prices, suggesting LRP was effective at providing a price floor. However, net payouts were negative unless the cattle price dropped more than $15/cwt. over the contract length.
Despite these studies indicating LRP can be effective at managing price risk for feeder cattle, Hill (Reference Hill2015) reported that only 7% of beef cattle producers across the United States were using LRP to manage price risk, which was fewer than futures (37%) and option (27%) contracts. A potential explanation of the lack of use of LRP by beef cattle producers might be the overwhelming number of available coverage lengths and levels. That is, producers may understand the LRP policy but are not sure what contract length and coverage level is best for managing price risk for their farm business. Each aforementioned study addressed integral questions and provided valuable information with regard to price risk management using LRP. However, previous studies have only investigated the effectiveness of a specific contract length, leaving producers questioning the best contract length and coverage level for their operation. Cattle producers from the cow-calf sector to the feedlot sector generally have a defined time frame when they will market cattle, which results in a defined time period to manage price risk. This time period can range from 2 weeks to 2 months, but the marketing time period is generally 2 to 4 weeks. Additionally, the marketing time period is generally known when the producer takes ownership of the animal. For instance, a spring calving cow-calf producer knows the weight class of calves that will be marketed in October and November. Similarly, a stocker producer purchasing calves in November knows the weight class of feeder cattle that will be marketed in April and May. Thus, the producer has the opportunity to purchase LRP during the time of cattle ownership to establish a price floor for the cattle on the intended marketing date.
The objective of this analysis was to determine the coverage length and level of a feeder cattle LRP contract that will maximize the probability of the LRP net price being higher than the CME FCI price (i.e., the price from which the LRP indemnity payment is based) given a marketing month. In other words, this analysis was conducted in order to determine the optimal coverage length and level for a producer wanting to purchase LRP in a particular marketing month. Results are informative for producers interested in using LRP and are helpful in assisting producers make improved risk management decisions.
2. Economic and Econometric Model
In general, producers know approximately when they will market their cattle, but feeder cattle producers rarely know in advance the exact day to market feeder cattle. LRP policies are indemnified at an exact date; thus, producers utilizing LRP select policies with a coverage length ending near the anticipated marketing month for their cattle. A partial budgeting approach can be used to determine the LRP net price received for feeder cattle by coverage length and level for each month. The LRP net price can be calculated by subtracting the subsidized cost of the LRP policy from the CME FCI price on the day the insurance policy date is terminated with the addition of any indemnity payment, which is expressed mathematically as
 $$\begin{equation}
N{P_m}(L,K) = A{P_m} + PM{T_m}(L,K) - {C_m}(L,K),
\end{equation}$$
$$\begin{equation}
N{P_m}(L,K) = A{P_m} + PM{T_m}(L,K) - {C_m}(L,K),
\end{equation}$$
where NPm (L,K) is the LRP net price ($/cwt.) for the m (m = 1,. . .,12) marketing month and is a function of the Lth coverage length (in weeks) and for the Kth coverage level (70%–100%); APm is the CME FCI price on the day the insurance policy is indemnified ($/cwt.); PMTm (L,K) is the indemnity payment ($/cwt.) received, which is a function of the coverage level and coverage period; and Cm (L,K) is the producer cost or premium ($/cwt.) of the LRP contract. The cost of LRP depends on the producers’ coverage level. Similar to a put option contract, a higher coverage level provides a higher price floor but has a higher premium.
The indemnity payment is positive if the coverage price is greater than the CME FCI price. The coverage price is found by multiplying the expected CME FCI price by the coverage level. The value of the indemnity payment is the difference between the CME FCI price and the coverage price. The indemnity payment is 0 if the purchased policy coverage price is less than or equal to the CME FCI price. The indemnity payment received was calculated as follows:
 $$\begin{equation}
\,PM{T_m}(L,K) = \left\{ {\begin{array}{@{}*{1}{c}@{}} {K^{*}E{P_m}(L) - A{P_m}\,\,{\it if}\,\,K^{*}E{P_m}(L) - A{P_m} > 0}\\ {0\,\,{\it if}\,\,K^{*}E{P_m}(L) - A{P_m} \le 0\,\,\,\,\,\,\,\,\,\,\,\,\,\,\,\,\,\,\,\,\,\,\,\,\,\,\,\,\,\,\,\,\,\,\,\,\,\,\,} \end{array}} \right.,
\end{equation}$$
$$\begin{equation}
\,PM{T_m}(L,K) = \left\{ {\begin{array}{@{}*{1}{c}@{}} {K^{*}E{P_m}(L) - A{P_m}\,\,{\it if}\,\,K^{*}E{P_m}(L) - A{P_m} > 0}\\ {0\,\,{\it if}\,\,K^{*}E{P_m}(L) - A{P_m} \le 0\,\,\,\,\,\,\,\,\,\,\,\,\,\,\,\,\,\,\,\,\,\,\,\,\,\,\,\,\,\,\,\,\,\,\,\,\,\,\,} \end{array}} \right.,
\end{equation}$$
where EPm (L) is the expected CME FCI price ($/cwt.) at the time of insurance purchase. Indemnity payments are calculated at the end of the LRP contract, which might be slightly different from when cattle are actually sold. Like a European put option contract, producers do not have the option of exercising the LRP contract during the coverage length like they would for an American put option contract. Therefore, producers have to wait until the expiration date to know if they will receive an indemnity payment.
Producers desiring to reduce price risk while receiving the highest feeder cattle net price would select an LRP coverage length and level that expires in the month they market cattle and that has the highest probability of the LRP net price being greater than the CME FCI price. For the LRP net price to exceed the CME FCI price, the CME FCI price must decline from the date when the LRP contract was purchased to the date when the contract is indemnified. However, the decline in the CME FCI price must be large enough that the indemnity payment (see equation 2) is greater than the cost of insurance. If the CME FCI price increases from the date when the LRP contract was purchased to the date when the contract is indemnified, the LRP net price will be less than the CME FCI price. Therefore, we are modeling the coverage level and length that would most likely provide producers risk protection. We estimate a probit model for each month to determine the coverage level and length that gives the producer the highest probability of the LRP net price being greater than the CME FCI price. Given that I* m represents the indicator variable for LRP net price being greater than the CME FCI price, the probit models are expressed as
 $$\begin{equation}
I_{m}^* = \alpha + {{{\bm \beta '}}_m}{{\bf x}} + {u_m},\,\,\,\,\,I = \left\{ {\begin{array}{@{}*{1}{c}@{}} {1\,\,\,\,{\it if}\,\,N{P_m}(L,K) - A{P_m} > 0\,}\\ {0\,\,{\it if}\,\,\,N{P_m}(L,K) - A{P_m} \le 0}\end{array}}\right.,
\end{equation}$$
$$\begin{equation}
I_{m}^* = \alpha + {{{\bm \beta '}}_m}{{\bf x}} + {u_m},\,\,\,\,\,I = \left\{ {\begin{array}{@{}*{1}{c}@{}} {1\,\,\,\,{\it if}\,\,N{P_m}(L,K) - A{P_m} > 0\,}\\ {0\,\,{\it if}\,\,\,N{P_m}(L,K) - A{P_m} \le 0}\end{array}}\right.,
\end{equation}$$
where x represents a matrix of indicator variables for coverage levels and lengths; β represents a vector of coefficients that describe the relationship between coverage level and length and the likelihood of the net price being greater than the actual price; and um is a standard normal cumulative distribution function (Greene, Reference Greene2011). Equation (3) was estimated using the LOGISTIC procedure in SAS (SAS Institute Inc., 2003). If the LRP net price was higher than the CME FCI price, the indemnity payment was positive and the LRP contract provided a price floor greater than the CME FCI price. If the LRP net price was not higher than the CME FCI price, the producer would have been better off not purchasing LRP.
The parameter estimates were used to predict the probability that the LRP net price was greater than the CME FCI price for each coverage length and level in each month, which is calculated by
 $$\begin{equation}
\Pr ({I_m} = 1) = \Phi [\alpha + {{{\bm \beta '}}_m}{{\bf x}}],
\end{equation}$$
$$\begin{equation}
\Pr ({I_m} = 1) = \Phi [\alpha + {{{\bm \beta '}}_m}{{\bf x}}],
\end{equation}$$
where Φ is a standard normal cumulative distribution. Because all of the independent variables were indicator variables, the coverage length and level of interest was equal to 1 and all other contract coverage lengths and levels were equal to 0. Contrast statements were used to determine if there were statistical differences in the probabilities across coverage levels and lengths. The McFadden's R 2 values were used to assess model fit.
3. Data
LRP coverage level and insurance period data were provided by the USDA-RMA (2016). Coverage levels ranged from 70% to 100% of the expected CME FCI price, and insurance periods offered through the program include 13, 17, 21, 26, 30, 34, 39, 43, 47, and 52 weeks. Daily LRP data for the state of Tennessee for feeder cattle weighing between 600 and 900 pounds were collected from July 2007 through August of 2016. The data collected included the effective date (date the insurance was offered), insurance period length, expected CME FCI price at purchase of the insurance, coverage price, coverage level, insurance cost per hundredweight, ending date of the insurance coverage, and actual CME FCI price at the end of the insurance period. The expected CME FCI price at purchase of insurance, coverage price, insurance cost per hundredweight, and actual CME FCI price at insurance expiration were converted into 2016 dollars using the seasonally adjusted annual gross domestic product implicit price deflator (Federal Reserve Bank of St. Louis, 2016).
Coverage levels under 85% were omitted from the analysis because this coverage level was less than 4% of the observations and 0.6% of policy offerings that received an indemnity payment. Additionally, coverage periods greater than 21 weeks were excluded from the analysis as they represent 1.7% of the total insurance policy offerings. Therefore, we were left with three coverage lengths of 13, 17, and 21 weeks. Burdine and Halich (Reference Burdine and Halich2014) only considered the 17-week LRP coverage length with the anticipated marketing of feeder cattle in only 2 months (April and October); thus, we extend the literature by analyzing additional contract lengths over all 12 months.
Daily LRP offerings were aggregated into marketing months based on the ending date of the insurance coverage. As previously mentioned, producers know approximately when they will market their cattle, which is why we analyze LRP by month. Specifically, we aggregated the data by the month the contract expired. Additionally, data were aggregated into five quantiles based on coverage levels: 1 = very low (85.00%–90.55%), 2 = low (90.56%–93.33%), 3 = moderate (93.34%–95.63%), 4 = high (95.64%–97.67%), and 5 = very high (97.68%–100.00%). Similarly, Burdine and Halich (Reference Burdine and Halich2014) classified coverage levels by low (90%–94%), medium (94%–97%), and high (97%–100%) because the discrete ranges simplify the results for use by producers and researchers. The five coverage levels and three contract lengths resulted in 15 independent variables representing the different coverage level and length combinations. For example, all LRP policies with a 13-week contract length, a coverage level from 97.68% to 100.00%, and that expired in the month of August were aggregated. This aggregation resulted in 15 independent variables.
4. Results and Discussion
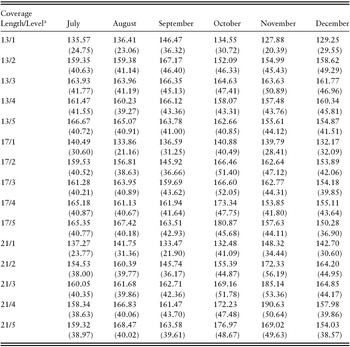
The average feeder cattle net price for each LRP contract length and coverage level from 2007 to 2016 are shown in Table 1 for marketing months January through June and in Table 2 for marketing months July through December in Tennessee. This is the first known research to present results for LRP contracts of multiple coverage levels and lengths for all 12 months. In Tennessee, presenting results for all 12 months is important because the calving season is widely dispersed and stocker producers market feeder cattle year-round. The CME FCI prices are shown for each feeder cattle contract length and coverage level from 2007 to 2016 in marketing months January through June (Table 3) and marketing months July through December (Table 4). In most months, the CME FCI price was higher than the LRP net price for many of the contract lengths and coverage levels. This suggests that a producer would lose money by purchasing LRP insurance in these months. However, purchasing LRP insurance guarantees the producer a price floor, thus reducing price variability. Given the likelihood of a lower price when purchasing insurance, the producer's decision to purchase LRP insurance depends on the producer's risk preference and the probability the LRP net price will exceed the CME FCI price.
Table 1. Average 600- to 900-Pound Feeder Cattle LRP Insurance Net Price ($/cwt.) by Coverage Level, Contract Length, and Months January–June in Tennessee, 2007–2016
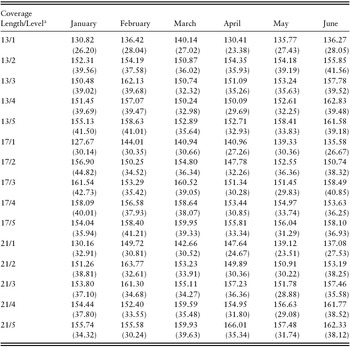
a Coverage length is 13, 17, 21 weeks; coverage levels are 1 = very low coverage level (85%–90.55%), 2 = low coverage level (90.56%–93.33%), 3 = moderate coverage level (93.34%–95.63%), 4 = high coverage level (95.64%–97.67%), and 5 = very high coverage level (97.68%–100.00%).
Notes: Standard deviation in parentheses. cwt., hundredweight; LRP, livestock risk protection.
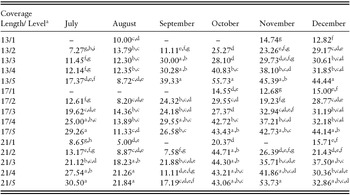
Table 2. Average 600- to 900-Pound Feeder Cattle LRP Insurance Net Price ($/cwt.) by Coverage Level, Contract Length, and Months July–December in Tennessee, 2007–2016
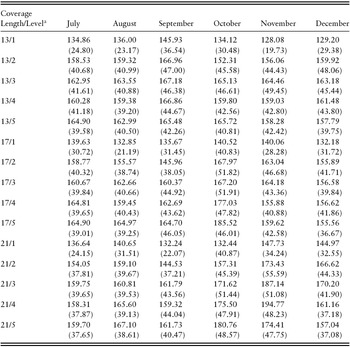
a Coverage length is 13, 17, 21 weeks; coverage levels are 1 = very low coverage level (85%–90.55%), 2 = low coverage level (90.56%–93.33%), 3 = moderate coverage level (93.34%–95.63%), 4 = high coverage level (95.64%–97.67%), and 5 = very high coverage level (97.68%–100.00%).
Notes: Standard deviation in parentheses. cwt., hundredweight; LRP, livestock risk protection.
Table 3. Average CME Feeder Cattle Index Price ($/cwt.) on Day LRP Contract Expires by Coverage Level, Contract Length, and Months January–June, 2007–2016
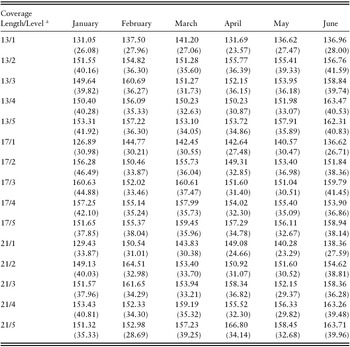
a Coverage length is 13, 17, 21 weeks; coverage levels are 1 = very low coverage level (85%–90.55%), 2 = low coverage level (90.56%–93.33%), 3 = moderate coverage level (93.34%–95.63%), 4 = high coverage level (95.64%–97.67%), and 5 = very high coverage level (97.68%–100.00%).
Notes: Standard deviation in parentheses. cwt., hundredweight; LRP, livestock risk protection.
Table 4. Average CME Feeder Cattle Index Price ($/cwt.) on Day LRP Contract Expires by Coverage Level, Contract Length, and Months July–December, 2007–2016
a Coverage length is 13, 17, 21 weeks; coverage levels are 1 = very low coverage level (85%–90.55%), 2 = low coverage level (90.56%–93.33%), 3 = moderate coverage level (93.34%–95.63%), 4 = high coverage level (95.64%–97.67%), and 5 = very high coverage level (97.68%–100.00%).
Notes: Standard deviation in parentheses. cwt., hundredweight; LRP, livestock risk protection.
Tables 5 and 6 display the estimated coefficients for the probit models that predict the likelihood that the LRP net price was greater than the CME FCI price for each coverage level and length for the marketing months of January through June and July through December, respectively. The contract length of 21 weeks and very high coverage level (5 = 97.68%–100%) was dropped to avoid multicollinearity issues, which we refer to as the base contract hereafter. Thus, probit models results are discussed relative to the base contract length and coverage level, which allows for comparison of different contract lengths and coverage levels assuming a producer is considering purchasing insurance. A positive coefficient indicates that the contract length and coverage level increased the likelihood of the LRP net price being higher than the CME FCI price relative to the base contract, whereas a negative coefficient indicates that the contract length and coverage level decreased the likelihood of the net price being higher than the CME FCI price relative to the base contract.
Table 5. Estimated Probit Model for the Probability That the LRP Net Price Is Greater Than the CME Feeder Cattle Index Price for January–June for LRP Insurance
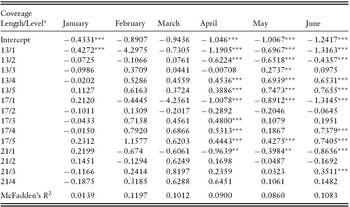
a Coverage length is 13, 17, 21 weeks; coverage levels are 1 = very low coverage level (85%–90.55%), 2 = low coverage level (90.56%–93.33%), 3 = moderate coverage level (93.34%–95.63%), 4 = high coverage level (95.64%–97.67%), and 5 = very high coverage level (97.68%–100.00%). The baseline contract in which other contracts are compared is 21 weeks and very high coverage level (97.68%–100.00%).
Notes: Asterisks (**, ***) represent significance at the 5% and 1% levels, respectively. LRP, livestock risk protection.
Table 6. Estimated Probit Model for the Probability That the LRP Net Price Is Greater Than the CME Feeder Cattle Index Price for July–December for LRP Insurance
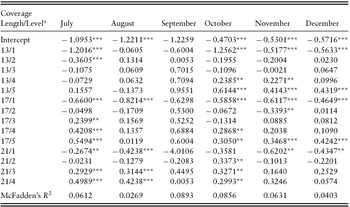
a Coverage length is 13, 17, 21 weeks; coverage levels are 1 = very low coverage level (85%–90.55%), 2 = low coverage level (90.56%–93.33%), 3 = moderate coverage level (93.34%–95.63%), 4 = high coverage level (95.64%–97.67%), and 5 = very high coverage level (97.68%–100.00%). The baseline contract in which other contracts are compared is 21 weeks and very high coverage level (97.68%–100.00%).
Notes: Asterisks (**, ***) represent significance at the 5% and 1% levels, respectively. LRP, livestock risk protection.
If a producer plans on marketing cattle in February, March, or September, we find no difference in the probabilities based on contract length and coverage level, suggesting that no contract length or coverage level combination was better or worse than the contract length of 21 weeks and very high coverage level (5 = 97.68%–100%). This might be explained by the reduced feeder cattle movement during those time periods, which may reduce price fluctuations. Even though calves are born 12 months out of the year, several months of the year have higher marketing of calves and feeder cattle than do other months of the year. February and March feeder cattle marketing tends to be low relative to other months because of wet and cold weather conditions, which inhibit cattle movement. Marketing of feeder cattle in September is relatively low because it is just prior to the fall flush of cattle.
The other 9 months of the year require a little more consideration. The 13-week contracts with coverage level 1 decreased the likelihood of the LRP net price being higher in marketing months January, April, May, June, July, October, November, and December relative to the base contract. Similarly, coverage level 2 with a length of 13 weeks decreased the likelihood of the LRP net price being higher in April, May, June, and July compared with the base contract. Alternatively, the 13-week contracts with coverage levels 4 and 5 increased the likelihood of having a higher net price in marketing months April, May, June, October, and November while the 13-week contract at level 5 also increased the likelihood in December compared with the base contract. Compared with the base contract, the LRP contracts that were 13 weeks and coverage level 3 increased the likelihood to receive a higher LRP net price in May.
Similarly, 17-week contracts with coverage level 1 decreased the likelihood of the LRP net price being higher than the CME FCI price in marketing months April, May, June, July, August, October, November, and December. The 17-week contracts with coverage level 2 also decreased the probability in November. However, the likelihood of having a higher net price increased with coverage level 3 in April and July; coverage level 4 in April, June, July, and October; and coverage level 5 in April, May, June, July, October, November, and December. The 21-week contracts with coverage level 1 decreased the likelihood of having a higher net price in marketing months April, May, June, July, August, November, and December. The probability of having a higher net price increased with coverage level 3 in June, July, August, and October; and coverage level 4 in July, August, and October.
Overall, the results indicate that the lowest level of coverage for all coverage lengths would decrease the likelihood of receiving a higher net price relative to the base for the marketing months of April, May, June, July, November, and December. The low coverage levels (85.00%–90.55%) were determined to be undesirable in most cases because prices would have to have a much steeper decline before the indemnity payment was greater than the cost. That is, the low coverage level might not provide producers with much price risk protection. On the opposite end of the spectrum, higher coverage levels were found to be fairly desirable if a producer chose to purchase insurance for the months of April, May, June, July, October, November, and December. The implication is that there is a lot of uncertainty in prices leading up to the major marketing time periods such as the spring months (April, May, and June) when fall-born calves are coming to market and the fall months (October, November, and December) when spring-born calves are being marketed. Similarly, the summer feeder cattle market (July and August) hinges greatly on feed and forage markets.
Tables 7 and 8 show the predicted probabilities of the LRP net price being greater than the CME FCI price from the probit models by contract length and level in marketing months January through June (Table 7) and marketing months July through December (Table 8). Predicted probabilities that were significantly different than 0 at the 0.05 level are presented. Only in marketing months of February, March, October, and November could a producer purchase an LRP contract that would result in a higher net price than the CME FCI price more than 50% of the time. This makes intuitive sense because the insurance company would likely be paying out more than it was receiving in premiums if a large number of the LRP contracts had a probability greater than 50% of the net price exceeding the CME FCI price. In October, the 13-week coverage length with coverage level 5 had a positive payout 56% of the time. In February, the 17-week contract with coverage level 5 paid a higher price than the CME FCI price approximately 61% of the time while the 21-week contract with coverage level 5 had a positive payout 53% and 54% of the time in marketing months March and November, respectively (Tables 7 and 8). If a producer was selling his or her feeder cattle in November, purchasing a 21-week LRP contract with a very high coverage level would be the preferred contract, meaning a producer would purchase the LRP contract in June.
Table 7. Predicted Probabilities (%) That the LRP Net Price Is Greater Than the CME Feeder Cattle Index Price for Each Coverage Level, Contract Length, and Months January–June for LRP Insurance
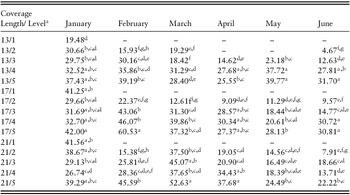
a Coverage length is 13, 17, 21 weeks; coverage levels are 1 = very low coverage level (85%–90.55%), 2 = low coverage level (90.56%–93.33%), 3 = moderate coverage level (93.34%–95.63%), 4 = high coverage level (95.64%–97.67%), and 5 = very high coverage level (97.68%–100.00%).
Notes: Probabilities with the same superscript letter are not statistically different than each other. Probability was not presented if the value was not statistically different than 0 at the 0.05 level. LRP, livestock risk protection.
Table 8. Predicted Probabilities (%) That the LRP Net Price Is Greater Than the CME Feeder Cattle Index Price for Each Coverage Level, Contract Length, and Months July–December for LRP Insurance
a Coverage length is 13, 17, 21 weeks; coverage levels are 1 = very low coverage level (85%–90.55%), 2 = low coverage level (90.56%–93.33%), 3 = moderate coverage level (93.34%–95.63%), 4 = high coverage level (95.64%–97.67%), and 5 = very high coverage level (97.68%–100.00%).
Notes: Probabilities with the same superscript letter are not statistically different than each other. Probability was not presented if the value was not statistically different than 0 at the 0.05 level. LRP, livestock risk protection.
Pairwise comparisons were made to test for statistical differences across the contract lengths and coverage levels in each month. For all of the months, several contract lengths and coverage levels provided producers with the same price protection. For example, four different contract lengths and coverage levels provided the same price protection in November, and nine different contract lengths and coverage levels provided the same price protection in January. Additionally, in each marketing month the contract length and coverage level that provided the highest price protection varied. Thus, there was no consistent preferred contract length and coverage level for producers to use, making the decision of selecting the optimal LRP contract length and coverage difficult. Burdine and Halich (Reference Burdine and Halich2014) also found that effectiveness of LRP insurance protecting again downside price risk depended on the month the LRP contract was indemnified. This result might explain why feeder cattle producers in Tennessee and across the United States have been hesitant to adopt LRP for managing price risk.
Moreover, in most months, a producer would receive a higher price by not purchasing an LRP contract. Burdine and Halich (Reference Burdine and Halich2014) found that the net payout of an LRP contract was positive when expected losses were greater than $15/cwt. If the price did not drop more than $15/cwt. during the duration of the contract, the net payout was negative, which indicates a producer might be better off not purchasing the LRP contract. This result might also suggest that producers in Tennessee and the United States might not be purchasing LRP because they do not expect the price to drop that drastically during the time period of the contract length. Put options allow the producers to lock in prices in a longer run, which might be more effective and explain why producers prefer put options over LRP contracts to protect against price risk. However, a put option is not a viable alternative to a small producer with less than 50,000 pounds of feeder cattle.
There is a cost associated with using price risk management. In the long run, if price risk management was used continuously, the expected return would likely be less than the expected return without price risk management. However, there are times when the use of price risk management may be appropriate or necessary. Producers carrying heavy debt loads or producers in need of extended credit may be required to use a method of price protection to reduce the risk carried by the lender. Thus, LRP may be an appropriate tool.
Table 9 integrates the information from Tables 5 and 6 with the information from Tables 7 and 8 to produce an efficient set so a producer in need of a price risk management tool can determine the most lucrative insurance coverage alternatives. As an example, producers purchasing insurance for a June marketing time frame would most likely benefit from the coverage level ranging from 95.64% to 100.00% for the 13- and 17-week coverage lengths, which means insurance would be purchased in February or March. Similarly, a producer intending to market cattle in December would most likely benefit from the 13- and 17-week coverage lengths at the 97.68% to 100% coverage level if intending to purchase insurance.
Table 9. LRP Insurance Coverage Levels and Lengths Returning the Highest Net Price Given LRP Insurance Is PurchasedFootnote a
a If a producer intends to purchase livestock risk protection (LRP) insurance, then the efficient set of coverage lengths and coverage levels expected to return the highest net price based on the probability that the LRP net price exceeds the CME Feeder Cattle Index price and based on the probability the LRP net price exceeds a coverage level of 5 and coverage length of 21 is denoted by “X.”
b Coverage length is 13, 17, 21 weeks; coverage levels are 1 = very low coverage level (85%–90.55%), 2 = low coverage level (90.56%–93.33%), 3 = moderate coverage level (93.34%–95.63%), 4 = high coverage level (95.64%–97.67%), and 5 = very high coverage level (97.68%–100.00%).
The production system in which a producer operates will likely drive the decision of the coverage length and coverage level utilized throughout different months of the year. For example, cow-calf producers who precondition calves may utilize one coverage level and coverage length for a sell in a given month, whereas a stocker producer selling in the same month may utilize a different coverage level and coverage length. There are several production systems that could influence the coverage level and coverage length decision including cow-calf with preconditioning, year-round stocker, winter backgrounder, spring and summer stocker, and several others. These production systems will influence the decision-making process as it relates to coverage length and coverage level.
5. Conclusion
Feeder cattle prices have recently experienced high volatility, resulting in producer interest and concern in managing price risk. LRP is a possible risk management tool available to producers that could have some advantages; however, producers have been reluctant to adopt LRP for various reasons (Hill, Reference Hill2015). The objective of this study was to determine the coverage level and length of an LRP feeder cattle contract that will maximize the probability of the LRP net price being higher than the CME FCI price by month. We evaluate several LRP coverage levels and lengths to determine the contract that a producer would prefer in different marketing months.
Daily LRP offerings data were obtained for 600- to 900-pound feeder cattle in Tennessee from 2007 through 2016. We estimated a probit model for each marketing month to predict the probability that the different LRP contract coverage lengths and levels would have a higher net price than the CME FCI price (the price in which LRP indemnities are based). Results are important for improving producers’ education of LRP and in assisting them to make better risk management decisions. Additionally, this is a unique contribution to the literature on LRP by exploring the effectiveness of a wide range of contract lengths and coverage levels for each marketing month.
We found that in four marketing months a producer could purchase an LRP contract that would result in a higher net price than the CME FCI price more than 50% of the time. The CME FCI prices were more likely to be higher than the LRP net price in the vast majority of the contract lengths and coverage levels. Several contract lengths and coverage levels provided producers with the same price protection in a given marketing month, and in each marketing month, there was no consistent preferred contract length and coverage level for producers to use, making the decision of selecting the optimal LRP contract length and coverage confusing. These results might explain why feeder cattle producers in Tennessee and across the United States have been hesitant to adopt LRP for managing price risk.
The overwhelming number of alternatives related to coverage levels and coverage lengths can inhibit decision making and thus the use of the insurance product. Even with data analysis, the efficient set of alternatives can be rather large (six in January) which increases the complexity of decision making. Future research needs to explore how producers’ risk preferences can affect the preferred contract and producers’ willingness to use LRP, as well as identify barriers to use by producers. The results of this research can assist researchers and industry in designing more effective insurance policy tools for livestock producers and can aid extension educators with addressing producers’ LRP concerns.


 Open access