


1. Introduction
Niche food markets have been expanding in response to changes in consumer demand since 2000. With the rise of popular media about food production, like The Omnivore's Dilemma (Pollan, Reference Pollan2006), consumers have become more concerned with the methods of food production and the environmental repercussions of food choices, most commonly noted as credence attributes (Wirth, Stanton, and Wiley, Reference Wirth, Stanton and Wiley2011). Whereas search attributes such as color and ripeness are related to outward appearance, credence attributes, for example whether the product was organically produced, cannot be verified by the consumer from the outward appearance and typically require third-party certification (McKendree et al., Reference McKendree, Widmar, Ortega and Foster2013; Moser, Raffelli, and Thilmany-McFadden, Reference Moser, Raffelli and Thilmany-McFadden2011; Wirth, Stanton, and Wiley, Reference Wirth, Stanton and Wiley2011). Credence goods are most often private goods that sometimes have public good characteristics (Lusk, Nilsson, and Foster, Reference Lusk, Nilsson and Foster2007). Studies have found that consumers care about credence attributes when it comes to food purchases, and many cite environmental reasons as a primary driver of food purchase decisions (e.g., Carpio and Isengildina-Massa, Reference Carpio and Isengildina-Massa2009; Lusk and Briggeman, Reference Lusk and Briggeman2009; Moser, Raffelli, and Thilmany-McFadden, Reference Moser, Raffelli and Thilmany-McFadden2011; Onken, Bernard, and Pesek, Reference Onken, Bernard and Pesek2011; Thilmany, Bond, and Bond, Reference Thilmany, Bond and Bond2008; Tobler, Visschers, and Siegrist, Reference Tobler, Visschers and Siegrist2011).
The niche food markets most commonly associated with environmental benefits are organic, local, and sustainable foods (e.g., Adams and Salois, Reference Adams and Salois2010; Moser, Raffelli, and Thilmany-McFadden, Reference Moser, Raffelli and Thilmany-McFadden2011; Tonsor and Shupp, Reference Tonsor and Shupp2009; Zepeda and Leviten-Reid, Reference Zepeda and Leviten-Reid2004). It may be reasonable to assume that consumers concerned with the environmental aspects of food products may want both organic and locally produced food products. However, the feasibility of organic production varies across the nation. For example, it is common knowledge that it is difficult for specialty crop producers in the southeastern United States to achieve economic yields necessary for commercial production of organic fruits and vegetables for several reasons including weather, pests, and financial challenges.Footnote 1 The climate in the Southeast, although ideal for vegetable production, is also ideal for pests, making organic production especially challenging in the region. Although not all areas within the Southeast require the same inputs, a review of enterprise budgets for organic vegetables shows that production of organic products is much more expensive relative to conventional production practice. For example, a comparison of the average costs of organic tomato production to average costs of conventionally grown tomatoes in the state of Georgia shows an increase in costs of $1,621.19 per acre (University of Georgia, 2009a, 2009b).
Studies have shown consumers are willing to pay price premiums for organic production, and this is partially because of the perceived environmental benefits of these products (e.g., Onozaka and Thilmany McFadden, Reference Onozaka and Thilmany McFadden2011), although this effect may be influenced by the number of copresented labels (Heng, Peterson, and Li, Reference Heng, Peterson and Li2016). So although it may not be feasible for southeastern producers to switch from conventional production practices to certified organic production on a large scale, marginal changes in specific production practices that would be considered environmentally friendly could help producers to capture some of the price premiums in these niche markets and potentially increase profits.
The objective of this study is therefore to estimate consumers’ willingness to pay (WTP) for various environmental production attributes pertaining to vegetable production. We estimate these values in the context of fresh tomato purchases using a choice experiment survey. In a world with diverse consumer preferences, it can be challenging for producers to determine marketing strategies and production practices that maximize their profits while meeting consumer demand for locally grown, perishable products. For producers who are looking for ways to increase profitability and differentiate their products, knowing consumer preferences and whether they are willing to pay price premiums for preferred products could contribute positive returns to their bottom line.
Several studies have found that consumers consider production claims such as “local,” “organic,” or “sustainable” when purchasing food items and that there is the potential for capturing price premiums through label or certification claims (e.g., Dentoni et al., Reference Dentoni, Tonsor, Calantone and Peterson2009; Dimitri and Greene, Reference Dimitri and Greene2002; Onozaka and Thilmany McFadden, Reference Onozaka and Thilmany McFadden2011; Sackett, Shupp, and Tonsor, Reference Sackett, Shupp and Tonsor2016; Zepeda and Leviten-Reid, Reference Zepeda and Leviten-Reid2004). Others have found that consumers are willing to pay more for products perceived to have positive effects on the environment specifically (e.g., Straub and Thomassin, Reference Straub and Thomassin2006; Thilmany, Bond, and Bond, Reference Thilmany, Bond and Bond2008). However, existing literature on environmental impacts of food choices has so far generally been limited to consumers’ general concern for the environment. For example, Thilmany, Bond, and Bond (Reference Thilmany, Bond and Bond2008) found that consumers who believed there was an “environmental benefit” were willing to pay more for local melons. Bougherara, Grolleau, and Mzoughi (Reference Bougherara, Grolleau and Mzoughi2009) found that “environmental considerations” played a role in consumers deciding whether to participate in a community-supported agricultural program. Straub and Thomassin (Reference Straub and Thomassin2006) found that consumers are willing to pay more for tomatoes produced using “environmental management systems.” Our study examines specific environmental impacts including how far the product traveled, the amount of nonrecycled water used to grow the product, whether the product was grown using petroleum-based fertilizer, and the amount of pesticide residue on the product.
We find that indeed respondents are willing to pay more for positive environmental attributes of tomatoes even when the tomatoes are not organic. For example, respondents are willing to pay $0.38 per pound more for tomatoes produced within 50 miles of the grocery store where they are purchased and $0.51 more per pound for tomatoes produced without petroleum-based fertilizers and purchased at a farmers’ market. They are also willing to pay more for tomatoes grown using less water from surface and underground water sources and for tomatoes with less pesticide residue.
Our study focuses on specific attributes that are commonly associated with environmental benefits during the production and harvesting process of fresh tomato production and on production processes over which producers are more likely to have some flexibility. Our findings could be useful to producers when determining whether they should adjust production practices to potentially capture additional profits in niche markets. Although other studies have estimated potential price premiums producers might expect to gain from all-or-nothing conversions from conventional to organic production, we believe our study is the first to examine a relatively large set of potential marginal production changes, which might be more feasible for a larger population of producers.
2. Theoretical Model
We conduct a hypothetical choice experiment survey in which, for each choice question, respondents are presented with three alternatives from which to choose: a grocery-store tomato or a farmers’ market tomato, which differ according to their production attributes, and an option to purchase neither presented tomato. Following standard choice experiment theory, we assume a random utility framework (McFadden, Reference McFadden and Zarembka1974) in which it is assumed a consumer would indicate that she would purchase a presented tomato if and only if the utility derived from its purchase is greater than the utility derived from purchasing the other tomato or from purchasing neither tomato. We assume a linear-in-parameters indirect utility function with arguments that include a vector of alternative-specific characteristics besides price ( z ij ), a vector of respondent-specific characteristics ( x i ), and price (pij ):
 $$\begin{equation}
{u_{ij}} = {\beta _{j0}} + {\beta _p}{p_{ij}} + {\bm{\beta }}_{jx}^{\rm{{\prime}}}{{\bm{x}}_i} + {\bm{\beta }}_{ijz}^{\rm{{\prime}}}{{\bm{z}}_{ij}} + {\varepsilon _{ij}},
\end{equation}$$
$$\begin{equation}
{u_{ij}} = {\beta _{j0}} + {\beta _p}{p_{ij}} + {\bm{\beta }}_{jx}^{\rm{{\prime}}}{{\bm{x}}_i} + {\bm{\beta }}_{ijz}^{\rm{{\prime}}}{{\bm{z}}_{ij}} + {\varepsilon _{ij}},
\end{equation}$$
where j indicates one of the three alternatives (a grocery store tomato, a farmers’ market tomato, or neither) presented to the ith individual in a given choice question, betas are dimension-appropriate vectors of parameters to be estimated, and ε ij is an unknown disturbance term. Note that this is a “labeled” design in which one of the two tomatoes is either a “grocery store” tomato or a “farmers’ market” tomato. The parameters on the constant (βj 0) and on product attributes and respondent-specific variables are free to vary by alternative. Also, the parameters on the alternative-specific characteristics are free to vary by individual (i.e., they are “random parameters”). Assuming that the disturbance term is independently and identically distributed with type 1 extreme value Gumbel distribution, the probability that an individual chooses alternative j is (Greene, Reference Greene2012) as follows:
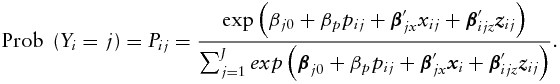 $$\begin{equation}
{\rm{Prob}}\ \left( {{Y_i} = j} \right) = {P_{ij}} = \frac{{{\rm{exp}}\left( {{\beta _{j0}} + {\beta _p}{p_{ij}} + {\bm{\beta }}_{jx}^{\prime}{x_{ij}} + {\bm{\beta }}_{ijz}^{\prime}{{\bm{z}}_{ij}}} \right)}}{{\mathop \sum \nolimits_{j = 1}^J exp\left( {{{\bm{\beta }}_{j0}} + {\beta _p}{p_{ij}} + {\bm{\beta }}_{jx}^{\prime}{{\bm{x}}_i} + {\bm{\beta }}_{ijz}^{\prime}{{\bm{z}}_{ij}}} \right)}}.
\end{equation}$$
$$\begin{equation}
{\rm{Prob}}\ \left( {{Y_i} = j} \right) = {P_{ij}} = \frac{{{\rm{exp}}\left( {{\beta _{j0}} + {\beta _p}{p_{ij}} + {\bm{\beta }}_{jx}^{\prime}{x_{ij}} + {\bm{\beta }}_{ijz}^{\prime}{{\bm{z}}_{ij}}} \right)}}{{\mathop \sum \nolimits_{j = 1}^J exp\left( {{{\bm{\beta }}_{j0}} + {\beta _p}{p_{ij}} + {\bm{\beta }}_{jx}^{\prime}{{\bm{x}}_i} + {\bm{\beta }}_{ijz}^{\prime}{{\bm{z}}_{ij}}} \right)}}.
\end{equation}$$
Because the alternative-specific parameters are free to vary by individual, the parameters are estimated in a random-parameters logit model (Train, Reference Train2009).
Once the parameters have been estimated, WTP in terms of a higher price for a change in production attribute zijm (that is, one of all the attributes in vector zij ) can be calculated with the following formula:Footnote 2
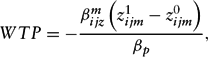 $$\begin{equation}
WTP = - \frac{{\beta _{ijz}^m\left( {z_{ijm}^1 - z_{ijm}^0} \right)}}{{{\beta _p}}},
\end{equation}$$
$$\begin{equation}
WTP = - \frac{{\beta _{ijz}^m\left( {z_{ijm}^1 - z_{ijm}^0} \right)}}{{{\beta _p}}},
\end{equation}$$
where the superscripts 1 and 0 indicate the superior and inferior levels of the attribute, respectively. Confidence intervals on WTP can be calculated using an adjustment to the standard Krinsky and Robb procedure (see Haab and McConnell, Reference Haab and McConell2002), in which, after the model parameters are simulated (we used 5,000 pseudorandom draws from the sampling distribution), additional random draws (we used 200 Halton draws) are taken for each of the random parameters from their respective distributions using the distributional parameters simulated in the first stage (see Bliemer and Rose, Reference Bliemer and Rose2013; Hensher and Greene, Reference Hensher and Greene2003). Marginal effects (Greene, Reference Greene2012) for alternative-specific variables are calculated using a similar Krinsky-Robb procedure, but, because of memory limitations attributable to our data size,Footnote 3 the number of simulated draws was reduced to 276 pseudorandom draws from the sampling distribution and 11 Halton draws for each random parameter from its distribution.
3. Methods and Data Collection
3.1. Survey Design
In a choice experiment survey, respondents are presented with two or more alternatives in a “choice set” and are asked to choose their most preferred alternative. The alternatives vary by levels of various attributes, which are specified by the researcher according to a research design. In our survey, respondents were presented with three alternatives in each of four choice sets with which they were presented. The alternatives were a farmers’ market tomato with a specific set of attributes, a grocery store tomato with a specific set of attributes, and the option to purchase neither tomato. The attributes across which the presented tomatoes differ were the distance the tomato traveled from its place of production to its place of consumption, the amount of groundwater or surface waterFootnote 4 used to grow the tomato, whether the tomato was grown using petroleum-based fertilizers, the amount of pesticide residue remaining on the tomato, and price. A complete listing of the attributes and their levels is provided in Table 1, and an example choice question is provided in Figure 1. The design was created using the NGene choice experiment design software with the goal of maximizing D-efficiency for a labeled design (ChoiceMetrics, 2012).Footnote 5
Table 1. Choice Experiment Attribute Levels
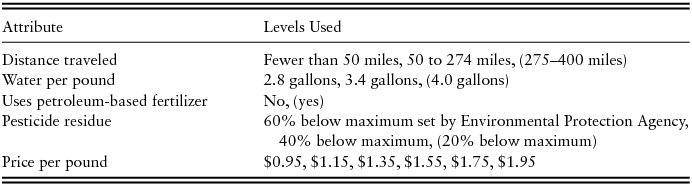
Note: Levels in parentheses serve as omitted base levels in the regression.
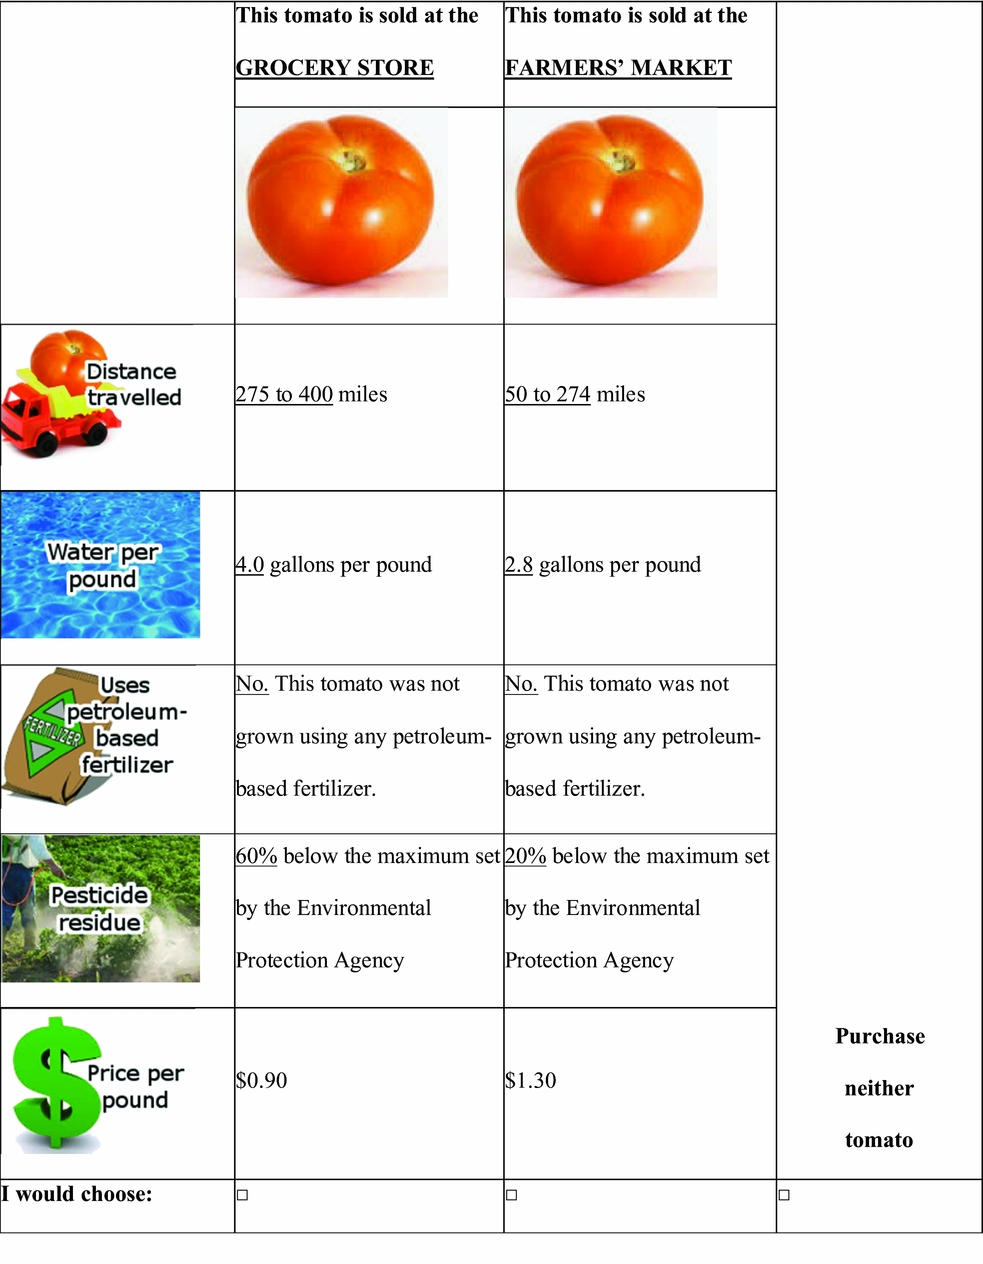
Figure 1. Example Choice Question
The specific environmental production attributes used in our study were chosen through a review of previous literature and from the feedback of an institutional review board–approved focus group held in Memphis, Tennessee, during May 2013. For example, Onozaka and Thilmany McFadden (Reference Onozaka and Thilmany McFadden2011) find that consumers are willing to pay for food products with a lower carbon footprint, which is related to the food's travel distance and whether it was grown with petroleum-based fertilizer. Biao et al. (Reference Biao, Wenhua, Gaodi and Yu2010) find that consumers care about conservation of water from aquifers. Zepeda and Deal (Reference Zepeda and Deal2009) find that some consumers who purchase organic foods do so to limit exposure to pesticide residues.Footnote 6 In our focus group, concerns about the types of fertilizers (organic vs. petroleum-based) used in production and the amount of pesticide residue on the product were consistently expressed as some of the participants’ most important concerns.
Choosing how to measure the attributes and their appropriate levels is a challenge because, perhaps with the exception of miles the food has traveled,Footnote 7 there is no guiding literature to help determine which levels would be most relevant to consumers’ preferences. We therefore chose relevant attribute levels based on feedback from the focus group and from best management practices outlined in the Mississippi State 2013 vegetable planning budget publication (Mississippi State University, 2012).Footnote 8
In addition to providing feedback on appropriate production attributes, measurement, and levels, the focus group participants also critiqued a draft version of the survey instrument for clarity, length, and construct validity.
Given that respondent choices are hypothetical, we implemented a number of measures to make the choice situation more salient for respondents and to attempt to encourage as realistic responses as possible. First, respondents were asked to imagine they were at a location where there was a farmers’ market immediately next to a grocery store, and we provided a photo of such a scene. The aim was to make the choice between the two types of tomato as vivid and convenient as posed in the question. Second, respondents were told that the survey results would be shared with farmers (which in fact it was through extension workshops) who could potentially use the information to adjust future production practices, and furthermore, that if the information they receive is inaccurate, their decisions could potentially harm themselves or their consumers. The aim with this statement was to increase the perceived consequentiality of responses, which generally improves (although does not guarantee in a multinomial choice setting) incentives for truthful preference revelation (Carson and Groves, Reference Carson and Groves2007). Relatedly, we asked a follow-up question about how likely the respondent believed the results of the survey would be used by farmers to make changes to their production decisions. Ninety-five percent of respondents believed there was at least a small chance that farmers would do so, with 35% believing it to be likely or very likely. Finally, respondents were asked, before answering the choice questions, whether they felt they could promise us to answer the questions as truthfully as possible. This is a form of “honesty priming,” which is a relatively new approach to inducing truthful preference revelation (see de-Magistris, Gracia, and Nayga, Reference de-Magistris, Gracia and Nayga2013). More than 99% of respondents said yes, they were able to make such a promise.Footnote 9
3.2. Data Collection
Data for the study were collected using an online consumer survey in July and August 2013 hosted by Research Now. Research Now was contracted to program, host, and implement the online survey and to recruit survey respondents. The sample included residents of Mississippi, Alabama, Georgia, Louisiana, Texas, and Florida. Research Now analysts selected a demographically representative sample, relative to state census data, of respondents aged 18 or older. Demographics of the sample are compared to those of their respective states in Table 2. The comparison indicates that the sample is fairly representative, with the exception of age, likely because of the requirement that each survey respondent be over the age of 18 and also be the primary shopper of the household. Respondents were also screened to assure that they purchase fresh tomatoes at least once per month. The number of sample observations for each state is proportional to the total population of the state itself compared to the total population of the other states. For example, the population of Alabama is approximately one-fifth the population of Texas, and in our sample, the number of respondents from Alabama is approximately one-fifth the number of respondents from Texas.
Table 2. Sample and Population Demographics by State
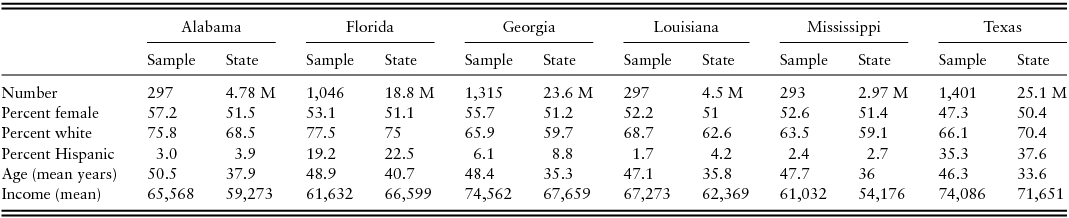
Note: M, million.
Source: U.S. Census Bureau (http://factfinder2.census.gov/faces/nav/jsf/pages/index.xhtml), Selected Economic Characteristics, Demographic and Housing Estimates, 2010, both recorded in the American Community Survey 1-year estimates (U.S. Census Bureau, 2010).
The survey was pretested with approximately 400 respondents to ensure usability and consumer responsiveness. The survey instruments were released during July, a time of year when fresh tomato production peaks in the study region and when tomatoes are available in both farmers’ markets and grocery stores. Four thousand seven hundred seven respondents completed the final survey with a total of 18,596 usable choice observations, after removing observations with missing variables. Because of the nature of the contract with Research Now, a response rate cannot be calculated due to our desire to obtain a minimum number of responses from each state in the study, a common drawback associated with the use of these types of marketing research services. Table 3 displays the descriptive statistics of those variables used in the model.
Table 3. Variable Definitions and Descriptive Statistics
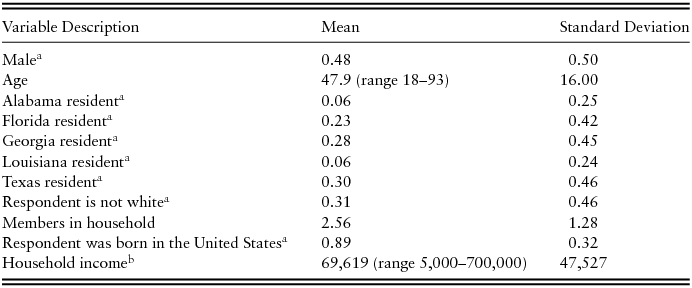
a Binary variables equal 1 if statement applies to respondent, and 0 otherwise. N = 4,649 respondents.
b Income was elicited in categories and converted to dollars using category midpoints. Mississippi is the omitted base state.
4. Results
A mixed logit (random-parameters logit) model was estimated using Stata software (version 13.0, 2013). Initially, all attribute parameters were allowed to be random—and we examined models with both normal and lognormal distributions for the random parameters—but only two attribute level parameters, that the tomato was grown with 3.4 gallons of water per pound and that the tomato was produced within 50 miles of where it was sold, were consistently random, and only for farmers’ market tomatoes (not grocery store tomatoes). The estimation results for the final model with these two parameters specified as random normal are presented in Table 4. Because each respondent answers four choice questions, cluster-robust variance estimators were used to take into account that the different individuals are independent from one another, but that the choices made by one individual may not be independent. The marginal effects, which show the change in the probability that a respondent will choose a particular tomato given a change in the relevant variable, are also shown in Table 4 and help our interpretation of the results as described subsequently. Note that the model included separate attribute parameters indicating the type of purchase location (farmers’ markets and grocery stores).
Table 4. Random Parameters Logit Regression Results
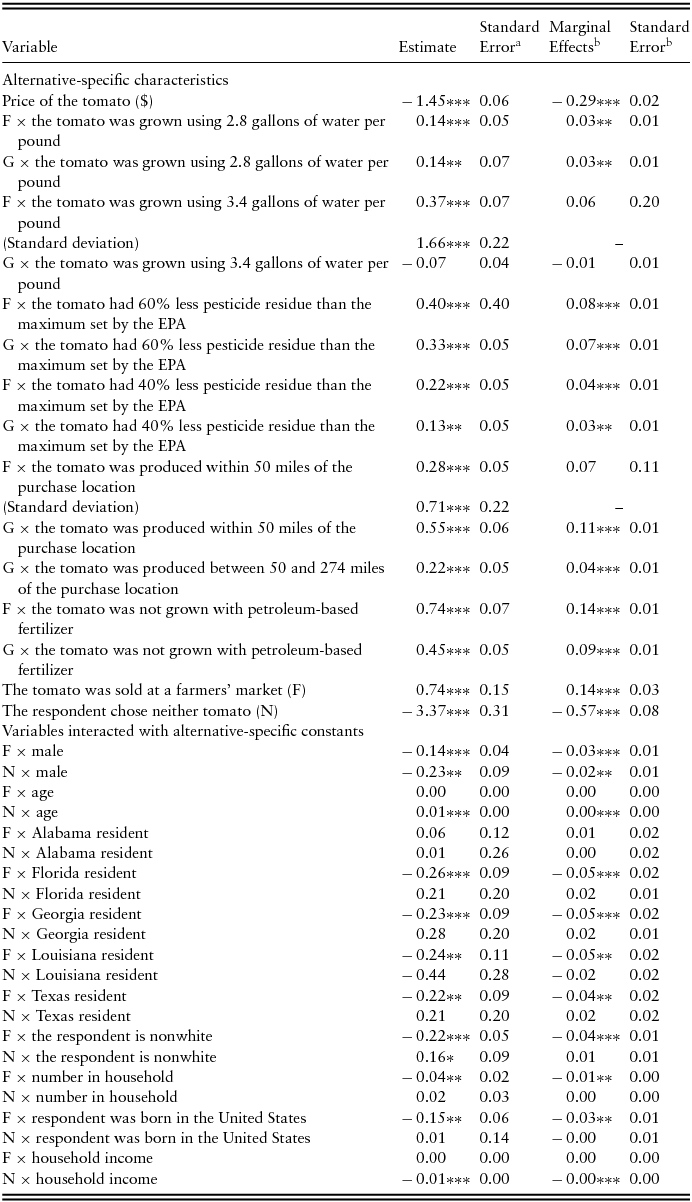
a Cluster-robust standard errors are presented, based on 18,596 choice observations (4,649 respondents).
b Krinsky-Robb simulation with 276 pseudorandom draws for each model parameter and 11 Halton draws for each random parameter. Simulated log likelihood = −15,642.38. Wald chi-square (38) = 2,513***.
Notes: Asterisks (*, **, ***) indicate significance at the 10%, 5%, and 1% levels, respectively. “F” is farmers’ market tomato; “G” is grocery store tomato; and “N” is neither. EPA, Environmental Protection Agency.
Each estimate of a tomato attribute parameter, besides price, is interpreted relative to an omitted base level of the attribute. A positive (negative) sign on an estimated attribute parameter indicates that a respondent is more (less) likely to choose that alternative given the specified attribute level compared to an equivalent alternative with the omitted level of the attribute. For example, we find that respondents are more likely to choose a tomato that used 2.8 gallons of water per pound compared with a tomato that used an average of 4 gallons of water per acre, the omitted base level, because the parameter estimate is positive and significant for either market. Additionally, the parameter estimate and marginal effects are identical for tomatoes sold via farmers’ markets or grocery stores.
Parameters that are randomly distributed in the population require a slightly more careful interpretation, which is aided by the significance of their marginal effects. For example, there are two parameters on a tomato grown using 3.4 gallons of water per pound and sold at a farmers’ market. The first is an estimate of its mean within the population, here, 0.37, which is significant, indicating that this mean significantly differs from zero. However, because the parameter is random, as indicated by the significance of its standard deviation, one cannot necessarily conclude that the attribute level affects respondent decisions in general; indeed, its marginal effect is not significant. Hence, although the mean of the parameter within the population significantly differs from zero, the effect of the variable on the probability of one's choice does not significantly differ from zero in general (although it may for some people in the population).
Continuing, we see that respondents are more likely to choose a tomato that has 60% or 40% less pesticide residue than one with 20% less pesticide residue (the omitted base level) than the maximum allowable residue allowed by the Environmental Protection Agency (EPA) regardless of purchase location. Respondents are more likely to choose a grocery store tomato that was produced within 50 miles of the purchase location or between 50 and 274 miles from the production location than a tomato that was produced more than 400 miles from the point of purchase (the omitted base level) from the production location. However, for a farmers’ market tomato grown within 50 miles, we find that while the parameter is also significant, there is no effect on purchase behavior as the parameter is random in the population.Footnote 10 Respondents are more likely to purchase a tomato that was not grown with petroleum-based fertilizer compared with a tomato that was produced with petroleum-based fertilizer.
The negative and significant parameter estimate on the price variable indicates that, as expected, respondents are less likely to purchase a tomato as the price of the tomato increases, all else being equal. Overall, we therefore find strong evidence that our survey respondents are more likely to choose both farmers’ market and grocery store tomatoes grown with the improved environmental production attributes chosen for this study. We also see from the marginal effect on F that if the tomato is sold at a farmers’ market, respondents are more likely to purchase it than if it is sold at a traditional grocery store.
Parameters on respondent-specific variables enter the model through their interactions with the alternative-specific constants (one each for the farmers’ market tomato and neither tomato, with the grocery store alternative acting as the omitted base) and their estimates are displayed in the bottom half of the table. These can be used to identify individuals who are more likely to purchase tomatoes from a farmers’ market than from a grocery store. This information is useful because one of the ways specialty crop farmers who alter their production practices in order to earn premium prices are likely to inform the consumerFootnote 11 is through direct interactions with the consumer, for example, at a farmers’ market; this approach is more likely than notifying consumers, say, through packaging, as information like water conservation practices and fertilizer and pesticide use are not currently included on food labels in stores.
We see that males are less likely to purchase a farmers’ market tomato than a grocery store tomato, all else being equal. Older consumers are more likely to purchase neither tomato. Consumers who identify as white and who were not born in the United States are more likely to purchase a farmers’ market tomato, and respondents not born in the United States are also more likely to purchase a farmers’ market tomato than a grocery store tomato. One of the advantages of our large data set is that there are enough observations to examine how preferences for farmers’ market tomatoes vary by state of residence. The omitted state of respondent residence is Mississippi, and the table shows that residents of Florida, Georgia, Louisiana, and Texas are all less likely to purchase a tomato from a farmers’ market than residents of Mississippi.
We now look more closely at the magnitudes of the marginal effects. For example, when the amount of groundwater and surface water used to produce a tomato is decreased from 4 gallons per pound of tomatoes to 2.8 gallons of water per pound of tomatoes, all else being equal, respondents are 3% more likely to purchase the tomato from either a farmers’ market or grocery store. Respondents are 8% more likely to choose a farmers’ market tomato grown with 60% less pesticides than the EPA maximum allowable chemical residue compared with a tomato grown with a 20% reduction in the maximum allowable chemical residue, all else being equal, and 7% more likely to choose a grocery store tomato. Respondents are 11% more likely to choose a grocery store tomato grown within 50 miles of the purchase location than a tomato grown more than 275 miles away from the grocery store, all else being equal. Regarding tomatoes grown with nonpetroleum-based fertilizers as opposed to tomatoes grown with petroleum-based fertilizers, respondents are 9% and 14% more likely to choose a grocery store tomato and farmers’ market tomato, respectively.
Mean WTP for each attribute level at each purchase location and their 95% confidence intervals are displayed in Table 5. Compared with a grocery store tomato, respondents are willing to pay $0.50 per pound more for a tomato from a farmers’ market, on average. Respondents are willing to pay $0.10 per pound more for both farmers’ markets and grocery store tomatoes grown using 2.8 gallons of water per pound than for a tomato grown using 4 gallons per pound. With respect to pesticide residues on fresh tomatoes, respondents are willing to pay $0.27 more per pound for a farmers’ market tomato with 60% less pesticide residues and $0.15 more per pound for a tomato with 40% less pesticide residues compared with a tomato with only 20% less pesticide residue than the maximum residue allowed by the EPA.Footnote 12 This is relatively higher than (although not statistically different from) respondent WTP for grocery store tomatoes grown with same reductions in pesticide residues, which were $0.23 more per pound for 60% less residue and $0.09 per pound for tomato with 40% less residue. Respondents are, on average, willing to pay $0.19 more per pound for a farmers’ market tomato that was produced within 50 miles of the market (compared with 50 to 274 miles), whereas they are willing to pay $0.38 more per pound for a grocery store tomato that was grown within 50 miles of the grocery store (compared with more than 274 miles). They are willing to pay $0.15 more per pound for a grocery store tomato that was produced between 50 and 274 miles of the grocery store than a tomato that was produced between 275 and 400 miles of the grocery store. Lastly, respondents are willing to pay $0.51 more per pound for a farmers’ market tomato that is not grown with petroleum-based fertilizers as opposed to a tomato that is grown with petroleum-based fertilizers, yet respondents indicated they were willing to pay just $0.31 more per pound for that same tomato purchased in a grocery store.
Table 5. Willingness to Pay for Tomato AttributesFootnote a
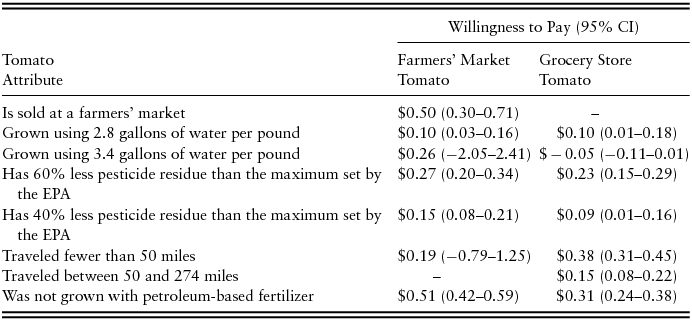
a Krinsky-Robb simulation with 5,000 pseudorandom draws for each model parameter and 200 Halton draws for each random parameter from its distribution.
Notes: Average retail price for fresh market tomatoes was roughly $0.99 in July 2013. CI, confidence interval; EPA, Environmental Protection Agency.
In summary, respondents are willing to pay for marginal improvements in each of the environmental production impacts we examine. Notice that the 95% confidence interval for each value measure—with the exception of 3.4 gallons of water per pound for both purchase locations and farmers’ market tomatoes that were grown less than 50 miles from the market—lies strictly in the positive domain. This gives us confidence that consumers are in fact willing to pay more for each of these credence attribute improvements. Furthermore, with exception of the variables with random parameters, the confidence intervals are also relatively narrow. The overlap of the confidence intervals for different levels of the same attribute also informs us about marginal changes in consumers’ WTP as the attribute levels change. For example, because their confidence intervals overlap by just $0.01, we conclude that respondents are willing to pay more to reduce pesticide residue from 40% less to 60% less than the EPA maximum. The interval for grocery store tomatoes grown within 50 miles of where they are sold does not overlap with that of tomatoes grown between 50 and 274 miles from the grocery store where they are sold, indicating that respondents are willing to pay up to 2.5 times more for “more local” food purchased at a grocery store.
5. Conclusions and Discussion
It is becoming more apparent that consumers are interested in both tangible and intangible attributes of their food products and existing studies have indeed demonstrated that consumers are interested in the environmental attributes of food. Because complete conversion to organic production is particularly difficult in the southeastern United States, our study examines southeastern U.S. consumer preferences for marginal changes in production, whereas previous studies have mostly focused on complete conversion from traditional to organic production practices. We find that for farmers’ market tomatoes, respondents appear to be willing to pay the most for tomatoes not grown with petroleum-based fertilizer, followed by a 60% reduction in pesticide residue, a decrease in water usage per pound of 0.6 gallons, and a tomato that was grown within 50 miles of the market location. For grocery store tomatoes, respondents are willing to pay the most for a tomato that traveled fewer than 50 miles, followed by one not grown with petroleum-based fertilizer, and then by one with 60% less pesticide reside.
These indications about consumers’ WTP for more environmentally friendly production practices constitute only one side of the information producers need in order to determine if changing production practices would be beneficial to them. The other key piece of information that producers need to know is how expensive it is to alter their production practices. It may be that changing fertilizer can earn a higher price premium than changing water usage, but it may cost more to change fertilizers than to decrease water usage.
It can be difficult for producers to judge whether it is beneficial to them to alter production practices without first knowing whether they can expect to be rewarded for their efforts in terms of higher prices on their produce. Our study helps to fill this information gap by providing consumers’ WTP for some of the attributes that relate to production practices. The results of this survey are beneficial to regional tomato producers, and possibly to other specialty crop producers, who could possibly adopt specific production practices that lead to the incremental improvements in the environmental attributes that were evaluated in this study. These producers have an opportunity to adopt or expand environmentally friendly production methods or differentiate their products at local markets through promotion of these specific production practices. Another important consideration is that, for products sold by a retailer, the changes in WTP resulting from changing production practices may be passed on from retailer to producer in varying degrees. This remains a consideration for future research.
A better understanding of why consumers purchase the products that they do and of differentiated market segments is essential to profitable product differentiation, especially in direct-to-consumer sales. Because each consumer values attributes differently, producers must identify marketing strategies that deliver the food products that satisfy consumers’ wants. For example, if some consumers are willing to pay more for a reduction in pesticide residue, farmers who can demonstrate zero or minimal residue on their fresh produce could directly target those consumers. Farmers’ markets and other direct-to-consumer outlets provide direct interactions between the producers and consumers, which allows opportunities to discuss environmentally friendly production practices and the potential benefits of those production practices to consumers and the environment. On a related note, results from this study also revealed that the respondents were willing to pay a price premium for a tomato purchased at a farmers’ market over a tomato purchased at a grocery store, but also that residents of Florida, Georgia, Louisiana, and Texas are less likely to purchase a farmers’ market tomato relative to residents of Mississippi, all else being equal. Finally, our results provide evidence that tomatoes sold in a grocery store with a relatively higher degree of “localness” result in higher price premiums.
By incorporating consumer-preferred credence attributes into targeted marketing plans, producers could potentially increase profitability through the adoption of environmentally conscious production methods. When consumers exhibit a WTP a premium for food products with specific attributes that are differentiable from other products by grower-specific production practices, producers could potentially charge a price premium for these products, therefore increasing profitability.
Because organic production in the southeastern United States is relatively more expensive because of year-round pest and disease pressures, extension outreach programs could aim at helping producers use these results to implement new farm practices to grow and sell marketable fresh produce via development of targeted marketing strategies that inform the buyers of newly adopted environmentally sensitive practices.
Further research might examine if similar price premiums for these specific environmental production attributes would hold for other regions in the country. It would also be beneficial to determine if these same environmental production attributes would bring a price premium for other fresh market specialty crops like greens and berries, as well as value-added fruit and vegetable food products.
Appendix
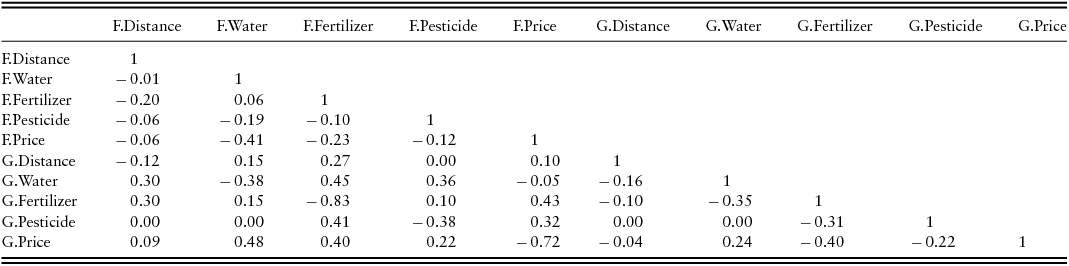
Table A1. Correlations (Pearson product moment) among Attributes of the Labeled Alternatives


 Open access