


Introduction
The European dairy sector is the second largest agricultural sector in Europe (EU, 2018). The EIP-AGRI Focus Group on Robust and resilient dairy production systems reported that (2018): ‘A robust and resilient dairy production system should be able to withstand changes from outside like drought and volatile prices’. Indeed, the sector is likely to be increasingly affected by climatic change, including higher temperatures and more frequent extreme events such as heat waves, droughts, storms and heavy rainfalls (Ahmad et al., Reference Ahmad, Diwan, Abrol, Pareek, Sopory and Bohnert2009; IPCC, 2014, 2019), which are expected to lead to both direct and indirect impacts. With increasing summer temperatures, heat stress is likely to affect dairy cow productivity more frequently, even in temperate climate regions (Armstrong, Reference Armstrong1994; Fodor et al., Reference Fodor, Foskolos, Topp, Moorby, Pásztor and Foyer2018). Heat stress negatively affects dairy cattle welfare and productivity in multiple ways, including reduced feed intake, and increased body temperature and respiratory rate, as cows cope with high environmental temperatures and humidity (Armstrong, Reference Armstrong1994; Bernabucci et al., Reference Bernabucci, Biffani, Buggiotti, Vitali, Lacetera and Nardone2014; Ammer et al., Reference Ammer, Lambertz, von Soosten, Zimmer, Meyer, Dänicke and Gauly2018).
These direct consequences on the animal can be further exacerbated through the negative influence of heat and drought on pasture and forage production (Soussana et al., Reference Soussana, Graux and Tubiello2010). Drought stress events have become more common in Europe, and in the Mediterranean basin in particular, while the increasing occurrence of higher temperature records may worsen the impacts of drought (IPCC, 2019). The combined effects of heat waves on cattle welfare and on pasture and forage productivity are likely to affect the economic performance of dairy farms.
The literature on dairy systems typically analyses the effects of climate on yields or revenues in very specific contexts or countries, and impacts are often measured only for a limited time period (Bernabucci et al., Reference Bernabucci, Biffani, Buggiotti, Vitali, Lacetera and Nardone2014; Fodor et al., Reference Fodor, Foskolos, Topp, Moorby, Pásztor and Foyer2018). In addition, very few of those studies focus specifically on the impacts of environmental conditions on efficiency.
This paper aims to evaluate the influence of heat and drought stress on the annual performance of dairy cow systems across a large geographic region using balanced dairy enterprise panel data from the Farm Accountancy Data Network (FADN) database (EU-FADN – DG AGRI, 2019). Performance is measured in terms of technical efficiency (TE) and economic downside risk, which are often used as economic indicators in the dairy sector since they reflect the capacity of farms to achieve their specific potential and face major economic risks (Madau et al., Reference Madau, Furesi and Pulina2017; Finger et al., Reference Finger, Dalhaus, Allendorf and Hirsch2018).
TE characterizes farm performance and reflects the ability of a farm to generate output units, given the inputs and the state of technology at its disposal (Johansson, Reference Johansson2005; Abdulai and Tietje, Reference Abdulai and Tietje2007). In other words, TE represents the effectiveness with which a given set of inputs (e.g. pesticides, feed, etc.) is used to produce output units (e.g. milk production per cow). We assume that climate stress can decrease TE through two main pathways. Firstly, dairy cows can be directly affected by heat stress with an immediate drop in milk yield and quality (Hill and Wall, Reference Hill and Wall2015). Secondly, both heat and drought stress can affect the quantity and the quality of forage available for dairy cows, causing reduced grass availability for grazing herds during the stress period, and potentially impacting yield and quality of forage harvested for the subsequent winter feeding period. The reason these pathways are considered relevant for TE is that the ability to convert inputs into outputs under the influence of exogenous weather variables is likely to vary between farms, depending on the management system in place under a given state of technology.
Economic downside risk measures the negative economic impact(s) associated with production risk(s). It is a performance indicator that is of particular importance in the dairy sector in which farmers have to deal with high volatility in milk quantity and quality and market price (Wolf et al., Reference Wolf, Roy Black and Hadrich2009; Belasco et al., Reference Belasco, Schroeder and Goodwin2010; Henry et al., Reference Henry, Boyer, Griffith, Larson, Smith and Lewis2016; Finger et al., Reference Finger, Dalhaus, Allendorf and Hirsch2018). TE and economic downside risk are complementary indicators, in that high TE of farms does not necessarily reduce exposure to economic downside risk (and vice versa), depending on the intensity of input use per dairy cow. In this study, we hypothesize that, on average, both TE and economic downside risk are negatively affected by climate stress.
Materials and methods
Data
The analysis of impacts of the climate on the performance of the European Union (EU) dairy cow sector was undertaken by combining climatic data available from the Gridded Agro-Meteorological data in Europe (AGRI4CAST) (EU, 2019a) and the farm accounting data available from the FADN database (EU-FADN – DG AGRI, 2019) at a NUTS2 region (e.g. French Alsace region) spatial scale (EU, 2019b). NUTS stands for Nomenclature of Territorial Units for Statistics, which is a geographical system according to which the EU territory is divided into hierarchical levels. The three hierarchical levels are known as NUTS1, NUTS2 and NUTS3. NUTS2 are basic regions for the application of regional policies. A given NUTS1 or NUTS2 region typically contains several NUTS2 and NUTS3 regions, respectively. The primary purpose of the FADN is to monitor, on an annual basis, farm income and business activities in EU countries. Software Stata 15.1 (StataCorp, 2017) was used in all steps of the analysis for data management and computation.
Climatic data
Daily meteorological data for the period 2004–2013 were obtained from the Agri4Cast database that comprises daily weather values, including the grid number (location) of each weather station, altitude (m), vapour pressure (hPa), precipitation quantity (mm) and the maximum, minimum and average temperature (°C). The individual weather station data needed to be aggregated to NUTS2 regions in order to match heat and drought information with the anonymized farm data organized by NUTS regions within the FADN data structure. On average there are 44 weather stations per NUTS2 region. As the approximate altitude of each farm was available, the climatic data could be allocated to a binary altitude variable, allowing a differentiation between lowland and upland farms (threshold of 600 m). Missing values, due to a lack of weather station data in a particular NUTS2 region and given altitude level (lowland or upland), were derived using the percentage difference between lowland and upland areas at the larger NUTS1 level where data were available. The percentage difference was applied to the value available at the NUTS2 level and given altitude level (lowland or upland) to derive the missing value at the NUTS2 level from either the lowland or upland area. Values were replaced as a proportion of 0.0057 in the total number of observations. The percentage difference was capped to a proportion of ±0.25 to prevent inaccurate extreme difference when the initial value was very close to zero. Adjustments to the value of the corresponding NUTS2 region and given altitude level (lowland or upland) are needed because the altitude influences the weather conditions.
The performance of dairy farms is strongly influenced by the context in which they operate, so it is important to cluster farms from regions that are part of a similar environment. Ceglar et al. (Reference Ceglar, Zampieri, Toreti and Dentener2019) defined European climate zones using weather data at the NUTS2 level, but their study focused specifically on cropping systems and the variables used to define the different zones were selected for their capacity to discriminate favourable climatic conditions for vegetation growth. In this paper, we postulate a direct effect of weather on forage production but also on the health and productivity of dairy cows. Therefore, NUTS2 regions were grouped into classes representing similar climatic conditions (climatic regions) in general terms. The data set contained 239 lowland and 153 upland NUTS2 regions. Latent class analysis (LCA) was used to identify the underlying structure of the data to predict the probability of each lowland region belonging to a specific class (Hagenaars and McCutcheon, Reference Hagenaars and McCutcheon2002). Following authors who specified European agro-environmental zones (Metzger, Reference Metzger2005; Iyigun et al., Reference Iyigun, Türkeş, Batmaz, Yozgatligil, Purutçuoğlu, Koç and Öztürk2013; Beck et al., Reference Beck, Zimmermann, McVicar, Vergopolan, Berg and Wood2018), maximum summer temperature, minimum winter temperature, annual standard deviation (s.d.) of daily average temperature, number of rainfall days with <1 mm and the average daily rainfall were selected for use in the parametrization.
To classify the data into more homogeneous groups, a generalized structural equation model to measure latent variables and defining latent classes was used (Stata command gsem, with lclass option) for all NUTS2 regions in lowland areas, with upland areas further identified by their altitude (>600 m) given their specificity in terms of dairy system. The number of classes was defined by minimizing the Schwarz Bayesian information criterion (Schwarz, Reference Schwarz1978) while ensuring sample sizes of >200 observations a year to avoid generating too small classes that would significantly reduce statistical power. This resulted in five lowland classes, while all upland farms were grouped into a single class. Therefore, six climatic classes were assessed, with the following geographically descriptive names: North Atlantic (NAT), West Atlantic (WAT), Boreal (BOR), Continental (CON), South (SOU) and Upland (UPL).
Temperature–humidity index
Temperature–humidity index (THI) is a commonly used indicator to measure potential heat stress in cattle based on environmental temperature and humidity (Johnson, Reference Johnson1980; Hahn et al., Reference Hahn, Mader and Eigenberg2003). However, the expected threshold above which heat stress can be observed varies greatly in the literature, ranging from 60 to 78 (McDowell, Reference McDowell1972; Brügemann et al., Reference Brügemann, Gernand, König von Borstel and König2012; Dash et al., Reference Dash, Chakravarty, Singh, Upadhyay, Singh and Yousuf2016), which is likely due to the large diversity in both methodology and geographical location covered by different studies. An important difference is whether the calculated THI thresholds correspond to a daily average, daily maximum, daily minimum, a mix of maximum and minimum values or instantaneous values, either real or derived from the maximum and minimum THI values (Ravagnolo et al., Reference Ravagnolo, Misztal and Hoogenboom2000; Finger et al., Reference Finger, Dalhaus, Allendorf and Hirsch2018). Another major difference is the geographical area studied as there is evidence of cattle acclimatization to heat stress (Dunn et al., Reference Dunn, Mead, Willett and Parker2014).
Several THI formulae have been developed over the past few decades (see e.g. Dikmen and Hansen (Reference Dikmen and Hansen2009) for a review). In this study, THI was calculated in three steps, as follows (NRC, 1971; Sargent, Reference Sargent1980; Oyj, Reference Oyj2013):
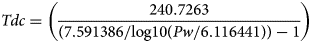

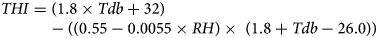
where Tdc is the dewpoint, Pw is the vapour pressure (hPa), Tdb is the dry bulb temperature (°C) and RH is the relative humidity (%).
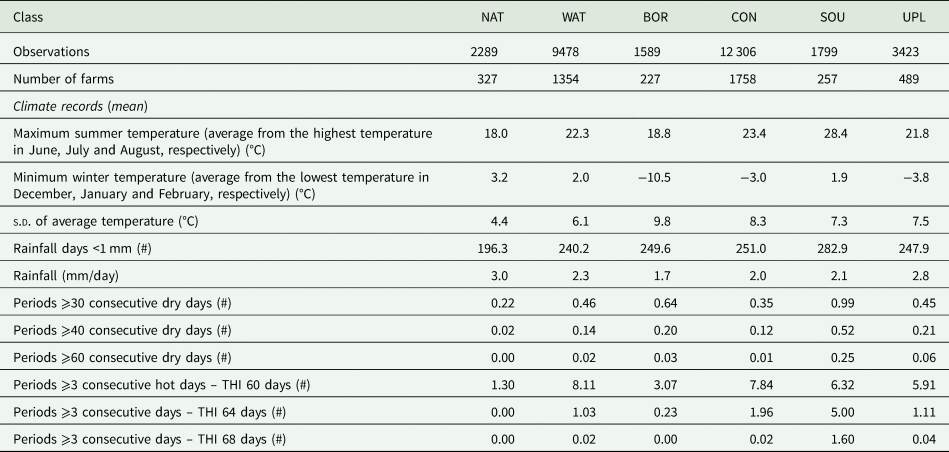
West (Reference West2003) and Spiers et al. (Reference Spiers, Spain, Sampson and Rhoads2004) reported a heat stress impact on milk yield from the third consecutive day of exposure to high THI. In this study, to account for heat stress, the number of occurrences when there were at least three consecutive days of exposure to high THI was calculated. Different THI thresholds were primarily assigned to the geographical classes identified by the LCA procedure: a threshold of 60 was selected for NAT and BOR (coolest western classes) in line with estimations by Brügemann et al. (Reference Brügemann, Gernand, König von Borstel and König2012); 64 was the threshold for WAT, CON and UPL (average of estimation by Brügemann et al., Reference Brügemann, Gernand, König von Borstel and König2012; Zimbelman et al., Reference Zimbelman, Rhoads, Rhoads, Duff, Baumgard and Collier2009) and 68 was the threshold for SOU as suggested by Bouraoui et al. (Reference Bouraoui, Lahmar, Majdoub and Belyea2002) under a Mediterranean climate. The threshold of 64 assigned to CON and UPL classes did not allow assessment of a significant effect, so it was increased to 68.
Drought indicator
Water availability in soil is a key factor in forage production (Sepulcre-Canto et al., Reference Sepulcre-Canto, Horion, Singleton, Carrao and Vogt2012), but this information was not available. In this study, precipitation levels were used to predict drought periods as limitation in water availability is partially caused by limited precipitation. Equivalent to the THI calculations, the drought stress was defined as the number of periods from March to September (most critical period for vegetation growth) with a specified minimum number of consecutive dry days. A dry day was defined when daily precipitation was below 3 mm. A drought stress threshold of between 10 and 60 (interval of 10) dry consecutive days was selected in each class at the 75th percentile of the corresponding number of annual dry periods. The process resulted in a cut-off value of 40 consecutive dry days in most of the classes apart from NAT (30 days) and SOU (60 days).
As the drought might induce a delayed effect on the following feeding periods due to decreased forage supplies, a time-lagged drought variable, based on the same thresholds, was also created. This lagged variable was then transformed into a dummy variable, to identify whether the previous year had been exceptionally dry or not, which was created by selecting 0.3 annual dry periods from March to September at the NUTS2 level (average from several weather stations), corresponding to the 90th percentile in NAT, WAT and CON. This variable was not included for the other classes due to multicollinearity issues.
Farm data
Farm data consisted of the FADN data on farm characteristics and production of all ruminant and ruminant-mixed farm types over a 10 year period from 2004 to 2013 in 25 EU countries (the most recent data available). Only farms with an economically relevant dairy enterprise were retained. As per FADN methodology, farms were defined as dairy specialist with a dairy economic output corresponding to a proportion of at least 0.35 of the total farm economic output (EU, 2014). The selected data set of farms comprised of direct and calculated FADN values, on the basis of the FADN dairy enterprise allocation methodology (EU, 2014). Values of EU dairy farms were calculated at the dairy enterprise, per unit of cow, and on a forage hectare basis to further characterize and quantify their economic performance.
To allow observation of the same individual (farm) in a given period (year) and to reduce the noise associated with individual heterogeneity, balanced panel data (in this case, identical farms over time) are preferred over unbalanced data (Quayes, Reference Quayes2015). This approach is particularly important when the model does not assume TE to be time-invariant; in other words, when TE is not fixed and can vary over time (Gupta and Nguyen, Reference Gupta and Nguyen2010). The use of panel data has the advantage of controlling for the unobservable time-invariant heterogeneity due to omitted variables (e.g. farmers' education level) and thus helps to obtain more accurate inefficiency estimates (Ahn et al., Reference Ahn, Lee and Schmidt2013).
The selected dairy data set of more than 140 000 observations did not represent a perfect balanced panel database structure and was therefore refined by only retaining farms that occurred continuously within the data set for seven consecutive years (2007–2013). The resulting sub-data set of ca. 35 000 observations was further reduced after removing severe outliers. Severe outliers (ca. 2000 observations) for the production function variables, the farm size (ha) and stocking density [grazing livestock unit (GLU)/ha] were excluded separately for each class using the standard 25th and 75th percentile ± three times the interquartile range. The final data set contained six classes comprising 30 884 observations, representing a sample of 4412 farms in 22 EU countries over the period 2007–2013. Tables 1 and 2 show the descriptive statistics on production and economics, as well as climatic variables of the farms in the six climatic zones.
Table 1. Production and economic characterization of farms in each class, 2007–2013

AWU, annual work units.
Table 2. Climatic characterization of farms in each class, 2007–2013
To obtain a better geographical representativeness of the dairy farms in each class, a weighting factor was created and used in the efficiency and downside risk analysis to weight individual farm observations. The weighting factor was based on the number of farms present in each NUTS2 region in 2007 (first year) in the final data set compared to the number of farms represented in the database in the same year before the data subset was created.
Efficiency analysis
As recommended by Coelli (Reference Coelli1995) for the computation of TE scores in an agricultural context, the stochastic production frontier (SF) approach was used in this study. The model separates the one-sided TE component (ui) from the statistical noise captured by the random error component vi. This is of utmost importance due to the typical occurrence of data inconsistencies and measurement errors (Coelli, Reference Coelli1995). The Cobb–Douglas functional form was selected, thus making the hypothesis of constant returns to scale in all classes which is tested in this study. Constant return to scale means that the relative increase of the output is equal to the relative increase of the allocated production factors (inputs). This functional form is still widely used in research on economics and productivity measurement as it gives simple estimation and interpretation (Kumar et al., Reference Kumar, Sharma and Joshi2016) and usually provides a fairly good approximation of the production process (Pendharkar et al., Reference Pendharkar, Rodger and Subramanian2008; Epple et al., Reference Epple, Gordon and Sieg2010; Kumar et al., Reference Kumar, Sharma and Joshi2016). One limitation, though, is that the function imposes a given level for substitution possibilities between inputs. More flexible, and still fairly simple, approaches exist such as the nested constant elasticity of substitution functions proposed by Sato (Reference Sato1967) but, in this example, substitution mechanisms remain partly inflexible and the nest structure if often set in an arbitrary manner. Even more flexible approaches are available such as the Translog function, which have the advantage of eliminating constraints on substitution mechanisms between inputs but their use is also far more complex. The latter leads to two specific limitations possibly resulting in poor results: (1) the use of the linear approximation makes it difficult to fulfil the theoretical curvature conditions of the isoquants (curves representing the various combinations of two inputs resulting in the same amount of output), particularly when prices vary greatly (Diewert and Wales, Reference Diewert and Wales1995; Sauer, Frohberg, and Hockmann, Reference Sauer, Frohberg and Hockmann2006); and (2) the demand for inputs is typically derived from the cost function at the optimum that requires having all data on the cost of inputs, and even if such data are available, it is not guaranteed that the approximation is effectively at the optimum due to the rigidity of the function (Dawson and Lingard, Reference Dawson and Lingard1982). In the present case, precise data on inputs cost are not available, thus making the use of a complex, although more flexible production function, unsuitable. Another possible limitation of the Cobb–Douglas function is the assumption of perfect market competition. This assumption is somewhat radical, however, the dairy sector is known to be highly competitive (Drescher and Maurer, Reference Drescher and Maurer1999), making it less dubious. It is clear that a perfect market competition is never attained, but we can argue that the dairy sector does not deviate much from such a perfect equilibrium. Therefore, we believe that the model represents a fairly good approximation of the reality.
To estimate TE scores, a ‘true-fixed’ effects mode was used (Greene, Reference Greene2005a, Reference Greene2005b) where the unobserved individual effects, capturing all unobserved heterogeneity, are fixed (time-invariant) and assumed to be correlated with the regressors (Stata command sfpanel, with tfe option). This ‘true-fixed’ effect model, developed by Greene (Reference Greene2005a, Reference Greene2005b), allows changes in observable individual effects over time by disentangling productive unit-specific heterogeneity from inefficiency (Wang and Ho, Reference Wang and Ho2010; Kutlu et al., Reference Kutlu, Tran and Tsionas2019). The model is fundamentally a standard fixed-effect panel data model augmented by an additional stochastic error component capturing the heterogeneity. For the inefficiency term uit, the half-normal distribution is specified, which appears to be an appropriate specification for highly competitive economic sectors (Kumbhakar et al., Reference Kumbhakar, Wang and Horncastle2015), such as the dairy industry (Drescher and Maurer, Reference Drescher and Maurer1999).
The annual production of milk (kg) per dairy cow was used as a dependent variable. Given the absence of information on the physical quantity of inputs in the FADN database, and the lack of full statistical information on the unit cost of the different inputs in each EU country and over time, inputs were expressed in constant monetary values in the model, using 2013 as the base year. The inflation adjustment of input values was undertaken using the harmonized index of consumer prices (HICP) and the price indices of the means of agricultural production provided by Eurostat (2018, 2019). The latter was used to deflate feed and forage costs, while the other monetary variables, less associated with fertilizer markets, were adjusted by the HICP. Inputs were also expressed per dairy cow and comprised of feed costs (coarse fodder, non-fodder and concentrate), forage costs (based on seed, fertilizer and pesticide costs), maintenance costs (machinery, cars, building and land improvement) and other costs related to milk renewal (herd replacement), contractual work and veterinary services. The family and hired labour were also included and expressed in annual work units. Finally, the forage area (ha) allocated to the dairy enterprise by GLU was included to better account for forage availability per dairy cow.
The ‘true-fixed’ effect frontier model was parameterized as follows (Greene, Reference Greene2005a, Reference Greene2005b):

where PRODit is the production y of milk (kg) per dairy cow for farmi at timet in a given classcl; |cl means that each class cl is estimated independently; αi is the time-invariant unobserved firm-specific (individual) effect; xit is the vector of input variables; β is the vector of coefficients; vit is the random noise term and uit is the inefficiency term (score from 0 to 1).
The effect of climate stress conditions on inefficiency was estimated simultaneously with the production function that identifies the factors determining the level of production. In other words, the inefficiency estimation (derived from the estimation of the production function) and identification of the causing factors were performed in a single-stage process, as undertaken by Kumbhakar (Reference Kumbhakar1991) and Battese and Coelli (Reference Battese and Coelli1995). Several applications in which exogenous variables (not in control of the producer) enter the model exist in the literature, e.g. the inclusion of exogenous country effects such as climate conditions (Greene Reference Greene2008). This method has the advantage over a two-stage estimation process, in that it includes the vector of observed exogenous variables that may affect both the production function and the inefficiency distribution (Kumbhakar and Lovell, Reference Kumbhakar and Lovell2000; Wang and Schmidt, Reference Wang and Schmidt2002; Greene, Reference Greene2008; Belotti et al., Reference Belotti, Daidone, Ilardi and Atella2013).
The climatic regressors included in the model were the number of periods of three or more consecutive hot days (based on THI 60, 64 or 68); the number of periods of at least 30, 40 or 60 consecutive dry days and the dummy-lagged drought variable. Farm size measured as utilized agricultural area, dairy specialization rate and the share of forage maize area, were included as control variables in the model due to their potential positive influence on efficiency (Alvarez and Arias, Reference Alvarez and Arias2004; Bojnec and Latruffe, Reference Bojnec and Latruffe2013; Kelly et al., Reference Kelly, Shalloo, Geary, Kinsella, Thorne and Wallace2013). The share of forage maize area was included in the model as a proxy for more productive land as it is likely to inadvertently increase TE. An indication of whether a farm is organic or not was also included (as dummy: 1 = organic). Finally, the price of milk was also controlled for, as it is expected to affect efficiency for two reasons, partly due to making fewer efforts to improve TE, and also due to a possible bias correction associated with a possible heterogeneity in input prices across countries. Milk prices are likely to give an indication of input prices due to country specificities in terms of general price level. This assumption is supported by the data set, where we found a moderate positive correlation between milk prices and input costs of around 0.3 in CON, SOU and UPL (with almost zero correlation in the other classes). Therefore, efficiency scores of farms located in these classes may be biased and it is essential to control for this possible bias (Table 3).
Table 3. Variables used in the efficiency analysis
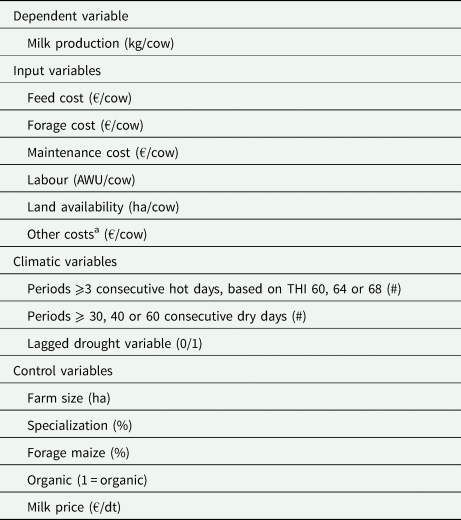
AWU, annual work units.
a The other costs include the milk renewal, contractual work and veterinary services costs.
As observations may be correlated within a NUTS1 region, due to similar farm systems at that level, the option vce (cluster) was used to adjust standard errors (s.e.), by relaxing the usual requirement of independent observations (Belotti et al., Reference Belotti, Hughes and Mortari2017). Therefore, correlation within NUTS1 regions was allowed, while assuming observations to be independent between regions.
Economic downside risk analysis
The economic downside risk refers to the variability of the gross margin per dairy cow and corresponds to the possible decrease of the gross margin in 1 year compared to the average over the 7 year period (2007–2013). Specifically, the downside risk was calculated on an annual basis for each individual farm as the difference between the gross margin in year t and the average gross margin over the 7 year period. This variability of the gross margin is called the downside gross margin difference (DGMD). Gross margins per dairy cow for all farms were simply calculated as the revenue (production x milk price) minus the sum of feed, forage, maintenance and other costs.
As we only look at the downside risk, positive values were treated as null-effects, which implies the dependent variable to be right censored at the zero value. As a significant fraction (0.50) of the observations had a null value, a Tobit model was selected to deal with this type of data (Tobin, Reference Tobin1958). As the unobserved heterogeneous variables were not expected to be correlated with the regressors (climatic and control variables), a random-effects model was used (xttobit command). The class-specific random-effects Tobit model was specified as follows:
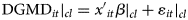
where Eqn (5) indicates that DGMDit is the downside gross margin difference per dairy cow for farmi at timet in a given classcl; |cl means that each class cl is estimated independently; xit is the vector of explanatory variables; β is the vector of coefficients and εit is the disturbance term. Equation (6) indicates that the dependent variable is right censored at the zero value, in all classes.
Results
Technical efficiency
The Cobb–Douglas functional form was appropriate for fitting the SF model with the test for the hypothesis of constant returns to scale (sum of inputs elasticity = 1) being significant (P < 0.01) across all classes, which means that the relative increase of the output is equal to the relative increase of the allocated inputs. The Wald test was also significant (P < 0.01) in all classes, indicating the explanatory variables had statistically significant effects and therefore were appropriately selected.
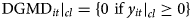
The distribution of efficiency scores shows a similar pattern across classes apart from SOU and UPL where the distribution (curve) is flatter (Fig. 1), meaning that these classes are more heterogeneous in terms of efficiency of the different farms and over the 7 year period. Average efficiency scores across the six climatic classes are very high, ranging from 0.88 (out of 1) in SOU to 0.96 in NAT.
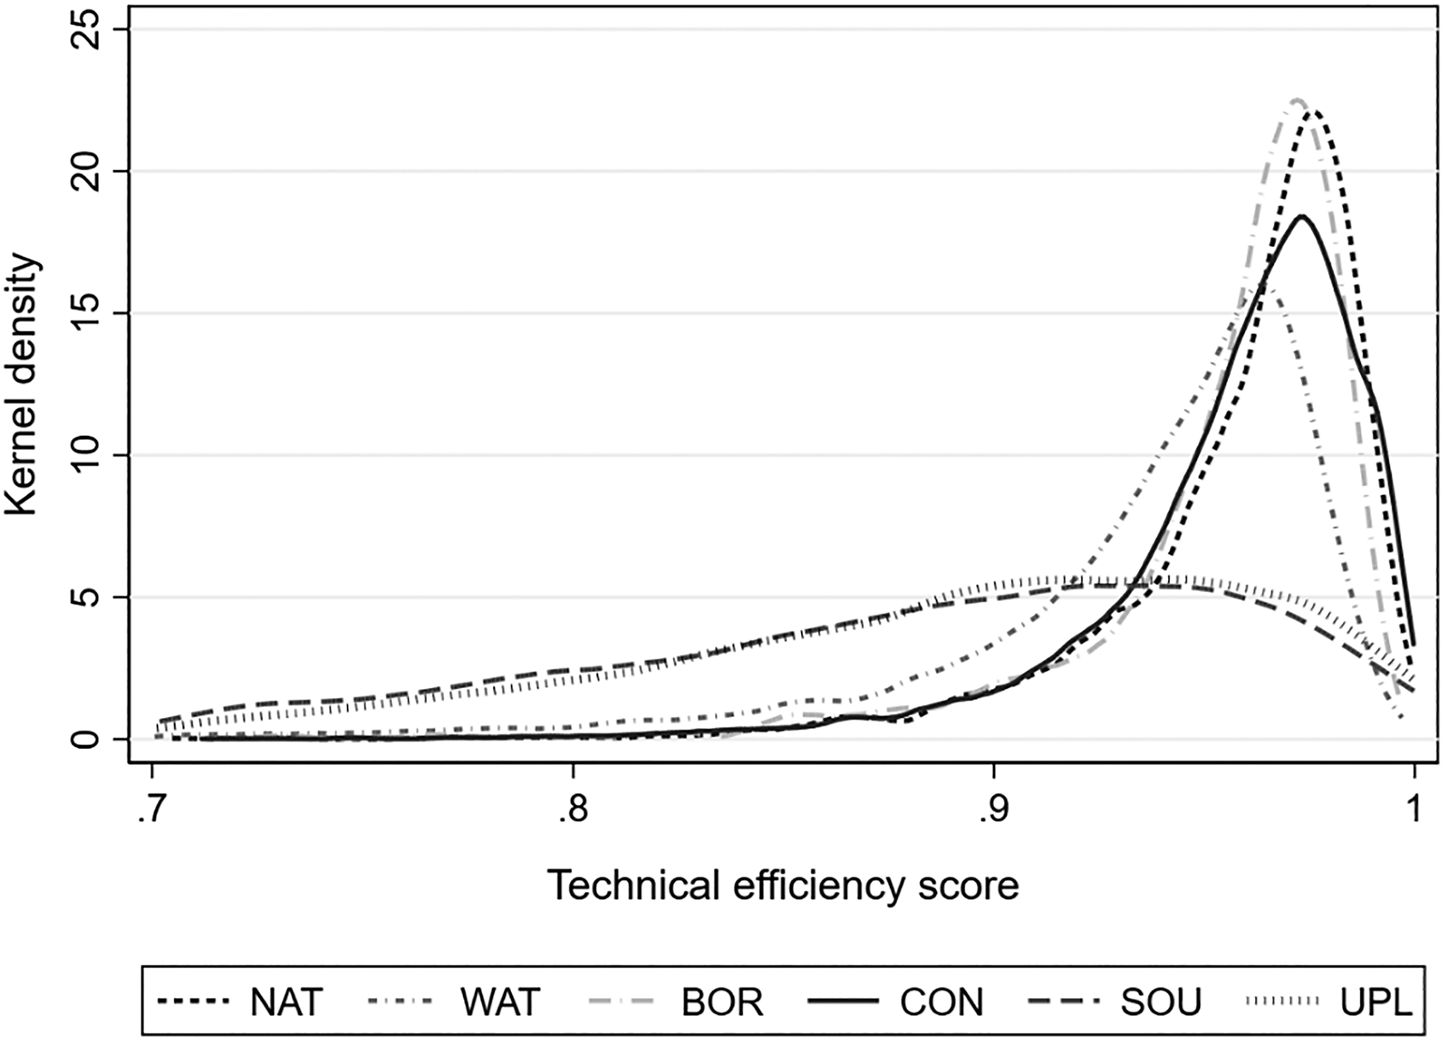
Fig. 1. Distribution of efficiency scores in each climatic class, 2007–2013.
The estimated coefficients for the milk production function are presented in Table 4. The majority of coefficients had the expected positive sign. Feed cost per dairy cow was a highly significant factor across all classes, though no significant associations were found for forage costs. Labour was significant for all classes, while maintenance, land availability and other costs (milk renewal, contractual work and veterinary services) were significant for most classes.
Table 4. Milk production function determinants in each climatic class, 2007–2013
AWU, annual work units.
Note: Significance levels: ***P < 0.01, **P < 0.05, *P < 0.1.
Dependent variable: Milk production [ln(kg/cow)].
Table 5 presents the determinants of inefficiency, and not efficiency, as the analysis was conducted in a one-stage process. In the WAT, BOR, SOU and UPL classes, drought is significantly and positively associated with inefficiencies in a given year t. Otherwise, drought had no significant effect in CON, while it had a delayed significant effect in NAT for year t + 1. Heat also significantly contributed to inefficiencies in most of the classes, with exceptions in CON and UPL.
Table 5. Influence of heat and drought stress on technical inefficiency in each climatic class, 2007–2013
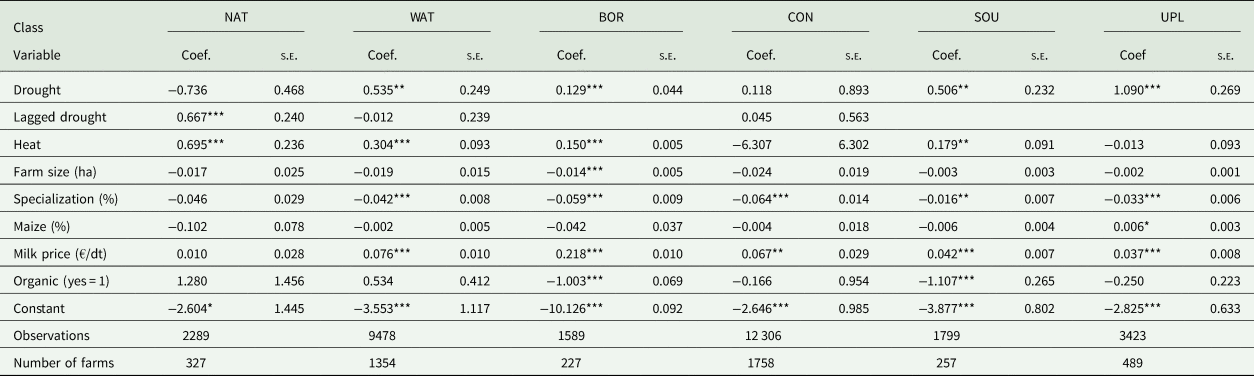
Note: Significance levels: ***P < 0.01, **P < 0.05, *P < 0.1.
Dependent variable: [inefficiency term ui].
The estimated parameters for the control variables suggest that a higher specialization rate and a higher milk price have a significant effect, reducing or increasing inefficiencies, respectively. The effect of farm size on the inefficiency term was not significant across classes apart from BOR where an increased farm size significantly reduced inefficiency. The share of maize forage was not significant in most classes apart from UPL. Moreover, organic farms appear to be significantly less inefficient than conventional farms in BOR and SOU, though this effect is not confirmed in other classes.
Economic downside risk
An average proportion of ca. 0.50 (n = 2217) of the total number of farms (n = 4412) was affected annually by downside risks across all classes. However, this share was quite variable and ranged from ca. 0.29 in 2007 to 0.89 in 2009, with an s.d. of 23% over the 7 year period.
The average trend of DGMD per dairy cow is illustrated in Fig. 2. A similar pattern can be observed for all classes except for BOR. The DGMD magnitude substantially increased across Europe in 2009, compared to the 7 year average, probably due to the widespread reduction in milk prices in 2009 compared to 2008 (−21%) and compared to the whole 7 year period (−17%). Another increase in the DGMD magnitude is observed in the BOR class in 2012 and 2013, possibly due to the overall feed cost rise in these 2 years compared to the 7 year period (mean = +31%).
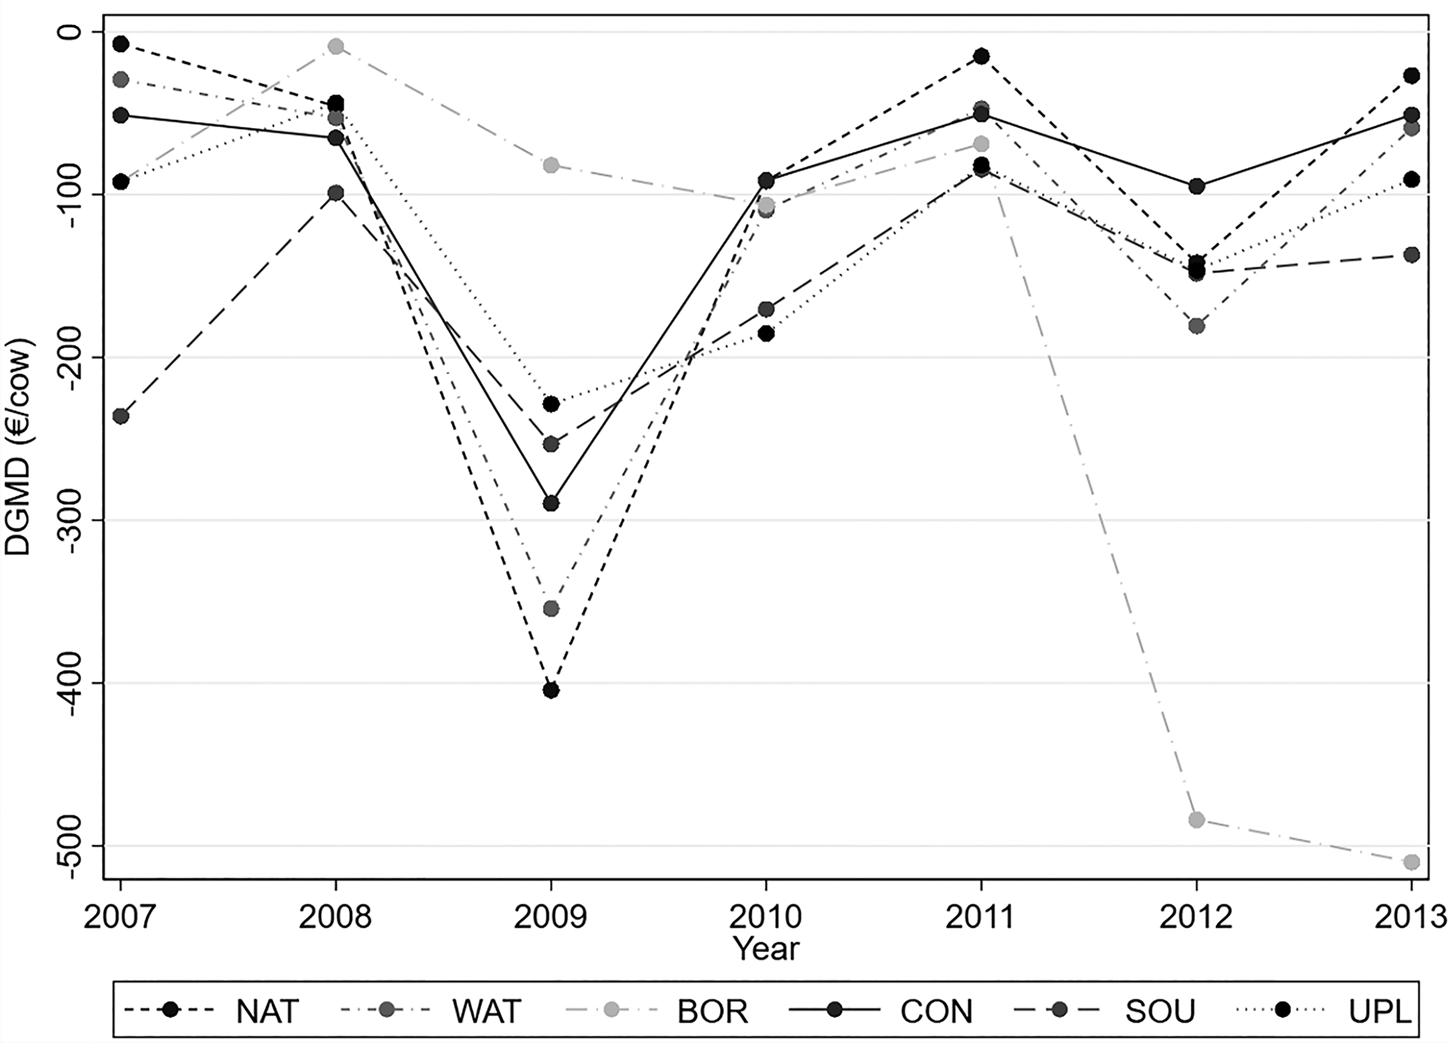
Fig. 2. Mean of the DGMD in each climatic class, 2007–2013.
The determinants of the DGMD per dairy cow are reported in Table 6. The Wald test was significant (P < 0.01) across all classes, indicating that the Tobit model was correctly specified. Our findings indicate that drought consistently had a significant negative effect on DGMD in BOR, CON, SOU and UPL directly in year t and also a delayed effect on the year t + 1 for CON. The effect of drought is more ambiguous in NAT and WAT as in the current year it appears to lessen the downside risk while it has a negative effect in the year t + 1. The significant effect of heat is negatively associated with DGMD across classes, with the lowest magnitude in UPL and the highest in CON.
Table 6. Influence of drought and heat stress on DGMD in each climatic class, 2007–2013
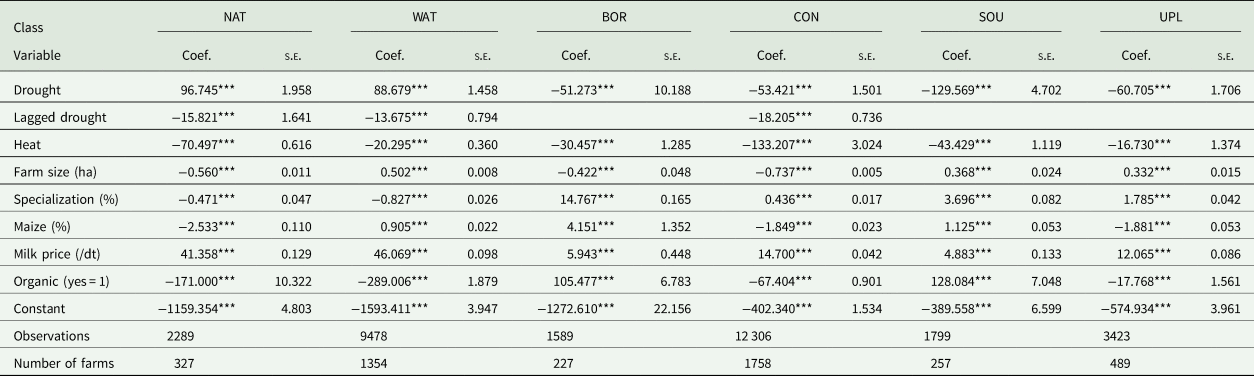
Note: Significance levels: ***P < 0.01, **P < 0.05, *P < 0.1.
Dependent variable: DGMD [€/cow].
Results for the control variables show that a higher milk price generally improves economic resilience through a reduced DGMD. In addition, a higher specialization rate generally reduces DGMD, except for NAT and WAT that showed high specialization ratios of 0.73 and 0.72, respectively. However, the specialization ratio was also high in BOR (0.79) compared to the other classes (0.64–0.71). The other variables also play a significant role in DGMD, but results are variable across classes in terms of the direction of the relationships. Organic farms are less affected than conventional farms by the economic downside risk in BOR and SOU, but in contrast, organic farms are significantly more affected in other classes.
Graphically, no clear link between TE and DGMD is observed across classes. In fact, the correlation between TE and DGMD is quasi-null in WAT and CON, while there is a slight positive correlation in the other classes, ranging from 0.20 in BOR to 0.28 in SOU (Fig. 3).
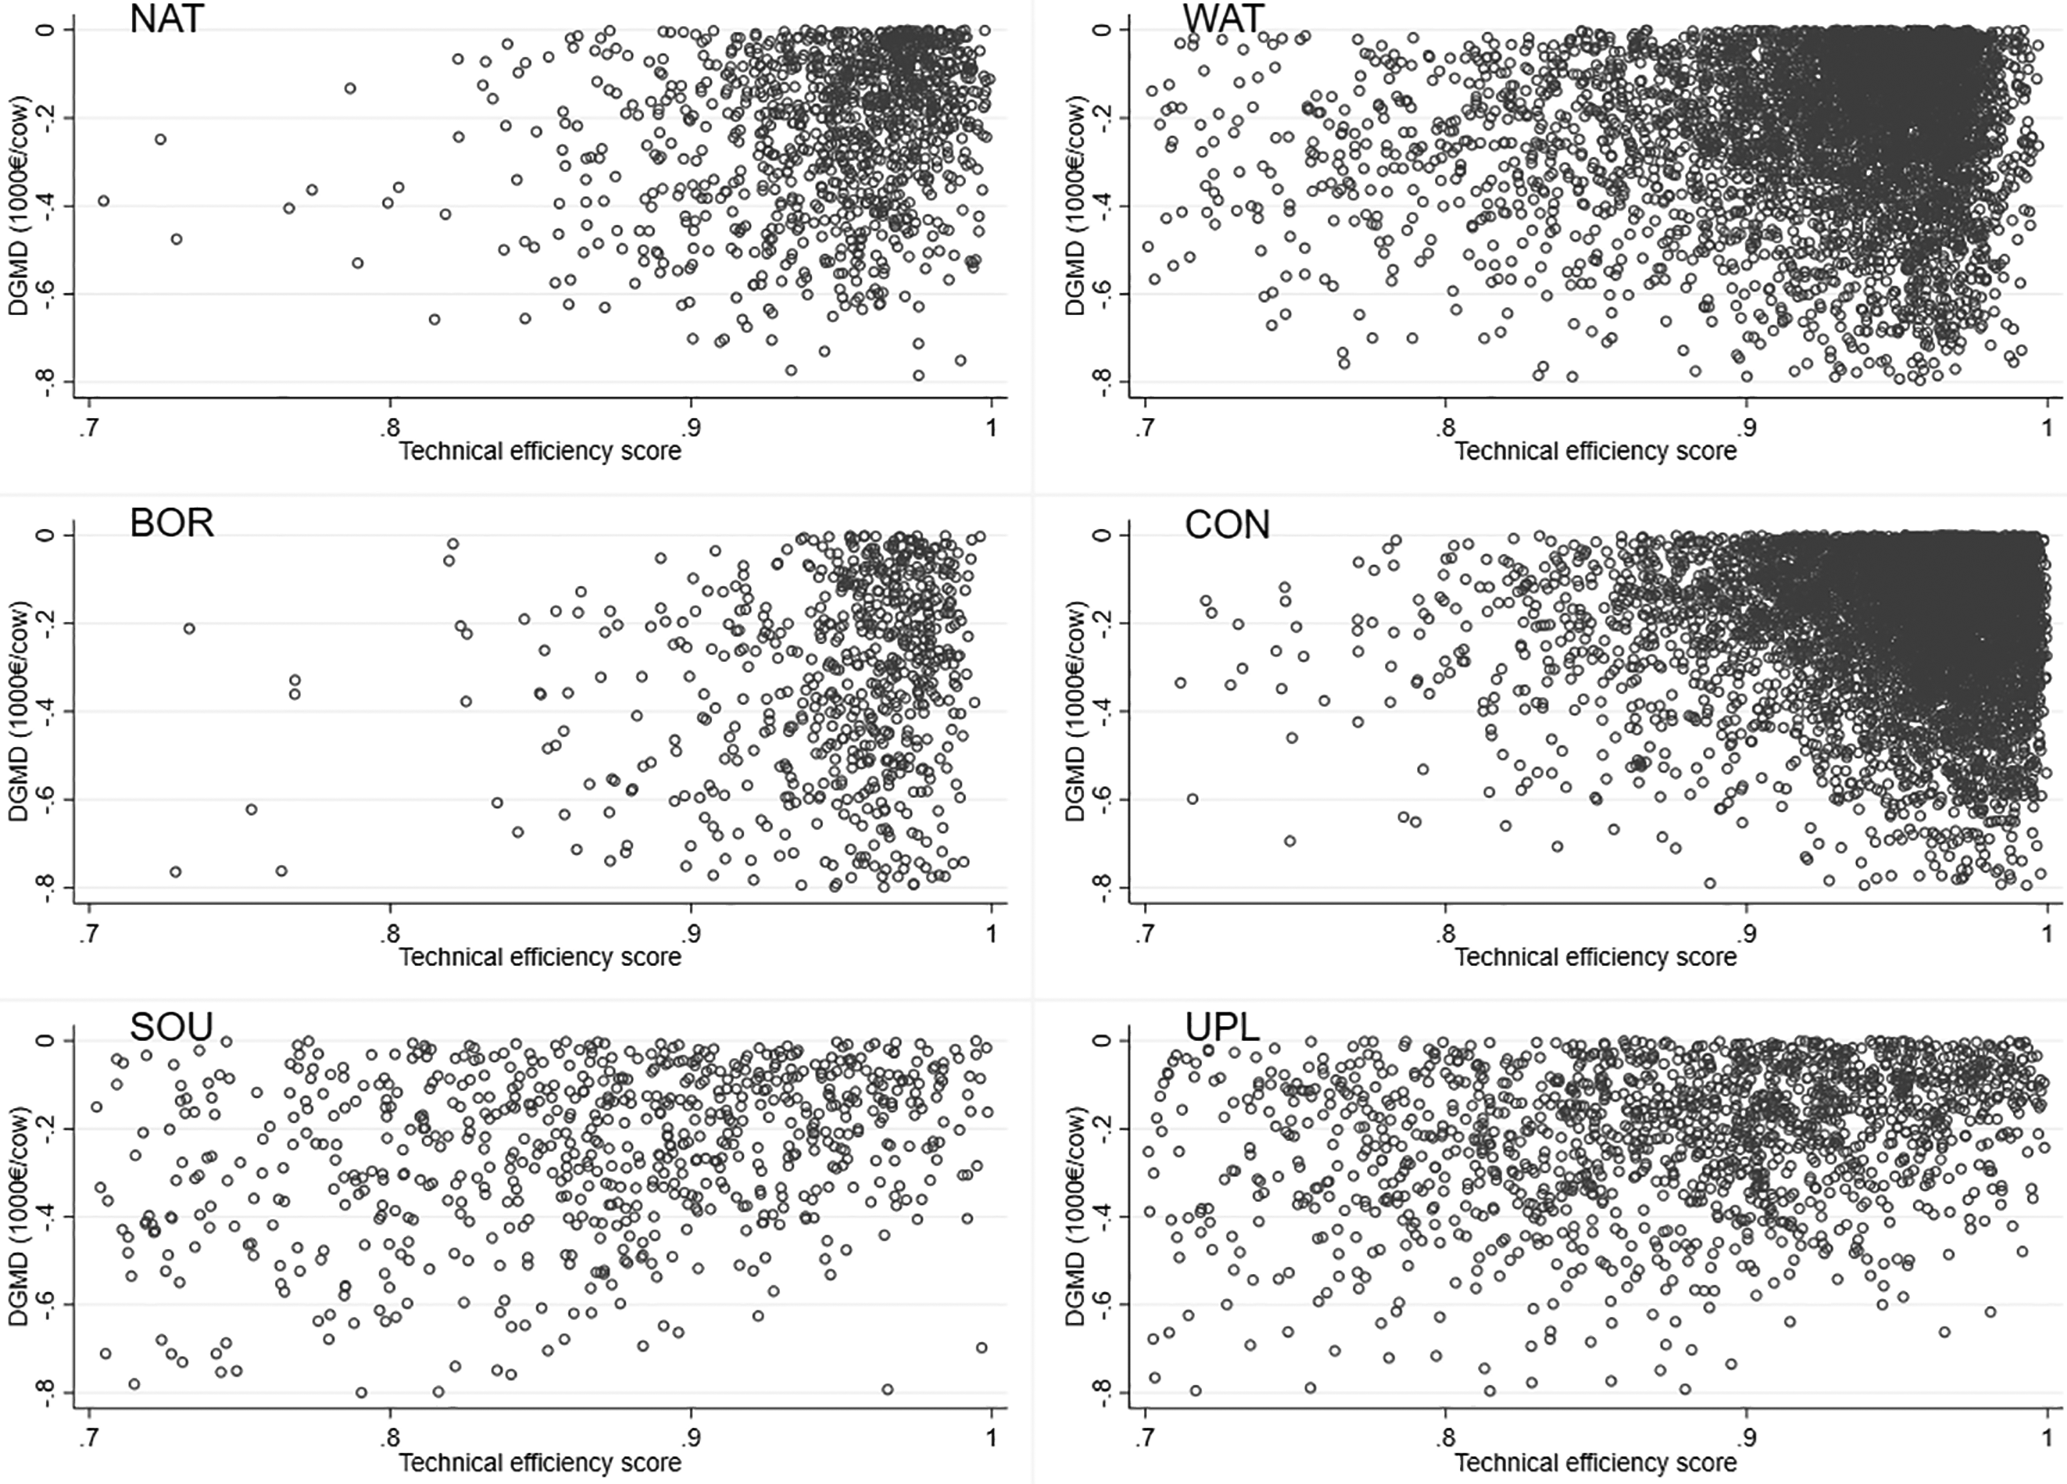
Fig. 3. Relationships between TE and DGMD in each climatic class, 2007–2013.
Discussion
This study assessed the influence of drought and heat stress on the performance of a panel of EU dairy farms obtained from the FADN data set, through measuring and estimating climate determinants of TE and DGMD. The SF and Tobit models allowed absorption of the unobserved heterogeneity effect. Furthermore, the Cobb–Douglas functional form appeared to be appropriate as the hypothesis of constant returns to scale was highly significant across all classes. Even though the literature highlights that the typical relationships between marginal costs and average costs would imply the presence of decreasing returns to scale at a certain point, it has also been emphasized that technological advances and human capital investments can delay this trend in the dairy sector (Mosheim and Lovell, Reference Mosheim and Lovell2009). Furthermore, some studies even found increasing returns to scale in agriculture (Martinho, Reference Martinho2017). However, these studies often take into account the total output as well as the fixed capital that is known to be a key driver to economies of scale (Kislev and Peterson, Reference Kislev and Peterson1996; Mohammad, Reference Mohammad2020). In this paper, the analysis is made on a per dairy cow basis, thus limiting for instance the effect of an increased level of feed as the number of cows remains unchanged. In addition, the fixed capital is largely excluded.
The selection of the two performance indicators was justified by the absence of a clear correlation between TE and DGMD in each climatic class. This absence or weak correlation across classes indicates that highly technically efficient dairy enterprises are not necessarily economically stable and in some cases may be less resilient, as shown previously by Korhonen and Seager (Reference Korhonen and Seager2008). This finding could be due to the fact that highly technically efficient dairy enterprises operate by optimizing the use of resources (e.g. grassland use) and may therefore have too limited reserve capacity to face climatic shocks.
Consistent with previous findings (Shortall and Barnes, Reference Shortall and Barnes2013; Mareth et al., Reference Mareth, Thomé, Cyrino Oliveira and Scavarda2016; Madau et al., Reference Madau, Furesi and Pulina2017), this study confirms that European dairy farms are highly technically efficient and the little lower TE scores of SOU and UPL could be due to the frequent occurrence of drought periods in these two classes compared to the others. A significant effect of drought stress on TE was demonstrated in most of the classes. Kompas and Tuong (Reference Kompas and Tuong2004) and Chidmi et al. (Reference Chidmi, Solís and Cabrera2011) have shown similar results in Australia and North America, respectively. The delayed effect of drought observed in the NAT class could be due to a shortage of forage stock in the subsequent year, potentially causing an increase in feed costs per cow. A shortage of forage may lead to a reduced proportion of forage in the diet, which may affect production levels in the absence of a high level of farm management (Beauchemin and Yang, Reference Beauchemin and Yang2003). In terms of the heat stress, a significant effect was observed on TE across four out of six climatic classes. A few studies in the literature have shown comparable results in American and European contexts (Mukherjee et al., Reference Mukherjee, Bravo-Ureta and De Vries2013; Key et al., Reference Key, Sneeringer and Marquardt2014). The lack of a significant heat effect on TE for UPL was expected as this class grouped upland farms, located above 600 m of altitude, where heat waves are less frequent and intense compared to lowland classes. In the case of CON, the lack of impact of both drought and heat on TE could be due to a lower intensity level in terms of milk yield compared to the other classes, except for NAT.
The DGMD was also clearly affected by drought and heat stress across classes. Finger et al. (Reference Finger, Dalhaus, Allendorf and Hirsch2018) demonstrated a negative effect of heat on the economic downside risk (on milk revenues) in German dairy farms. In this study, an unexpected significant positive effect of drought was found in NAT and WAT. This finding may indicate a negative role played by excessive rainfall, as NAT and WAT are two of the three most humid classes present in the analysis, with an average daily precipitation level of 2.99 and 2.27 mm over 2007–2013, respectively. The dairy specialization rate is positively associated with DGMD in most classes, meaning that more specialized farms often perform better in an economic downturn.
The analysis performed in this study has the limitation that both the weather and FADN data are from 2007 to 2013 (the most recent FADN data available). The study also has limitations due to the averaging of climate data at the NUTS2 regional level to align the FADN and climate data sets, but most regions are relatively uniform. Another potential shortcoming of the study was the use of deflated input costs instead of input quantities that were not available in FADN. However, the inclusion of heteroskedastic variables in the ‘true-fixed’ effect SF model, and the inclusion of the same variables in the Tobit model allowed some of the residual country heterogeneity to be captured. Moreover, the FADN methodology that was used to allocate costs may not always provide a fully accurate allocation of costs to characterize the dairy enterprise.
To conclude, while many studies have indicated the direct effects of heat on individual cows or herds, this study has shown that the TE and economic resilience of dairy cow systems across most of Europe is negatively affected by excess heat and/or drought, even when considering the economic performance on an annual basis. These results would need to be further investigated in the future using the most recent weather and farm data available.
In a global warming scenario in which climatic stress is expected to increase in the near future, appropriate management and innovation strategies to mitigate the effects of heat and drought are needed to limit the negative economic implications on the dairy sector. One strategy could be to reduce the stocking density and to rely more on extensive and outdoor systems, thus making more feed from pastures available to dairy cows under climate stress conditions. However, it raises a broader question which is the sustainability of the dairy and food sector as a whole. The dairy sector has been criticized for its high land use requirements in contrast to plant-based foods that are less land intensive (Temme et al., Reference Temme, Van Der Voet, Thissen, Verkaik-Kloosterman, van Donkersgoed and Nonhebel2013). An increase in the surface area allocated to each dairy cow (lower stocking density) would make more feed from pastures available to cows but, at the same time, potentially reduce the availability of forage coming from dedicated lands, thus possibly undermining the resilience of the dairy sector under extreme weather conditions. An even broader consideration is that mitigating the effects of heat and drought stress may not be seen as a sufficient response to the global sustainable question since the dairy sector is, for instance, a high contributor to methane emissions (Negussie et al., Reference Negussie, Lehtinen, Mäntysaari, Bayat, Liinamo, Mäntysaari and Lidauer2017).
In addition to these considerations and to the existing cooling solutions, innovative genome-enabled selection tools should be developed in order to improve the resilience of dairy cattle to heat and associated nutritional stress in various geographical and managerial contexts (Friggens et al., Reference Friggens, Blanc, Berry and Puillet2017). Another strategy is to encourage the development and use of more robust and frugal breeds, especially for outdoor systems that are subject to environmental perturbations (Bieber et al., Reference Bieber, Wallenbeck, Leiber, Fuerst-Waltl, Winckler, Gullstrand, Walczak, Wojcik and Neff2019). Risk management strategies may also be developed, such as index insurances based on the expected effect of climatic stress on farm revenue (Vermeulen et al., Reference Vermeulen, Aggarwal, Ainslie, Angelone, Campbell, Challinor, Hansen, Ingram, Jarvis, Kristjanson, Lau, Nelson, Thornton and Wollenberg2012). Finally, the agricultural policy should be tailored to help dairy farmers in adapting their systems to climate change, to reinforce their training with the support of extension advisory services and to reinforce the second pillar of the CAP to reduce intensification.
Data
The EU FADN individual farm data are confidential and cannot be disclosed.
Author contributions
SM, SQ and FL conceived and designed the study. SQ and CG performed statistical analyses. SQ wrote the article. GC, IL and VE critically revised the paper. No other individuals meet the criteria for authorship.
Financial support
This research received funding from the GenTORE project; a Horizon 2020 project running from 1 June 2017 to 31 May 2022, as part of the European Union's H2020 Research and Innovation Program under agreement No. 727213.
Conflict of interest
The authors have no competing interests to declare.


 Open access