


Estimating the extent of intergenerational mobility and understanding how it differs between societies is of long-standing interest to economists and other social scientists. Recent research in the area explains differences in mobility as stemming primarily from cross-country differences in inequality as well as differences in the scope of public schooling to equalize opportunities for the young (Solon Reference Solon2002; Corak Reference Corak2013; Blanden Reference Blanden2013). The recent development of new complete-count census databases and “big historical data” of all kinds has revitalized historical research on these topics (Long and Ferrie Reference Long and Ferrie2007, Reference Long and Ferrie2013; Modalsli Reference Modalsli2017; Perez Reference Perez2019; Ward Reference Ward2020, Reference Ward2021). Two patterns are apparent in international comparisons of intergenerational mobility over the long run (Perez Reference Perez2019). First, prior to 1900, “New World” economies in the Americas demonstrated higher rates of mobility between sons and fathers than “Old World” economies in Europe. Second, rather than education and inequality, rapid population growth and access to abundant land resources have been identified as key determinants of mobility differences in the historical case.
Despite being a leading example of a land-abundant, expanding settler economy, little is known about Canadian mobility patterns before the 1950s. Canada shared similarities with the United States and other “New World” settler economies. The expansion of Canada West provided ample new land for settlement, with opportunities to enter farming or to move to new urban centers. Relative labor scarcity attracted internal migrants to new opportunities on the western frontier and drew immigrants from Europe and rural Canada to urban areas where industry and service-based activities were expanding rapidly. Historical scholarship on social mobility has, however, emphasized rigidities in the Canadian case, particularly relative to the United States. Porter (Reference Porter1965) highlighted the role of ethnicity, religion, and class as entry barriers to elite positions in Canada. One potential barrier to mobility is the linguistic divide between English and French Canadians. Studies of late-twentieth century occupational mobility have largely focused on this aspect of the Canadian experience, arguing that French Canadians experienced lower rates of intergenerational occupational mobility due to labor markets being segmented on language (McRoberts 1985). Such barriers would inhibit overall Canadian mobility and would also manifest themselves as regional differences between Quebec (predominantly French-speaking) and the rest of the country (predominantly English-speaking). Canadian regions also differed in education policy and the provision of public schooling in the late nineteenth century; the province of Ontario introduced compulsory schooling in the 1870s, while Quebec and parts of the Martimes (Eastern Canada) did not follow suit for several decades.
While recent research finds that intergenerational mobility today is significantly higher in Canada than in the United States (Corak and Heinz Reference Corak and Heinz1999; Chetty Reference Chetty, Brown, Buchholz, Davis and Gonzalez2016), an absence of data has meant that little is known about the extent of differences in historic mobility within the Canadian population, the path of Canadian intergenerational mobility over the longer run, and how it compares to other countries. In this paper, we use newly-linked records from Canadian census enumerations to provide evidence on late nineteenth century intergenerational mobility. These data represent the first attempt to create a comprehensive national historical sample of linked Canadian records.Footnote 1 The linkage exercise generates a sample of over 32,000 employed young men in 1901 connected to their childhood homes in 1871, and therefore the economic status of parents and household heads at that time. The data allow us to explore Canadian mobility patterns across regions, to contrast outcomes from the late nineteenth century with the late twentieth century, and to make comparisons with historical studies of inequality from other countries in Europe and the Americas. Given the relatively large sample of linked observations available to us, we decompose overall mobility differences into more detailed occupational transitions. These estimates provide important clues for how much differences across Canadian regions and between Canada and other countries were associated with the leading explanations for differences in mobility patterns.
Our regional estimates show that Quebec and the Maritimes exhibited significantly less intergenerational mobility than Ontario. We also find large differences in mobility by ethnicity, with English and French speakers being less mobile in regions where they are language minorities. Placing our findings for Canada in an international context, we find rates of intergenerational mobility that lie between those of the New World (the United States and Argentina) and the Old World (Europe). It appears that the Canadian mobility experience shared common features with other land-abundant societies, but access to the highest class occupations was much less fluid for many Canadians.
LINKED CANADIAN CENSUS DATA, 1871–1901
The data used in this paper are linked records from full-count databases of the Canadian Censuses between 1871 and 1901. Linked records over this 30-year span are drawn from successful consecutive linkages of 1871–81, 1881–91, and 1891–1901. We use a machine learning approach to link individual records. Time-invariant characteristics (age, sex, birth-place) are used to generate a feature vector for all records; these vectors then serve as inputs in a support vector machine (SVM) in which classification and matching take place. Supervised learning is initiated with matching based on validated links that form a test environment. The methodology derived from the test environment is then employed to link consecutive full-count census data. The SVM approach used here identifies unique matches at the outset (e.g., where one record in 1871 can unambiguously be linked to one record in 1881); multiple matches are disambiguated in a second stage using information on co-resident family members. A summary of the linking method, including information on the true links that train our SVM, is provided in Online Appendix A. More detailed information is reported in earlier publications (Antonie et al. 2014; Richards Reference Richards2013).
Our algorithm allows us to link approximately 15 percent of all records over any decade interval. Disambiguation roughly doubles the size of the linked sample, although the procedure used to sort between multiple candidate links over-represents individuals in families that remain co-resident over each 10-year window. A trade-off exists between increasing sample size and introducing linked records selected on less representative characteristics when using family information to disambiguate. Our view, similar to that of Helgertz et al. (Reference Helgertz, Joseph Price, Thompson, Ruggles and Fitch2022), is that this process is worth-while if it allows researchers to address questions where a large sample size is essential while also maintaining a low rate of false positive links (Antonie et al. Reference Antonie, Inwood, Minns and Summerfield2020).
Canadian Census data from 1871 and 1901 include a range of personal, household, and geographic characteristics: age, household size, place of birth, place of residence, ethnic origin, and religious affiliation. Individual earnings were first collected as part of the 1901 Census and are not available in the 1871 data. As a result, we take the path followed by most studies of mobility prior to 1950 by focusing on occupational outcomes. Focusing on occupations (rather than occupational incomes) allows us to situate our findings in the broader international literature. As occupations were not collected as part of the original complete-count digitization, we have subsequently added occupations by looking up selected images for 1871 and scraping them for 1901.Footnote 2
We follow the international literature in examining mobility across four broad occupational groups. We assign scraped occupational strings to these groups using the following procedure. First, we manually assign each string a four-digit occupation code from the OCCHISCO scheme prepared by IPUMS for U.S. data. We then convert OCCHISCO to the HISCO structure using a crosswalk between the two classification schemes.Footnote 3 HISCO codes are then placed into 12 HISCLASS categories, following the classification generated by van Leeuwen and Maas (2011). Finally, we take the 12 categories and place them into four broad groups: white-collar occupations, skilled and semi-skilled manual occupations, unskilled occupations, and farm occupations.Footnote 4 This approach, which follows Perez (Reference Perez2019) with minor modifications to accommodate occupation strings unique to the Canadian census, allows for the cleanest possible international comparisons.Footnote 5 Tests of sensitivity to the classification of potentially contestable occupational strings across the 12 HISCLASS groups reveal little or no effect on the resulting mobility calculations.Footnote 6 To alleviate concerns that intermediate steps in our occupation coding shape the results, we reproduce all of our main results in Online Appendix C with the four occupation groups created directly from the OCCHISCO codes, following the groupings used in Long and Ferrie (Reference Long and Ferrie2013).
A more substantial issue is whether or not the four occupational groups we use may conceal significant differences in mobility. In Online Appendix D1, we demonstrate that our results are not sensitive to an alternative five-way grouping that separates high-income white-collar occupations (professionals and proprietors) from medium- to low-income clerical and sales occupations. Online Appendix D2 shows that mobility patterns are similarly unchanged if we separate unskilled farm workers from other unskilled laborers.
Our assessment of mobility is based on male children aged 0 to 14 in 1871 (aged 30 to 44 in 1901), and male heads of households aged 18 to 88 in 1871, where both report a classifiable occupation.Footnote 7 For this population, we link 32,365 individuals between the 1871 and 1901 Census samples. This represents about 5 percent of the 1871 full-count census population in the age group; 65 percent of these linked records are unique links, with 35 percent added to the sample through disambiguation. Summary statistics for the linked sample are reported in Table 1.Footnote 8 We focus on male children in our analysis because of the low linkage rates for women due to changes in surname associated with marriage, and the strong likelihood that those women we can link (i.e., those with a constant surname in 1871 and 1901) were not representative of the population of young women as a whole. While we expect that the vast majority of male household heads were the fathers of the young men present in 1871, that enumeration did not enquire formally into family relationships among household members.Footnote 9 As linkage rates vary for different subsets of the population, we also present summary statistics with weights that account for relative linkage frequencies. This exercise has a negligible effect on the summary characteristics of our linked sample.Footnote 10
TABLE 1 LINKED AND UNLINKED SAMPLE CHARACTERISTICS, 1871

* = Significant at the 90 percent level.
** = Significant at the 95 percent level.
*** = Significant at the 99 percent level.
Notes: See text for sample descriptions. Significance tests are for differences between each unweighted sample and the linked sample. Full count sample limited to males aged 0 to 14 in 1871. Unique links refers to all three linkages: 71–81, 81–91, and 91–01. Head occupation “unclassified” are omitted. Children defined as individuals enumerated with the same household id age 0–17, inclusive. Anglophone includes ethnicities reported as English, Welsh, Scottish, Irish, and North American. Standard deviations for age in parentheses. Sample size for Column (1) is 732,798 for province of residence and 95,176 for head occupations.
Sources: 1871 complete count Canadian Census and linked 1871–1901 Canadian Census records.
Table 1 summarizes characteristics in 1871 from the complete-count data (Column 1) to compare to the linked sample (Column 2) for the same age cohort in order to assess the representativeness of the linked sample. This comparison gives some sense of the extent to which the linked sample is representative of the broader population. In addition to the unweighted sample in Column (2), we show 1871 summary statistics when linkage weights are applied (Column 3). Finally, we include the same descriptive measure for unique matches (Column 4) to give a sense of the potential implications of the disambiguation process used in our linkage method. By comparing the linked sample and full-count data, we see that linkage is somewhat skewed towards younger, anglophone individuals born in Ontario or the Maritimes. This difference may partly reflect lower literacy rates among older Francophones and errors among English-speaking enumerators, affecting French Canadians who moved over time. In addition, census information in parts of Quebec appears to be somewhat incomplete for 1901. In particular, occupations in Montreal are not recorded with the same consistency as in other parts of the country (and we do not use observations for which an occupation was unrecorded or unreadable). In comparison to the unweighted linked sample, it is not clear that disambiguation makes this situation much worse overall— unique links (Column 4) are only modestly closer on age and family size, while birthplaces are more mixed.
CANADIAN INTERGENERATIONAL MOBILITY
We begin our analysis of intergenerational mobility by constructing the transition matrix from a male head (father) occupation in 1871 to a young male (son) in 1901. Table 2a reports the number of observations and shares in each cell. The results show significant occupational continuity, particularly for high-skill occupations and farming. For non-farm occupations where there is an apparent skill hierarchy (white collar (W) > skilled/semi-skilled (S) > unskilled (U)), the Goodman and Kruskal (Reference Goodman and Kruskal1954) γ statistic is informative about the rank correlation of father-son occupation pairs. Our moderately positive estimate ![]() suggests that sons in higher-skill occupations were, more often than not, from a household where the father was also higher skilled.Footnote
11
These are clusters of occupations where substantial capital is often required. Table 2a also suggests greater upward mobility than downward mobility, with the proportions moving unambiguously up from unskilled or semi-skilled exceeding the share moving down from white collar or semi-skilled. As there are some dimensions in which unweighted sample proportions are some distance from complete count and weighted sample proportions in Table 1, we also provide the transition matrix for the weighted linked sample in Table 2b. Transition matrix shares are largely unaffected if observations are reweighted to account for linkage propensities.
suggests that sons in higher-skill occupations were, more often than not, from a household where the father was also higher skilled.Footnote
11
These are clusters of occupations where substantial capital is often required. Table 2a also suggests greater upward mobility than downward mobility, with the proportions moving unambiguously up from unskilled or semi-skilled exceeding the share moving down from white collar or semi-skilled. As there are some dimensions in which unweighted sample proportions are some distance from complete count and weighted sample proportions in Table 1, we also provide the transition matrix for the weighted linked sample in Table 2b. Transition matrix shares are largely unaffected if observations are reweighted to account for linkage propensities.
TABLE 2 FULL CANADIAN TRANSITION MATRIX, 1871–1901

Notes: Column shares in parentheses. Weighted values rounded to nearest integer. Linkage weights similar to Bailey, Cole, and Massey (Reference Bailey, Cole and Massey2020) are described in the main text.
Source: 1871–1901 linked Canadian Census records.
With over 32,000 linked observations between fathers and sons, we can compute measures of mobility for Canadian regions and for major subgroups of the Canadian population. We compute mobility estimates for three Canadian regions of origin: Ontario, Quebec, and the Maritimes. Ontario and Quebec were by far the largest provinces in Canada in 1871, while the Maritimes region combines the smaller east coast provinces of New Brunswick and Nova Scotia. In addition to size, there were significant differences in economic structure between the regions that could lead to mobility differences. As the region furthest to the West, Ontario was closer to the Canadian frontier than Quebec or the Maritimes, which would mean a lower cost to migrate to opportunities in labor-scarce environments. Ontario also saw more rapid urbanization after 1871 than the other regions, had more industry in 1871, and experienced faster industrial growth between 1871 and 1901.Footnote 12 Quebec is distinctive in that the majority of the population were primarily French-speaking Canadians, who had lower rates of outmigration to other parts of Canada in the late nineteenth and early twentieth centuries (Green, MacKinnon, and Minns Reference Green, MacKinnon and Minns2005). While Quebec was less urban and industrial than Ontario, Montreal was the largest city in Canada at this time and the economic center of the country. The Maritime region was relatively remote to opportunities on the Western frontier; much of the region urbanized more slowly and experienced slower rates of growth and structural change in this period (Inwood Reference Inwood1991; Inwood and Irwin Reference Inwood and Irwin2002).
We also compute mobility measures for Francophones and Anglophone Canadians (French-speaking or English-speaking). French Canadians had lower quantity and quality of education, on average, than English Canadians and were far less likely to migrate between Canadian regions than their English-speaking counterparts. If language presented barriers to intergenerational mobility, there should be evidence of differences between English and French Canadians and between those of Quebec origin and the rest of Canada. Differences between language groups have been at the forefront of much of the previous research on late twentieth-century mobility in Canada, with most of the emphasis on French/ English differences within Quebec (McRoberts 1985). More broadly, differences in late nineteenth century economic structures among Ontario, Quebec, and the Maritime provinces are well known, but how they might be connected to rates of intergenerational mobility remains untested.
To summarize mobility for different groups and origin regions in Canada, we calculate Altham statistics (Altham Reference Altham1970; Altham and Ferrie 2007) to measure intergenerational mobility patterns between different groups within the Canadian population. The general form of this statistic d( P,Q ) compares the column-row associations between any two contingency tables P and Q with r rows and s columns using the following formula:
 $$d(P,Q) = {\left[ {\sum\nolimits_{i = 1}^r {\sum\nolimits_{j = 1}^r {\sum\nolimits_{l = 1}^r {\sum _{m = 1}^s} } } {{\left| {\log \left[ {{{{p_{ij}}{p_{lm}}{q_{im}}{q_{lj}}} \over {{p_{im\,}}{p_{lj}}{q_{ij}}{q_{lm}}}}} \right]} \right|}^2}} \right]^{1/2}},$$
When a counterfactual table J with independent rows and columns is used as the comparison, d( P,J ) provides a ranking of mobility in table P against the benchmark of complete occupational mobility.Footnote 13 We compute d( P,J ) for Canada 1871–1901, for each of the three regions, and for Francophone/Anglophone splits. We then compute pairwise comparisons d( P,Q ) to verify whether differences in these rankings of Altham statistics across these tables are statistically significant. The likelihood ratio statistic, G 2, can be used to test a null hypothesis that column and row associations across the two tables do not differ (Agresti Reference Agresti2002).Footnote 14 Our ( P,Q ) comparisons include Ontario to Quebec and to the Maritimes, and Francophones to Anglophones.
Table 3 begins by comparing Altham statistics from our baseline 1871– 1901 Canadian sample with comparable results from the weighted sample and from an additional sample restricted to unique links. The figures show only minor changes when the weighted sample is used for such calculations. Limiting attention to unique links does reduce estimated mobility more substantially, but the associated increase in the Altham Statistic does not change Canada’s position relative to comparison countries in the following section. Based on these results, the disaggregated estimates that follow in the table use the unweighted sample that includes disambiguated links.
TABLE 3 CANADIAN ALTHAM STATISTICS

* = Significant at the 90 percent level.
** = Significant at the 95 percent level.
*** = Significant at the 99 percent level.
Notes: G 2 for weighted sample calculated using normalized inverse propensity score weights that sum to N. Regional classification scheme is based on 1871 region of residence, Ethnicity French or Anglophone (English, Welsh, Irish, Scottish, or North American) based on 1871 household. Base sample ( P ) for comparisons is row 1.
Column (1): Distance from row/column independence (
J
), to base sample (
P
) Column (2): Likelihood Ratio test statistic ![]() , akin to testing H : d(
P,J
) = 0
, akin to testing H : d(
P,J
) = 0
Column (3): Distance from independence ( J ) to comparison mobility table (Q)
Column (4): Likelihood Ratio test statistic ![]() , akin to testing H : d(
Q,J
) = 0
, akin to testing H : d(
Q,J
) = 0
Column (5): Distance between base transition matrix ( P ) and each comparison country’s transition matrix ( Q )
Column (6): Likelihood Ratio test statistic ![]() , akin to testing H : d(
P,Q
) = 0
, akin to testing H : d(
P,Q
) = 0
Source: 1871–1901 linked Canadian Census records.
The patterns documented in Table 3 reveal a clear ranking in terms of mobility by region of origin. Ontario sits comfortably ahead of the Maritimes and Quebec, with the differences between each significant at the 1 percent level.Footnote 15 In the Canadian context, therefore, the region with the most diverse economic structure and proximity to a labor-scarce frontier had the highest rates of mobility. Differences in the Altham statistic between Francophones and Anglophones contribute to lower rates of mobility in Quebec, reinforcing the idea that language-based differences in mobility were present in Canadian labor markets at the beginning of the twentieth century. Comparison of the regional results with anglophone/ francophone differences invites the question of whether the modest-looking mobility gap between French speakers and English speakers mostly reflects the geographical distribution of each population across regions.
While sample sizes are much smaller, we have also calculated Altham statistics for Anglophone and Francophone Canadians within Quebec and outside of Quebec. The most striking pattern here is the particularly low mobility among French-speakers outside of Quebec, with an Altham statistic of close to 20. As we will see in the section on international comparisons, the statistic for Francophones outside of Quebec is relatively close to the mobility score of less mobile European countries. We also find lower mobility among Anglophones in Quebec than among Francophones. These patterns support the story of segmented regional labor markets, with fewer fluid intergenerational opportunities for language minorities in all parts of the country.
One disadvantage of the Altham statistic is that it masks which particular intergenerational transitions are responsible for the variation in overall mobility. Therefore, while the results so far speak effectively to differences in mobility experienced by language groups in different parts of the country, other explanations may be better understood by unpacking the structure of intergenerational mobility into more fine-grained occupational transitions. We follow Modalsli (Reference Modalsli2017) and compute two-way odds ratios Θ i,i to measure the likelihood of same-occupation across generations p ii /(1 – p ii ), normalized to account for the availability of occupation i relative to all other occupations (–i). We extend this calculation to examine two-way odds ratios for all intergenerational comparisons,
 $${\Theta _{i,j}} = \ln \left[ {{{{p_{ij}}/(l - {p_{ij}})} \over {{p_{ - ij}}/(l - {p_{ij}})}}} \right].$$
Table 4 displays the matrix of exp(Θ i,j ). The diagonal elements, exp(Θ i,i ) provide a metric similar in spirit to measures of dynastic bias computed by Dal Bó, Dal Bó, and Snyder (Reference Dal Bó, Dal Bó and Snyder2009) that indicate the extent to which the second generation was over-represented in the occupational group of their father, depending on how far the odds ratio lies above one. The off-diagonal elements show whether sons were over- or under-represented in each intergenerational occupational transition.
TABLE 4 TWO-WAY ODDS RATIOS OF RELATIVE REPRESENTATION OF SONS BY FATHER OCCUPATION

Notes: Authors’ calculations of e Θi,j . Odds ratios Θ i,j are calculated following Equation (2). Standard errors in parentheses calculated from Agresti (Reference Agresti2002, eq. 3.1).
Source: 1871–1901 linked Census records. See text for further details.
In Figure 1, we offer a visual comparison of two-way odds ratios for Quebec, Maritimes, and Ontario, by presenting the relative odds ratios between Ontario and the other two regions. The relative ratios are plotted on a log scale for symmetry. This means that a relative ratio of zero indicates identical odds ratios. We extend this approach to compare Francophones and Anglophones nationally (Figure 2a), as well as the split comparison inside and outside of Quebec (Figure 2b).

FIGURE 1 RELATIVE ODDS-RATIOS FOR OCCUPATIONAL TRANSITIONS IN CANADIAN REGIONS
Notes: Figures are the log ratio of odds-ratios for father-son occupational transitions between two sectors. See the text for details on how odds-ratios are computed. W = white collar, S = skilled and semi-skilled, U = unskilled, F = farm operator.
Source: 1871–1901 linked Canadian Census records.

FIGURE 2 RELATIVE ODDS-RATIOS FOR OCCUPATIONAL TRANSITIONS BY LANGUAGE GROUP
Notes: Figures are the log ratio of odds-ratios for father-son occupational transitions between two sectors. See the text for details on how odds-ratios are computed. W = white collar, S = skilled and semi-skilled, U = unskilled, F = farm operator.
Source: 1871–1901 linked Canadian Census records.
Comparisons of the three Canadian regions reveal that higher mobility in Ontario is associated with less intergenerational persistence in white-collar occupations (though the odds ratio is still quite high), farming, and especially unskilled work. Perhaps the most striking finding is that the sons of unskilled fathers in Ontario are more overrepresented in skilled and semi-skilled jobs than in their father’s occupation class, in stark contrast to the other two regions. This indicates that a key difference between Ontario and the rest of the country was more fluid movement up from the bottom of the occupational ladder. There are several reasons why sons from Ontario may have seen relatively more upward mobility than the sons of modest parents. As discussed earlier, Ontario had a more diverse economic structure than other parts of Canada, which would be associated with greater demand for skilled and semi-skilled work in growing urban areas. On the supply side, Ontario introduced compulsory schooling in 1871, more than a decade earlier than Nova Scotia (1883) and several decades ahead of New Brunswick (1905) or Quebec (1942) (Phillips Reference Phillips1957). Contemporary evidence suggests that mandating additional education reduced the likelihood of working in a manual occupation in those treated by the mandate (Oreopoulos Reference Oreopoulos2006); our findings for Ontario’s pattern of intergenerational mobility are consistent with a similar effect for the sons of unskilled workers who were in effect raised in the only province with compulsory schooling during their childhood years.
Comparisons of English- and French-speaking Canadians show a more modest pattern of greater intergenerational persistence in white collar, farm, and unskilled activities among Francophones (Figure 2a). In comparing francophones and anglophones within and outside of Quebec (Figure 2b), it appears that high persistence in white-collar work (and to a lesser extent, unskilled) is a major contributor to low mobility among French-speaking Canadians. Within Quebec, we find similar high persistence in white-collar work matched by the farm sector for English-speaking Canadians, who actually appear fairly mobile relative to francophones in both manual sectors. While much of the evidence indicates fluid intergenerational progress in Canadian labor markets, access to the top of the job ladder for language minorities is much more restricted.
We also compare intergenerational mobility between 1871 and 1901 to more recent Canadian data from the 1973 Job Mobility Survey (JMS) and the 1986 General Social Survey (GSS).Footnote 16 The two twentieth-century surveys consist of cross-sections that asked respondents about the occupation of their parents when the respondents were age 14 or 16. Table 5 presents Altham Statistics for the three periods when we impose similar age restrictions for sons in each case. These comparisons show a decline in Canadian occupational mobility over the century, with the Altham Statistics rising from 16.0 to 19.6 in the 1973 JMS and 22.6 in the 1986 GSS. This fall in occupational mobility is remarkably similar to patterns reported by Long and Ferrie (Reference Long and Ferrie2013) for the United States.Footnote 17 If the American dream moved to Canada by the twenty-first century, we see little evidence of that migration having taken place by the 1980s, at least in terms of occupational outcomes.
TABLE 5 CANADIAN INTERGENERATIONAL MOBILITY FROM 1901 TO 1986

* = Significant at the 90 percent level.
** = Significant at the 95 percent level.
*** = Significant at the 99 percent level.
Notes: See the text and footnote 18 for information on how we classified occupations over time. Base sample ( P ) for comparisons is row 1.
Column (1): Distance from row/column independence (
J
), to base sample (
P
) Column (2): Likelihood Ratio test statistic ![]() , akin to testing H : d(
P,J
) = 0
, akin to testing H : d(
P,J
) = 0
Column (3): Distance from independence (
J
) to comparison mobility table (Q) Column (4): Likelihood Ratio test statistic ![]() , akin to testing H : d(
Q,J
) = 0
, akin to testing H : d(
Q,J
) = 0
Column (5): Distance between base transition matrix ( P ) and each comparison country’s transition matrix ( Q )
Column (6): Likelihood Ratio test statistic ![]() , akin to testing H : d(
P,Q
) = 0
, akin to testing H : d(
P,Q
) = 0
Sources: CAN 1871–1901 refers to 1871–1901 linked Canadian Census records. JMS 1973 is the Canadian Job Mobility Survey, GSS 1986 the Canadian General Social Survey.
INTERNATIONAL COMPARISONS
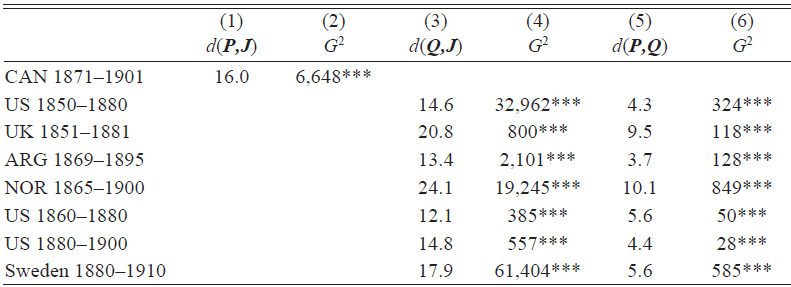
Where does Canadian historic mobility sit between the New World and Old World models? We use the mobility measures outlined previously to compare intergenerational mobility in Canada to six comparable international samples. Table 6 compares Altham statistics for Canada to figures computed from transition matrices for 20-year spans from the US 1860–1880 and 1880–1900 (Long and Ferrie Reference Long and Ferrie2013, Table 5), a 26-year span from Argentina during 1869–1895 and 30-year spans in the US 1850–1880 and the UK 1851–1881 (Perez Reference Perez2019, Table 1), a 30-year span in Sweden 1880–1910 (Berger et al. Reference Berger, Engzell, Eriksson and Molinder2021, table A.5), and a 35-year span in Norway 1865–1900 (Modalsli Reference Modalsli2017, table A5b).Footnote 18
TABLE 6 ALTHAM STATISTICS FOR CANADA 1871–1901 AND COMPARISON COUNTRIES
* = Significant at the 90 percent level.
** = Significant at the 95 percent level.
*** = Significant at the 99 percent level.
Notes:
Column (1): Distance from row/column independence (J), to Canada 1871–1901 (P)
Column (2): Likelihood Ratio test statistic ![]() , akin to testing H : d(P,J) = 0
, akin to testing H : d(P,J) = 0
Column (3): Distance from independence (J) to comparison mobility table (Q)
Column (4): Likelihood Ratio test statistic ![]() , akin to testing H : d(Q,J) = 0
, akin to testing H : d(Q,J) = 0
Column (5): Distance between Canadian transition matrix (P) and each comparison country’s transition matrix (Q)
Column (6): Likelihood Ratio test statistic ![]() , akin to testing H : d(P,Q) = 0
, akin to testing H : d(P,Q) = 0
Sources: CAN 1871–1901 refers to 1871–1901 linked Canadian Census records. Twenty-year U.S. figures (1860–1880 and 1880–1900) calculated from transition matrices in Long and Ferrie (Reference Long and Ferrie2013). Argentine figures and 30-year U.S. and U.K. figures (1850–1880 and 1851–1881) calculated from transition matrix in Perez (Reference Perez2019). Norwegian figures calculated from transition matrix in the Appendix of Modalsli (Reference Modalsli2017). Swedish figures calculated from transition matrix in the Appendix of Berger et al. (Reference Berger, Engzell, Eriksson and Molinder2021).
Comparing occupational holdings to independence (d(P,J)) shows that Canadian intergenerational mobility has a clear rank position between the more mobile New World economies (Argentina and the United States) and less mobile Old World European economies (Norway, Sweden, and the United Kingdom). Note also that results for all three Canadian regions (Table 4) lie in the same interval between US 1850–1880 and Sweden 1880–1910. That Canada lay somewhere on the mid-point between the United States/Argentina and Sweden is reinforced by measures of the distance in column/row associations between each pair of occupational matrices d(P,Q). Canadian mobility patterns are close to equidistant between Argentina, US 1850–1880, and Sweden (d(P,Q) of 3.9, 4.0, and 4.7), and much further from Norway or the United Kingdom (d(P,Q) of 10.1 and 10.2).
Differences in linkage methodologies, enumeration practice, and the granularity of complete count-data across these samples may affect the extent of false links, which would have implications for estimates of intergenerational mobility. Our measure of Canadian intergenerational mobility may be lower due to the consecutive linkage approach producing fewer false-positives than in samples generated by direct linkage between two single surveys. A comparison of parental surname mismatch rates (the share of links where parent surnames were different in 1871 and 1901 among sons living with their parents in both years) is used to estimate the extent of false linkage in both our successive linkage approach and direct linkage from 1871 to 1901. Under this definition, 14 percent of links are false positives in consecutive linkage and 28 percent with direct linkage over 30 years.
We illustrate the implications for mobility estimates by simulating additional false links. Father occupations are reassigned to a proportion of randomly selected linked pairs. Reassigned occupations are drawn from the 1871 distribution of men of the appropriate age and region in either the complete-count Census or our estimation sample. Figure 3 shows that simulating additional false matches among 15 percent of our sample (similar to the difference in the linking methodology) would bring Canadian mobility estimates quite close to the United States (and Argentine) levels and suggests that baseline differences in mobility between the three countries may be overstated.

FIGURE 3 SIMULATED ALTHAM STATISTICS WITH INCREASING RATES OF FALSE MATCHES
Notes: Mean Altham statistics for Canada 1871–1901 from simulations with various proportions of false father-son links. A proportion of linked observations are selected with uniform probability. Selected observations have father occupations replaced with a random draw from the occupation distribution for men of the same five-year age group and region from the stated sample (linked or full-count). Age groups are 18–22, … 78–82, 83–88 and regions are Ontario, Quebec, Maritimes, and other. Means are calculated from 100 simulations at each sample proportion from 1–50 percent. A single standard deviation on either side of the mean is represented with shading.
Source: 1871–1901 linked Canadian Census records. See text for further details.
To explore the underlying occupational trends that account for mobility differences between Canada and other countries, we present two-way odds ratios for each economy in Table 7. Here we limit attention to the six samples for which we have longer linkage windows and exclude US 1860–1880 and US 1880–1900. Figure 4 compares log relative odds ratios between each country and Canada.
TABLE 7 TWO-WAY ODDS RATIOS OF RELATIVE REPRESENTATION OF SONS BY FATHER OCCUPATION
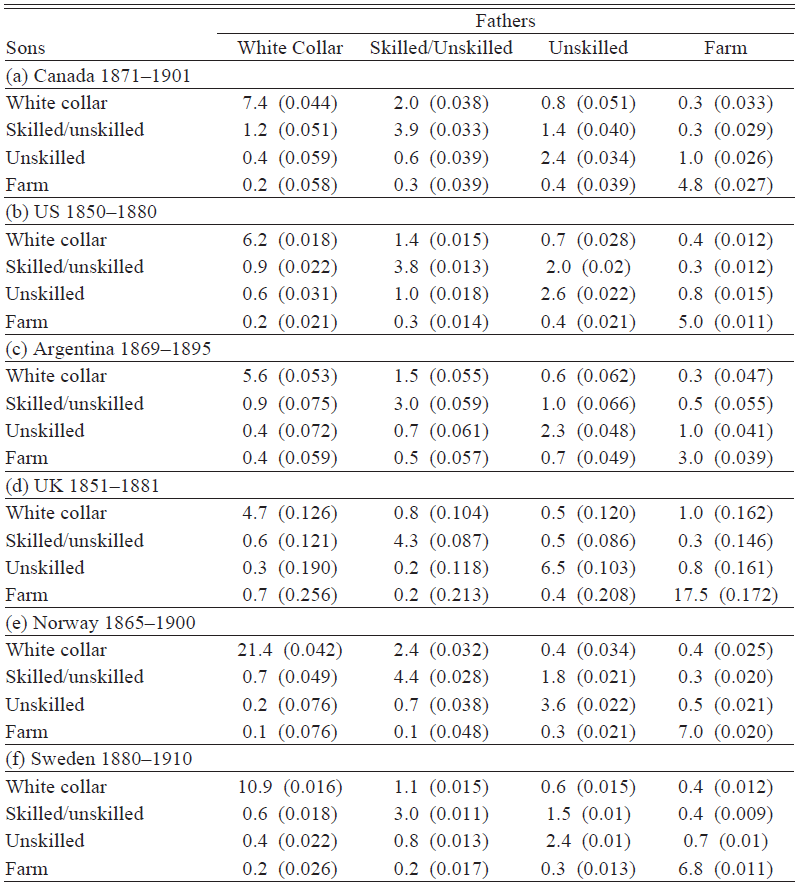
Notes: Authors’ calculations of e Θi,j . Odds ratios Θ i,j are calculated following Equation (2). Standard errors in parentheses calculated from Agresti (Reference Agresti2002, eq. 3.1).
Sources: Canada 1871–1901 refer to 1871–1901 linked Canadian Census records. Argentine figures and 30-year U.S. and U.K. figures (1850–1880 and 1851–1881) calculated from transition matrix in Perez (Reference Perez2019). Norwegian figures calculated from transition matrix in the Appendix of Modalsli (Reference Modalsli2017). Swedish figures calculated from transition matrix in the Appendix of Berger et al. (Reference Berger, Engzell, Eriksson and Molinder2021).

FIGURE 4 RELATIVE ODDS-RATIOS FOR OCCUPATIONAL TRANSITIONS – INTERNATIONAL COMPARISONS
Notes: Figures are the log ratio of odds-ratios for father-son occupational transitions between two sectors. See the text for details on how odds-ratios are computed. W = white collar, S = skilled and semi-skilled, U = unskilled, F = farm operator. Filled markers represent comparisons of Canada to other economies in the Americas. Hollow markers represent comparisons of Canada to European economies.
Sources: Canadian data from 1871–1901 linked Canadian Census records. Argentine figures and 30-year U.S. and U.K. figures (1850–1880 and 1851–1881) calculated from transition matrix in Perez (Reference Perez2019). Norwegian figures calculated from transition matrix in the Appendix of Modalsli (Reference Modalsli2017). Swedish figures calculated from transition matrix in the Appendix of Berger et al. (Reference Berger, Engzell, Eriksson and Molinder2021).
The focus on occupational transitions through the two-way odds ratios in Table 6 provides clear indications of which parts of each economy feature particularly high or low mobility rates. New World comparisons among Canada, the United States, and Argentina show higher rates of persistence in white-collar occupations (relative immobility) in Canada as contributing factors for somewhat lower overall mobility in Table 6, though Canada shares the common New World feature of relatively fluid mobility out of manual occupations in skilled/semi-skilled and unskilled work. Relative persistence in white-collar occupations as compared to the United States is seen in all Canadian regions (Table 4) and appears to be one feature of the Canadian mobility experience that diverges consistently from that of its southern neighbor.
Sharper differences are evident when comparing Canada and other New World economies to Europe. Persistence in farming was notably higher in all European economies. A similar picture of stronger occupational inheritance is apparent in white-collar work in Norway and Sweden. The odds ratio on white-collar persistence is quite a bit lower in British data, but this reflects a relatively high rate of transition into agriculture (a sector that encompasses a range of economic outcomes, including elite status for some), while movement into skilled manual activities is less prevalent than in the New World economies. At the other end of the occupational distribution, persistence in unskilled work in the United Kingdom and Norway was much higher than in any New World settings (including the less mobile Canadian regions), while persistence in skilled work appears only modestly larger. Mobility out of manual work in Sweden appears to be comparable to the New World case studies. Broadly speaking, Canada shared the New World pattern of high mobility out of unskilled work and farming, but looks a bit more European in terms of persistence in elite occupations. The other intermediate case is Sweden, which has high persistence in farm and white-collar work, where access to capital and ownership are important, but appears quite mobile in manual occupations.Footnote 19
Given the importance of differences in occupational persistence in farming and white-collar work in explaining mobility patterns across the six countries, we have also computed partial Altham Statistics (see Modasli 2017) that allow for comparisons of the contributions of persistence in each of the four sectors as well as estimates of overall mobility net of the persistence in each sector.Footnote 20 Table 8 lists the full set of partial Altham Statistics, one for each of the four occupational groupings.
TABLE 8 PARTIAL ALTHAM STATISTICS

Notes: See text for calculation details.
Sources: CAN 1871–1901 refer to 1871–1901 linked Census records. Argentine figures and 30-year U.S. and U.K. figures (1850–1880 and 1851–1881) calculated from transition matrix in Perez (Reference Perez2019). Norwegian figures calculated from transition matrix in the Appendix of Modalsli (Reference Modalsli2017). Swedish figures calculated from transition matrix in the Appendix of Berger et al. (Reference Berger, Engzell, Eriksson and Molinder2021).
The partial Altham Statistics confirm the importance of the high level of persistence in two key sectors identified in the odds ratios in Table 7. Partitioning on white-collar persistence confirms that mobility differences outside of this sector were relatively modest in the New World and that Swedish mobility outside of the white-collar occupation category was relatively close to that across the Atlantic.Footnote 21 As one would predict from the pattern of odds ratios shown earlier, Altham Statistics partitioned on farming show lower mobility gaps away from agriculture, particularly within the New World. These results make clear that mobility differences between European and American economies were not due to structural differences between settlers and more industrialized economies.
How do these international comparisons speak to the explanations for mobility differences outlined earlier? First, the substantial structural differences in mobility between Canada and European economies are consistent with the opportunities associated with population growth and territorial expansion identified for other New World economies by Perez (Reference Perez2019). However, mobility rates in white-collar work were lower than in the United States or Argentina. Fully explaining these differences is difficult with a small number of countries and the obvious issues associated with measuring mobility in different country contexts, but two ideas from the literature appear relevant here. First, we note from our aggregated and disaggregated results that Ontario’s mobility experience, particularly for Anglophones, was more like that seen in the United States and Argentina, with less evidence of sticky mobility in white-collar work. Hence, language barriers unique to Canada may have created a wedge not present in Argentina and the United States. This pattern provides some indirect support for Porter’s (1965) views regarding the exclusive nature of elite occupations in Canada, with language serving to exclude many from accessing prime positions. Second, the benefits of growth and expansion were less accessible to Canadians in the eastern part of the country, where local urban expansion and industrial growth were modest and frontier opportunities were several thousand kilometers away. In 1871, roughly 55 percent of the Canadian population lived in Quebec and the Maritimes, and the mobility benefits of population and land expansion were more muted here than in many parts of the New World.
CONCLUSIONS
Our analysis of intergenerational mobility in late nineteenth-century Canada provides a first glimpse of father-son occupational continuity patterns prior to the 1950s. We find notable differences between Canadian regions: the highest mobility rates were in Ontario, where mobility among the sons of men who held unskilled occupations in 1871 was particularly high. We also find higher rates of mobility among Anglophone Canadians than French Canadians, but with a striking contrast between the two groups inside and outside of Quebec, with minority language speakers experiencing less intergenerational mobility. Ontario’s relative lead in introducing compulsory schooling may be associated with high mobility rates at the bottom of the occupational ladder; labor market segmentation by language appears to have played a greater role in explaining access to white-collar positions.
Put in an international context, our results fit well with the view of Canada as a “mid-Atlantic” economy and society that shared characteristics of both New World and Old World labor markets. Aggregate Canadian mobility lay about midway between Argentina/United States and Sweden, the most mobile of European economies for which we have evidence. Higher mobility rates relative to European economies for most occupational transitions are consistent with the broad differences between New and Old World economies as regards population growth and land availability. Where Canadian mobility lagged behind that of the other New World economies was through greater persistence in white-collar occupations and farming. This may in part reflect a greater distance to the frontier for many Canadians in 1871. In addition, as these sectors include many occupations where ownership and access to capital are often prerequisites, this pattern supports the views of Canadian sociologists describing restricted access to elite occupations in the mid-twentieth century (Porter Reference Porter1965), particularly in reference to the United States. Our regional analysis of Canada shows that the divided linguistic landscape of Canada complements this view—Anglophone men raised in Ontario had mobility patterns across sectors much more like their neighbors to the south than Canadians from Quebec and the eastern part of the country. Finally, extending our core findings with evidence from the 1970s and 1980s indicates that Canadian mobility trends did not diverge from those in the United States until the end of the twentieth century.
These first internal and international comparisons can be reinforced in future work that fully exploits the large sample of linked individual records now available. Individual-level analysis of mobility outcomes should be instructive in revealing how language may have interacted with geographical mobility to shape intergenerational outcomes for linguistic minorities. Shifting the focus from regions to smaller geographical units will reveal where local opportunities lay a century ago, and comparisons to present-day Canadian patterns (Corak Reference Corak2020) may be informative in understanding why Canadian mobility rates have held up better over time than elsewhere in the Americas.

 where
where 


 Open access