


Introduction
The COVID-19 pandemic is the largest public health crisis in recent history. With the discovery and mass production of efficacious vaccines against the virus, motivating uptake of the vaccines has emerged as a critical challenge in the United States. To this end, a number of incentives and encouragement strategies have been implemented in the United States, ranging from free beer to saving bonds (Kmietowicz Reference Kmietowicz2021; Treisman Reference Treisman2021). Because of the rapid pace of the pandemic and response efforts, however, little is yet known about the effectiveness of these programs and whether they can help contain the virus in the United States (Mandvalli Reference Mandvalli2021).
Lotteries are a potentially powerful and low cost way to encourage vaccination that have been shown to induce behavior change in financial (Gertler et al. Reference Gertler, Higgins, Scott and Seira2018) and health behaviors (Van Der Swaluw et al. Reference Van Der Swaluw, Lambooij, Mathijssen, Schipper, Zeelenberg, Berkhout and Prast2018). Particularly in the context of vaccination, lotteries may be an effective incentive in that they are uniquely attractive to risk-preferring individuals.
Prior work finds risk preference is positively correlated with vaccine skepticism (Massin et al. Reference Massin, Ventelou, Nebout, Verger and Pulcini2015), suggesting that the vaccine-hesitant may be uniquely high in risk preference and thus uniquely responsive to lottery incentive programs.
Additionally, individuals who systematically overestimate low-probability events, such as adverse vaccine reactions, may also systematically overestimate the probabilities of winning a lottery (Camerer and Kunreuther Reference Camerer and Kunreuther1989). Lastly, prior work finds that low-income communities are less likely to get vaccinated but also more likely to have high participation rates in lotteries (Price and Novak Reference Price and Novak1999; Razai et al. Reference Razai, Osama, McKechnie and Majeed2021; Soares et al. Reference Soares, Rocha, Moniz, Gama, Laires, Pedro and Nunes2021). For these reasons, lotteries may effectively encourage individuals to vaccinate where other strategies have failed.
Yet despite these appealing factors, there are serious concerns about whether and how individuals should be compensated for obtaining COVID-19 vaccinations. Efforts to promote uptake of the human papillomavirus (HPV) vaccine illustrate the uncertainty and challenges associated with incentivizing vaccination. One randomized controlled trial in the United Kingdom found that financial compensation boosted HPV vaccination rates in participants by nearly ten percentage points (Mantzari et al. Reference Mantzari, Vogt and Marteau2015). However, in a different context when community health service providers in the Netherlands offered raffles for iPods in exchange for receiving the HPV vaccine, these communities subsequently had lower vaccination rates and the vaccination initiative received negative media coverage (Rondy et al. Reference Rondy, Van Lier, Van de Kassteele, Rust and De Melker2010).
Vaccine promotion efforts have also faced political challenges (Intlekofer et al. Reference Intlekofer, Cunningham and Caplan2012; Haber et al. Reference Haber, Malow and Zimet2007), including opposition based on the cost of compensating vaccine recipients (Buchanon Reference Buchanon2021). Similar sentiments have been shared with regard to COVID-19 vaccination efforts, including concerns that payment to individuals erodes intrinsic motivation, is coercive, and could reduce confidence in the vaccine’s safety (Largent and Miller Reference Largent and Miller2021). While the benefits of increasing vaccination rates may outweigh potential ethical concerns (Persad and Emanuel Reference Persad and Emanuel2021), the optimal compensation strategy for staggered treatments – such as the Moderna and Pfizer vaccines – is not obvious (Higgins et al. Reference Higgins, Klemperer and Coleman2021):
These concerns speak to a larger issue of how to evaluate the efficacy of these vaccination efforts. To increase vaccination rates, lotteries could induce individuals who would never get vaccinated otherwise, or they could cause individuals to vaccinate sooner than they would have otherwise. Alternatively, lotteries may have no impact on vaccination, or even discourage individuals from vaccinating. The relative composition of these effects may make the net impact of vaccination lotteries positive, transitory, or deleterious (Buttenheim and Asch Reference Buttenheim and Asch2013; Cryder et al. Reference Cryder, London, Volpp and Loewenstein2010).
In this paper, we present a pre-registered analysis of a program intervention that offered vaccine excipients a chance to participate in a series of million dollar lotteries if they had received their first vaccination prior to the weekly drawing. Despite early results suggesting Ohioans increased their first doses in response to this lottery announcement (Ohio Department of Public Health 2021), results of subsequent studies of Ohio’s lottery program have been mixed (Mallow et al. Reference Mallow, Enis, Wackler and Hooker2021; Robertson et al. Reference Robertson, Schaefer and Scheitrum2021; Walkey et al. Reference Walkey, Law and Bosch2021; Brehm et al. Reference Brehm, Brehm and Saavedra2021; Barber and West Reference Barber and West2021; Thirumurthy et al. Reference Thirumurthy, Milkman, Volpp, Buttenheim and Pope2021; Sehgal Reference Sehgal2021). Developments in the social sciences over the last decade have made it clear that “researcher degrees of freedom” are a significant problem leading to over-identification of treatment effects when none exist (Simmons et al. Reference Simmons, Nelson and Simonsohn2011; Brodeur et al. Reference Brodeur, Cook and Heyes2018; Blanco-Perez and Brodeur Reference Blanco-Perez and Brodeur2020). Our analysis is distinct in that we pre-registered our analysis plan, including code for data processing, outcome selection, and model weights, ensuring that our analysis was neither intentionally nor unintentionally biased towards finding a specific result (Gelman and Loken Reference Gelman and Loken2013; Munafò et al. Reference Munafò, Nosek, Bishop, Button, Chambers, Du Sert and Ioannidis2017). We couple this analysis with a multiverse analysis of 216 alternative specifications. While pre-specifying our analysis plan ensures that we did not cherry pick a particular model, other modeling choices may lead to a more efficient estimate of the true treatment effect (Ferman et al. Reference Ferman, Pinto and Possebom2020). The multiverse analysis examines the robustness of the pre-registered results to the use of alternative outcomes, covariate selection, time-frames, and modeling methods (Steegen et al. Reference Steegen, Tuerlinckx, Gelman and Vanpaemel2016).
We hypothesized that because lotteries offer incentives that may be uniquely motivating to many unvaccinated individuals, we would see a relative increase in vaccination rates in Ohio following the opening of the “Vax-a-million” lottery compared to states that were similar before the lottery announcement. Contrary to our expectations, our results are most consistent with a decrease in vaccinations in Ohio following the lottery. However, our pre-registered analysis is unable to conclusively state whether the lottery had positive or negative effects. While absence of evidence is not the same as evidence of absence, this result should caution other states that are considering using lottery incentives to increase vaccine turnout. Details of the policy intervention and our specific causal inference strategy follow.
Data
The focal program we study is called Vax-a-Million Footnote 1 . The intervention was announced on May 12, 2021 by Ohio Governor Mike Dewine. Starting on May 26, a weekly lottery drawing was conducted through June 23, 2021. All Ohio residents who were 18 years or older and entered to participate in the lottery were eligible to receive a one-million dollar prize if they had received their first dose by the date of the drawing.
The focal outcome of our study comes from Our World in Data’s COVID-19 vaccination database, which uses numbers published by the US Center for Disease Control (CDC) (Mathieu et al. Reference Mathieu, Ritchie, Ortiz-Ospina, Roser, Hasell, Appel and Rodés- Guirao2021). The measure counts the percentage of individuals that are fully vaccinated in each US state. We chose this to be our outcome measure because it is aligned with the stated public policy goals of the State of Ohio (DeWine Reference DeWine2021). The full vaccination outcome has become particularly significant with the rise of virus variants that are more virulent to single doses (Bernal et al. Reference Bernal, Andrews, Gower, Gallagher, Simmons, Thelwall, Stowe, Tessier, Groves, Dabrera, Myers, Campbell, Amirthalingam, Edmunds, Zambon, Brown, Hopkins, Chand and Ramsay2021). Notably, this measure requires that individuals who receive either the Pfizer or Moderna vaccines must receive two doses to count as fully vaccinated.
We plot fully vaccinated rates in each state in Figure 1. At the time of the lottery announcement, Ohio was in the middle of the distribution, ranking as the 25th most vaccinated state with 37.4% of the entire population being fully vaccinated. On the day after the final lottery drawing, Ohio had slipped three positions to the 28th most vaccinated state with 43.7% percent of the population fully vaccinated.

Figure 1. Vaccination Rates by State.
All data are aggregated to the week level. All subsequent plots and analyses are recentered and denominated in weeks relative to the lottery announcement to facilitate communication. While vaccination data are updated daily, there is substantial noise and missing data in the daily numbers as records are omitted from one day and reported on the next. Thus, weekly aggregation smooths daily fluctuation in reported vaccinations.
Methods
We use a synthetic control methodology to create the counterfactual vaccination outcome for Ohio. This technique is useful for cases where a single-aggregated unit such as a state or country receives a treatment (Abadie and Gardeazabal Reference Abadie and Gardeazabal2003; Abadie et al. Reference Abadie, Diamond and Hainmueller2010). One can then create a synthetic version of a state by constructing a convex combination of other states (the donor pool) using either pre-treatment outcomes and/or other relevant covariates. Researchers have recently used synthetic control methods to estimate the effectiveness of California’s shelter in place orders at the beginning of the COVID-19 pandemic (Friedson et al. Reference Friedson, McNichols, Sabia and Dave2020), to estimate the impact of a super-spreading event on COVID-19 case rates (Dave et al. Reference Dave, McNichols and Sabia2021), and to estimate the effects of lockdowns on air pollution and health in Wuhan, China (Cole et al. Reference Cole, Elliott and Liu2020). We are aware of three other concurrent research efforts to analyze the effectiveness of the Ohio lottery program that also use a synthetic control approach (Barber and West Reference Barber and West2021; Brehm et al. Reference Brehm, Brehm and Saavedra2021; Sehgal Reference Sehgal2021). We address differences in findings and methods below in section 4.1
A particular novelty of this method is that it allows researchers to specify a counterfactual without any knowledge of post-treatment data, making it well-suited for pre-registration (Cunningham Reference Cunningham2018). By pre-specifying the weighting of states, it provides a clearly articulated counterfactual of what would happen if no interventions occurred. In light of concerns regarding “cherry picking” with synthetic control methodologies (Ferman et al. Reference Ferman, Pinto and Possebom2020), we pre-registered the weights for the synthetic comparison group using data from January 12 to May 9. We defined the pre-treatment period through the end of the last full week before the lottery announcement on May 12. On June 15, we revised our pre-registered protocol to exclude states that had announced vaccine lotteries after our original pre-registration, specifying that we would also run our analysis excluding these states from Ohio’s synthetic control. We present the analysis omitting other lottery-adopting states in the main text below. In Appendix C, we present findings that follow our initial plan and include all 50 states and the District of Columbia. These findings are not substantively different. We stopped data collection and calculated results after the last lottery was run on June 23. All the codes used to generate our pre-registered synthetic controls come from the tidysynth package in R (Dunford Reference Dunford2021). Our initial code and analysis was posted to the Open Science Foundation (OSF) repository on May 24 and on Github. Footnote 2
We construct our synthetic control using the following expression:
 $$\sum\limits_{m = 1}^k {v_m}{\left({X_{1m}} - \sum\limits_{j = 2}^{J + 1} {w_j}{X_{jm}}\right)^2}$$ ${X_1}$
corresponds to our vector of pre-treatment outcomes, vaccination rates before the lottery, for the state of Ohio.
${X_1}$
corresponds to our vector of pre-treatment outcomes, vaccination rates before the lottery, for the state of Ohio. ${X_j}$
corresponds to the pre-treatment outcomes and the associated indices of other states in the donor pool.
${X_j}$
corresponds to the pre-treatment outcomes and the associated indices of other states in the donor pool. ${w_j}$
corresponds to the unit weights, the associated weighting of each state in our synthetic construction.
${w_j}$
corresponds to the unit weights, the associated weighting of each state in our synthetic construction. ${v_m}$
corresponds to a variable importance weight of the pre-treatment outcomes that we match on. We minimize this expression subject to the constraints that both our unit weights and variable weights are non-negative and sum to unity.
${v_m}$
corresponds to a variable importance weight of the pre-treatment outcomes that we match on. We minimize this expression subject to the constraints that both our unit weights and variable weights are non-negative and sum to unity.
We trained our synthetic control model on the 17 weeks preceding the vaccination announcement. We used data from 31 non-lottery states and the District of Columbia in the donor pool. After optimizing expression 1 based on the past 17 weeks of vaccination data, we generated the synthetic control version of Ohio. Exact weights are shown in Table 1. Synthetic Ohio is a composite of Kansas, Wisconsin, Virginia, Georgia, Iowa, Hawaii, Pennsylvania, and Connecticut.
Table 1. Weights Used to Construct the Synthetic Counterfactual to Ohio. States not listed had weights less than 0.001. These weights are based on a June 15 registration that excludes all other lottery-adopting states. See Appendix C Table 3 for a comparison to our original pre-registered weights

While best practice on the role of covariates in synthetic control is still evolving, using outcome data for each pre-treatment period obviates the need for covariates and shrinks their variable importance weights to zero (Kaul et al. Reference Kaul, Klößner, Pfeifer and Schieler2015): We believe using the full path of our pre-treatment outcome is a parsimonious specification. As part of the multiverse analysis, we test the effect of including additional covariate adjustments.
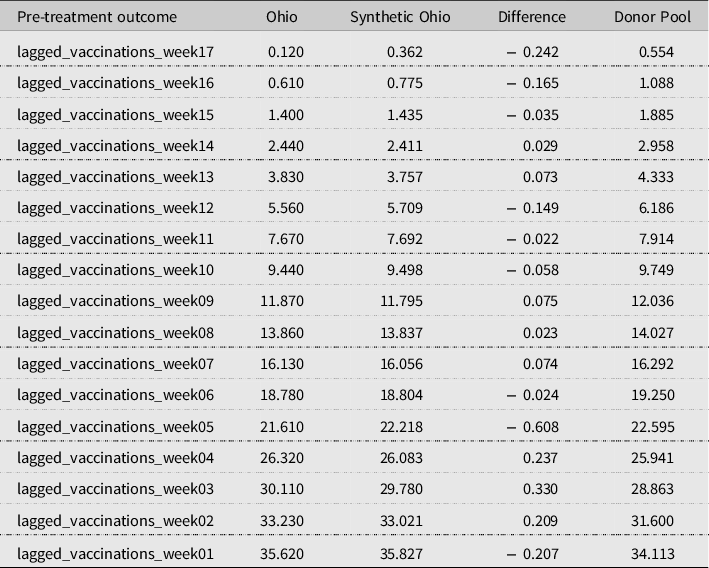
Synthetic Ohio and Actual Ohio match very well in their cumulative vaccination rate during the pre-treatment period. In Table 2 below, we show the value of our pre-treatment outcomes for Actual Ohio, Synthetic Ohio, and the average across our donor pool, in the weeks leading up to the vaccination announcement. In all cases, the error between Actual Ohio and Synthetic Ohio was at most 0.6 percentage points. This result suggests that the difference between Synthetic Ohio and Actual Ohio in the pre-treatment period is relatively small.
Table 2. Balance Table
Results
We present results for Synthetic Ohio and Actual Ohio in Figure 2. At the time of the final lottery drawing, the vaccination rate for Actual Ohio was 43.7% and the vaccination rate for Synthetic Ohio was 45.0%. This represents a decrease in full vaccinations of approximately 1.3% percentage points relative to Synthetic Ohio.
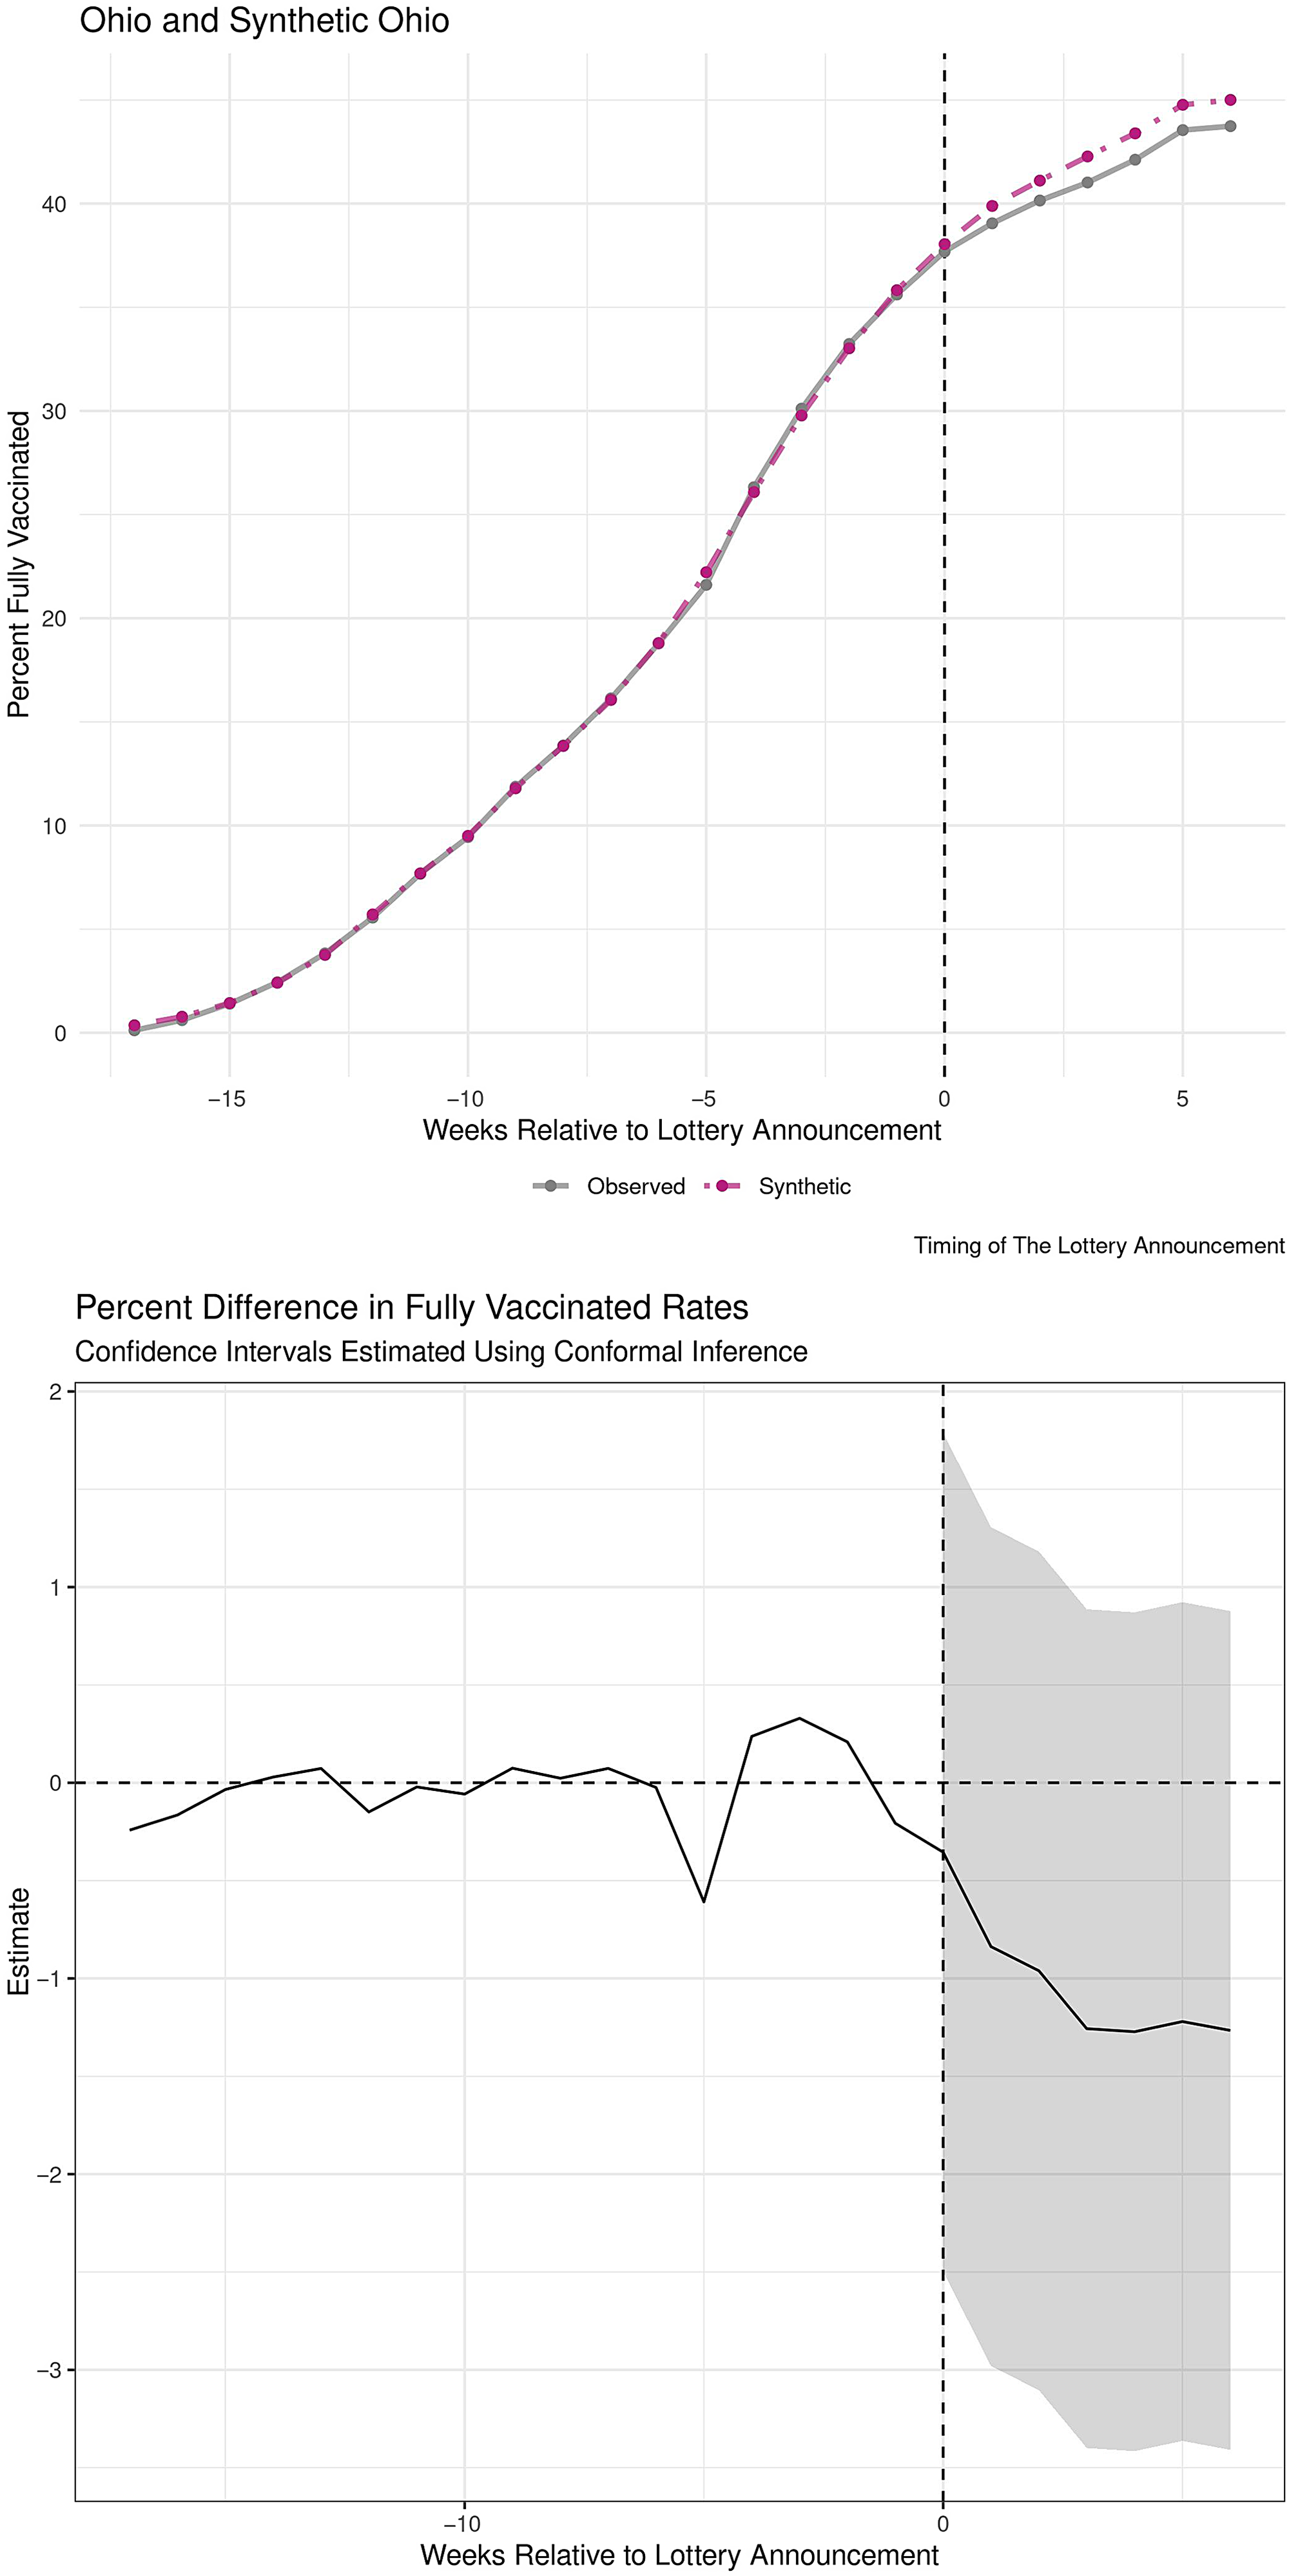
Figure 2. Trends in Vaccination Rates (Top). Difference in Vaccination rates between Actual Ohio and Synthetic Ohio (Bottom). Notes: Negative values show that Ohio has a lower total vaccination rate than the synthetic comparison.
The pre-registered inference strategy we use to compute statistical significance is a permutation test of the mean squared predicted error ratios. This is calculated by repeating the minimization procedure from expression 1 to create a unique synthetic counterfactual for each of the donor states. We compute the ratio of the mean squared prediction error (MSPE) between the pre-treatment and post-treatment periods using the synthetic counterfactuals for each state. We then sort these MSPE ratios in descending order and use the associated rank for each state as its associated p-value (See Appendix A for a placebo analysis and Appendix B for a power analysis). Intuitively, non-treated states should continue to match their synthetic counterfactual relatively well in the post-treatment period. If a policy exhibits a substantial change in the focal outcome, the synthetic control for the true treated state will have relatively poor out of sample fit in the post-treatment period. Our pre-specified threshold for statistical significance was a p-value of 0.10. Excluding lottery states, this would correspond to our treatment state having an associated rank of 3 or higher out of the remaining 33 states.
We present the result for the MSPE ratio test in Table 3. This MSPE ratio is 27.0, suggesting the treatment period error is substantially larger than the pre-treatment period error. However, when we compute our p-value using the state’s MSPE ranking in descending order, we see that the associated p-value is 12/33, yielding an approximate p-value of 0.36. In other words, 11 other non-lottery-adopting states had larger divergences from their synthetic counterfactuals than Ohio did. Thus, we cannot reject the hypothesis that Ohio’s state lottery had no impact on state-wide cumulative vaccination rates. This null finding, however, should not be construed as proof that the lottery had no effect.
Table 3. Outcome Table

While best practices for estimating confidence intervals for synthetic control analyses are still being established, conformal inference techniques suggest that the associated point estimates at the end of period are between −3.4% and 0.9%, see bottom panel of Figure 2 (Chernozhukov et al. Reference Chernozhukov, Wüthrich and Zhu2021; Ben-Michael et al. Reference Ben-Michael, Feller and Rothstein2021a). We emphasize that this confidence interval is descriptive and note the method is not specified in our pre-registration.
Multiverse analysis
We are aware of three other, concurrent research efforts that use synthetic control methods (Brehm et al. Reference Brehm, Brehm and Saavedra2021; Barber and West Reference Barber and West2021; Sehgal Reference Sehgal2021).None of these studies used pre-registered analysis plans. These papers have found small positive effects of the Ohio lottery on first vaccination doses. In order to fully understand why similar methods would find differing conclusions, we conducted a multiverse analysis to explore the impact of several different data processing and modeling choices, based on those used in the aforementioned papers, on the final outcome estimates through the creation of 216 distinct synthetic control models (Steegen et al. Reference Steegen, Tuerlinckx, Gelman and Vanpaemel2016; Silberzahn et al. Reference Silberzahn, Uhlmann, Martin, Anselmi, Aust, Awtrey, Bahník, Bai, Bannard, Bonnier, Carlsson, Cheung, Christensen, Clay, Craig, Dalla Rosa, Dam, Evans, Flores Cervantes, Fong, Gamez-Djokic, Glenz, Gordon-McKeon, Heaton, Hederos, Heene, Hofelich Mohr, Högden, Hui, Johannesson, Kalodimos, Kaszubowski, Kennedy, Lei, Lindsay, Liverani, Madan, Molden, Molleman, Morey, Mulder, Nijstad, Pope, Pope, Prenoveau, Rink, Robusto, Roderique, Sandberg, Schlüter, Schönbrodt, Sherman, Sommer, Sotak, Spain, Spörlein, Stafford, Stefanutti, Tauber, Ullrich, Vianello, Wagenmakers, Witkowiak, Yoon and Nosek2018). In Appendix D, we use the weights published in Barber and West (Reference Barber and West2021), and Sehgal (Reference Sehgal2021) to present a direct replication and comparison of their first dose effects over an extended time frame. We find that the positive effects on first doses observed at the end of the lottery period rapidly decay and turn negative.
Multiverse analyses have been used to understand differences in empirical research findings in several research contexts including racial disparities in police use of force (Cesario et al. Reference Cesario, Johnson and Terrill2019), brain structure and depressive disorders (Kołodziej et al. Reference Kołodziej, Magnuski, Ruban and Brzezicka2021), smartphone use and parenting (Modecki et al. Reference Modecki, Low-Choy, Uink, Vernon, Correia and Andrews2020), and power pose effects (Credé and Phillips Reference Credé and Phillips2017). The multiverse approach can highlight when findings are robust to data processing and modeling decisions, or when statistically significant findings disappear under slightly different assumptions.
In Table 4, we outline six decision criteria that we considered. The choices indicated with a * are our pre-registered modeling decisions. Pre-registering those choices before outcome data were available ensured that those decisions were not influenced by a motivated search of the modeling space for a significant effect.
Table 4. Data Processing and Modeling Choices. Choices indicated with a* represent the pre-registered modeling decisions

Our first consideration in our multiverse is the associated donor pool of our synthetic Ohio. We initially pre-registered the decision to use all 50 states, prior to many other states subsequently adopting lotteries. On June 15, we amended the pre-registered plan to exclude any states that subsequently adopted vaccination lottery sweepstakes. This leaves a donor pool of 50 and 32 units, respectively. We note that though other work (Brehm et al. Reference Brehm, Brehm and Saavedra2021) uses county-level data, we restrict our multiverse analysis to state units.
Second, we extend our results with additional outcomes, testing whether first doses or total vaccines administered captured effects that did not show up in the share fully vaccinated.
Third, we consider different starting time windows. Our analysis used vaccination data compiled by Our World in Data (Mathieu et al. Reference Mathieu, Ritchie, Ortiz-Ospina, Roser, Hasell, Appel and Rodés- Guirao2021) that were available from January 12, 2021. However, others have reported that comprehensive data from the CDC were not available until February 19, 2021 and that access to vaccines may have been limited to health care workers and other at-risk individuals prior to that (Barber and West Reference Barber and West2021). Other work has used an even shorter 30-day pre-treatment window, which we omit here for the sake of parsimony (Sehgal Reference Sehgal2021).
Fourth, we vary the end date of the post-treatment period. Our original ending date – the day of the last lottery drawing – was potentially too early to find effects on full vaccinations, due to the necessity of waiting three to four weeks between doses to complete the Pfizer and Moderna vaccines (Barber and West Reference Barber and West2021; Brehm et al. Reference Brehm, Brehm and Saavedra2021). We therefore test whether effects change four and eight weeks after the final lottery drawing to allow for the administration of second doses. This latter selection was chosen as it was the day prior to full approval of the Pfizer vaccine by the Food and Drug Administration (FDA) Footnote 3 .
Fifth, we assess the inclusion of covariates to improve the construction of the synthetic counterfactual. Following the lead of other papers investigating the effect of the Ohio lottery, we test the use of a series of state demographic variables as well as 2019 estimates of flu vaccination rates and the 2020 Presidential election republican vote share (Brehm et al. Reference Brehm, Brehm and Saavedra2021), and additionally including daily estimates of individual mobility provided by Google trends (Barber and West Reference Barber and West2021):
Lastly, we varied the modeling technique used to compare the traditional synthetic control approach to an augmented synthetic control model (Ben-Michael et al. Reference Ben-Michael, Feller and Rothstein2021a), exploring a technique that relaxes some of the assumptions of the traditional synthetic control model by allowing for state fixed effects and augmenting the counterfactual comparison with ridge regressions. Most notably, these approaches allow the associated donor weights to be negative and can facilitate better pre-treatment fit.
We fully interact all of the modeling decisions and data processing choices to create 216 possible models.
We analyze the results of this multiverse of modeling decisions in two stages. First, we examine the variability in donor states’ weights in the synthetic control for Ohio in Figure 3. Here we see that the construction of the counterfactual is sensitive to the modeling decisions made. While some states consistently have near-zero weights, the states that are used in the counterfactual have widely varying weights ranging from comprising half the weight of the counterfactual down to having no weighting at all. While the weights used in synthetic controls provide a high level of transparency in the calculation of the counterfactual, these results show that the determination of those weights is quite sensitive to researcher decisions. Prior research has found that synthetic control weights are subject to cherry picking concerns (Ferman et al. Reference Ferman, Pinto and Possebom2020).

Figure 3. Distribution of Donor State Weights in Synthetic Counterfactuals Across Multiverse of Models.
In Figure 4, we present the end of period differences between Actual Ohio and Synthetic Ohio across modeling decisions. The figure presents the estimated final period treatment effect on the y-axis while the x-axis represents different time windows (Options 3 and 4 from Table 4) while color is used to denote the covariate choice used (option 5). A total of twelve figures are presented with the three rows corresponding to measuring effects on the percentage of the population receiving a first dose, percentage fully vaccinated, and the total number of doses per capita (option 2). The four columns correspond to the counterfactual states considered and modeling choice (options 1 and 6). Across specifications, we find a maximum positive effect of +3.6 percentage points on full vaccinations and a maximum negative effect of −5.9 percentage points on total doses administered. We see estimates of negative effects in 59 out of 72 models that use first doses as the dependent variable, 60 out of 72 of the models that measure effects on full vaccination rates, and all 72 of the models that estimate total vaccines administered. Our pre-registered model is indicated with a * and is near the middle of the model estimates.

Figure 4. Distribution of Estimated Change in Vaccination Outcomes Across Multiverse of Models.
To assess the relative validity of these models, we compute the post-treatment fit for our donor states. Put differently, we estimate how much non-treated states diverge from their synthetic counterfactuals, with smaller divergence treated as evidence of better model fit (Abadie Reference Abadie2021). Intuitively, if a model has poor post-treatment fit when no intervention occurred, this model would be less preferable to one that more accurately described donor states’ behavior.
We calculate the average mean squared predicted error in the post-treatment period for each model across the permutations. We find that the median model has an average post-period MSPE of 11.9 in the non-treated states. Our pre-registered model has an average non-treated post-period MSPE of 8.4, which is the 35th percentile of all the calculated average post-period MSPE values. For each of the three outcome measures, the model with the lowest MSPE is indicated in Figure 4 with an X. We estimate a negative effect of −0.38 percentage points on first doses, −0.54 percentage points for full vaccination rates, and −2.66 percentage points for total doses in the best-fitting models, though none of these estimates are statistically significant according to our permutation test. Thus, we find small, negative effects for each outcome in the models that best generalize to the control states.
Discussion
Contrary to our pre-registered hypothesis, our work did not detect a statistically significant effect of Ohio’s lottery program on state-wide vaccination rates. In our pre-registered analysis, the majority of specifications from our multiverse analysis, and in the best-fitting models from the multiverse analysis, we found convergent evidence that the effect of the lottery was generally slightly negative, and not statistically significant. Nonetheless, while negative point estimates predominated in these analyses, we do not have strong evidence that the lottery program had negative effects, as our estimated confidence intervals include positive effects. These findings are particularly important as they contrast with early results suggesting that Ohio’s lottery was effective at boosting vaccination rates in the short term, and those early results were used by the White House to encourage other states to adopt lotteries of their own (Ohio Department of Public Health 2021; White House Press Briefing 2021).
How do our results fit with other papers analyzing the effect of COVID-19 vaccine lotteries, in Ohio and beyond? Our results corroborate a pre-registered experiment that attempts to assess the efficacy of vaccination lotteries (Milkman et al. Reference Milkman, Gandhi, Ellis, Graci, Gromet, Mobarak, Buttenheim, Duckworth, Pope, Stanford, Thaler and Volpp2021) in Pennsylvania. With respect to studies of Ohio specifically, some other work casts doubt on the efficacy of lottery sweepstakes at increasing COVID-19 vaccination rates (Walkey et al. Reference Walkey, Law and Bosch2021; Thirumurthy et al. Reference Thirumurthy, Milkman, Volpp, Buttenheim and Pope2021). County-level analyses have found some positive impact on starting-vaccination rates (Brehm et al. Reference Brehm, Brehm and Saavedra2021; Robertson et al. Reference Robertson, Schaefer and Scheitrum2021; Mallow et al. Reference Mallow, Enis, Wackler and Hooker2021). Other work that used a similar synthetic control approach found modest positive effects (Barber and West Reference Barber and West2021; Sehgal Reference Sehgal2021; Brehm et al. Reference Brehm, Brehm and Saavedra2021). In the multiverse analysis, we find that differences in estimates are not explained through the use of full vaccination rates versus first doses as the focal outcome and find that the positive effects reported in these papers are replicated in only a small subset of the modeling space.
We caution however that our results are all based on state-level average vaccination rates for Ohio. A challenge faced by recent evaluations of the Ohio Lottery program is that relevant comparator states have had data revisions and corrections that are on the order of a percentage point (Cox Reference Cox2021; Kansas Vaccine Database 2021; McDaniel Reference McDaniel2021). We encourage other researchers to look at this issue with more granular data and to examine heterogeneity in incentive effects for specific sub-populations, especially those with lower vaccination rates. Initial work suggests that the Ohio lottery may have been successful in increasing vaccination rates in lower income counties (Mallow et al. Reference Mallow, Enis, Wackler and Hooker2021).
As more states have adopted lottery incentives, future research should use methods that allow for multiple treated units. New methods of multi-treatment synthetic control models may be appropriate for this context (Ben-Michael et al. Reference Ben-Michael, Feller and Rothstein2021b, Reference Ben-Michael, Feller and Rothstein2021a). We present an exploratory analysis of the multi-state adoption in Appendix E and find evidence for modestly positive (1.0%), non-significant effects of the lotteries on vaccination rates. One group of researchers who have studied the effect of these incentives in a similar sample of states found small negative effects on weekly vaccination rates (Thirumurthy et al. Reference Thirumurthy, Milkman, Volpp, Buttenheim and Pope2021), while another set found small positive effects (Robertson et al. Reference Robertson, Schaefer and Scheitrum2021).
Although initial coverage was positive, later news reports questioned the long-term effectiveness of lottery incentives (Welsh-Huggins Reference Welsh-Huggins2021), and our analysis suggests early effects likely did not endure. Nonetheless, 17 states followed Ohio’s lead and took up their own vaccination lotteries. In Appendix D, we present analysis that suggests that research which found positive effects on initial doses during the lottery period turned negative shortly after the lottery’s completion.
With multiple possible interventions to induce higher vaccination rates and limited resources, policymakers have had to make decisions in a rapidly evolving context with incomplete information. While our study does not provide conclusive evidence regarding the effectiveness of lotteries, it strongly suggests that continuing to explore the suite of policy options beyond vaccine lotteries is warranted, and convergence on lotteries as a primary intervention would be premature. Emerging evidence on direct payments for vaccination is conflicting (Chang et al. Reference Chang, Jacobson, Shah, Pramanik and Shah2021; Campos-Mercade et al. Reference Campos-Mercade, Meier, Schneider, Meier, Pope and Wengström2021), suggesting that measured confidence in, and additional research on, the efficacy of material incentives is warranted.
As the pace of vaccination continues to slow, it is important that policymakers receive rapid feedback about the effectiveness of their efforts. Our work acts as proof of concept that social science methods can be used both in prospective and policy-relevant settings in real time. We made a pre-print of these results available on July 5, less than 2 months after the policy was announced on May 13. We also made all code and data used publicly available. We offer the following closing thoughts on how policymakers and researchers may better facilitate such policy evaluation.
First, providing high frequency data with clearly defined policy changes can help facilitate assessment of such actions. The ease with which this analysis was conducted was due largely to the fact that researchers and public officials offered a tremendous level of data transparency. We as researchers had no privileged access. The fact that the intervention was well-defined and conducted over a short period further facilitated our analysis.
Second, given the known biases in publication processes towards positive and statistically significant results (Dwan et al. Reference Dwan, Altman, Arnaiz, Bloom, Chan, Cronin, Decullier, Easterbrook, Von Elm, Gamble, Ghersi, Ioannidis, Simes and Williamson2008; Munafò et al. Reference Munafò, Nosek, Bishop, Button, Chambers, Du Sert and Ioannidis2017), multiverse analyses are a powerful tool to ensure that researchers have not intentionally or unintentionally made apparently reasonable decisions that may bias analyses toward finding a specific result. Incorporating pre-analysis plans can help adjudicate which of these specifications are most appropriate (Ludwig et al. Reference Ludwig, Mullainathan and Spiess2019).
Lastly, we highlight the value of synthetic control methods as a tool for prospective policy analysis for researchers. Of the nearly 80,000 registrations on the Open Science Foundation repository, only seven use synthetic controls Footnote 4 . Synthetic control methods allow researchers to generate a specific and transparent counterfactual outcome before post-treatment data is available. With these pre-defined weights, comparing treatment outcomes between a synthetic and actual state is no more complicated than computing a weighted average (as we show in Appendix D). Given the technique’s alignment with pre-registration, relative simplicity, and broad utilization, we believe more researchers should consider pre-registering synthetic control analyses of timely policy matters and coupling this approach with a multiverse analysis (Athey and Imbens Reference Athey and Imbens2017; Steegen et al. Reference Steegen, Tuerlinckx, Gelman and Vanpaemel2016).
Supplementary material
For supplementary material accompanying this paper visit https://doi.org/10.1017/XPS.2021.32
Data Availability Statement
The data and code required to replicate all analyses in this article are available at the Journal of Experimental Political Science Dataverse within the Harvard Dataverse Network, at: doi: 10.7910/DVN/QYXN9L (Lang et al. Reference Lang, Esbenshade and Willer2021).
Acknowledgments
The authors received no specific funding for this work. The first two authors’ graduate studies are supported by a grant from the Institute of Education Sciences (Award No. R305B140009). The funder had no role in study design, data collection and analysis, decision to publish, or preparation of the manuscript. The authors would like to thank Ben Domingue for support in this project. They would also like to thank Klint Kanopka and Jonas Mueller for providing feedback on early drafts of this work and Joe Mernyk for help in obtaining and processing covariate data. We also like to thank Eli Ben-Michael for guidance on the augsynth package. We also wish to thank Andrew Barber and Jeremy West for sharing data and code so that we could better understand the sources of differences in our estimates.
Conflicts of Interests
The authors declare no competing interests.
Ethics Statements
This work used publicly available administrative, state-level data. This research did not use any personally identifiable information. This work is not human subjects research and is not subject to IRB review.


 Open access