Introduction
The individual glacier accumulation zones of the McMurdo Dry Valleys (MDV), southern Victoria Land, provide a unique opportunity to study the interplay between local- and regional-scale spatial trends in coastal Antarctic climate. Several studies in the region reveal that a combination of marine and continental air masses influences local climate, with seasonality, external forcing and site-specific factors creating diverse boundary conditions (Reference Welch and MayewskiWelch and others, 1993;Reference MayewskiMayewski and others, 1995;Reference DoranDoran and others, 2002;Reference BertlerBertler and others, 2004a, Reference Bertler and Mayewskib, Reference Bertler2005b, Reference Bertler, Naish, Oerter and Kipfstuhl2006). In addition to information regarding local climate, there is a growing body of literature examining regional- to hemispheric-scale climate change using ice-core records from Newall Glacier in the MDV and from Taylor Dome, <75 km distant (Reference Landis and FitzpatrickLandis and others, 1995;Reference MayewskiMayewski and others, 1995, Reference Mayewski1996;Reference Stager and MayewskiStager and Mayewski, 1997;Reference SucherSucher, 1997; Reference Steig, Hart, White, Cunningham and DavisSteig and others, 1998a, Reference Steigb, Reference Steig2000). The Dry Valleys are of particular interest because this region contains records of marine, aeolian, lacustrine and fluvial processes within a small geographic area (Hall and others, 2000, 2002; Reference Armienti and TamponiArmienti and others, 2001;Reference De Carlo and Green.De Carlo and Green, 2002; Reference LancasterLancaster, 2002; Reference Green, Stage, Preston, Wagers and ShacatGreen and others, 2005; Reference Hall and DentonHall and Denton, 2005). Although the area is perhaps best known for environmental research on the exposed valley floors, there are several alpine glaciers residing on ridges separating the individual valleys. Ice cores from sites on several of these glaciers have provided records of atmospheric chemistry showing connections between local snow and ice composition and marine ionic chemistry (Reference MayewskiMayewski and others, 1995;Reference Lyons, Welch, Fountain, Dana and VaughnLyons and others, 2003), marine biological activity and sea-ice extent (Reference Welch and MayewskiWelch and others, 1993), and local aerosol transport (Reference Mayewski and LyonsMayewski and Lyons, 1982;Reference Bertler and MayewskiBertler and others, 2004b).
In particular, a number of researchers have discussed major-ion chemistry in Dry Valleys snow and ice (Reference MayewskiMayewski and others, 1995;Reference Lyons, Welch, Fountain, Dana and VaughnLyons and others, 2003;Reference Bertler and MayewskiBertler and others, 2004b), and in some cases have examined trace metals as well (Reference Mayewski and LyonsMayewski and Lyons, 1982;Reference Bertler and MayewskiBertler and others, 2004b). All agree that local insoluble material plays a significant role in shaping the distribution of chemistry in MDV samples, and that dry periods combined with high winds likely deposit significant amounts of both soluble and insoluble species to glacier surfaces (Reference Mayewski and LyonsMayewski and Lyons, 1982;Reference MayewskiMayewski and others, 1995;Reference Lyons, Welch, Fountain, Dana and VaughnLyons and others, 2003; Reference Bertler and MayewskiBertler and others, 2004b). Refining the nature of these wind patterns through examination of major-ion, Al and Fe input timing on Victoria Lower Glacier, Reference Bertler and MayewskiBertler and others (2004b) found that, with few exceptions, concentration maxima occur at the same time for marine and terrestrial elements. They associated these shared maxima with a ‘monsoonal’ circulation in the climate of the Dry Valleys and suggested that local chemistry thus provides a glaciochemical record of onshore-offshore wind patterns known to function in modern MDV meteorology (Reference Thompson and CraigThompson and others, 1971; Reference McKendry and Lewthwaite.McKendry and Lewthwaite, 1990;Reference DoranDoran and others, 2002; Reference Bertler and MayewskiBertler and others, 2004b).
This paper focuses on evidence used to isolate local input of aerosols to MDV glaciers, including effects based on different site exposures to marine airflow and proximity to different soil sources, from the effects of regional geographic variables such as distance from the coast or elevation. This search is complicated by the fact that significant concentrations of the analytes found in MDV ice derive both from marine species associated with the nearby Ross Sea and from soluble and insoluble materials present within the valleys (Reference Mayewski and LyonsMayewski and Lyons, 1982;Reference WelchWelch, 1993;Reference Welch and MayewskiWelch and others, 1993;Reference MayewskiMayewski and others, 1995;Reference Lyons, Welch, Fountain, Dana and VaughnLyons and others, 2003;Reference Bertler and MayewskiBertler and others, 2004b). Interpreting chemical records in this area therefore requires techniques to separate these local terrestrial signals from the regional marine signal.
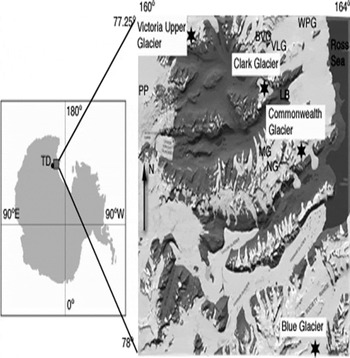
Among the four sites discussed in this paper, the first three lie along a north–south transect within 30 km of the coast and are in close proximity to three of the primary valleys in the MDV network (Victoria, Wright and Taylor Valleys) and three smaller (∼10km) valleys (Garwood, Marshall and Miers Valleys) (Fig. 1). The fourth site is located at the western end of Victoria Valley, near the junction between the polar plateau and the MDV. To assess trends in chemistry from these sites, mean concentration values for a selection of analytes are first evaluated to provide a picture of spatial variation in snow and ice chemistry on a local scale (within the accumulation zones of Clark and Commonwealth Glaciers) and on a regional scale (among the four sites). These mean values and the relationships between them are also compared with similar surveys conducted within individual valleys by other investigators. Several investigators in Antarctica and in the MDV have demonstrated links between species concentrations, elevation, distance from the coast, and distance to the sea-ice edge (Reference Legrand and DelmasLegrand and Delmas, 1984, Reference Legrand and Delmas1988;Reference Welch and MayewskiWelch and others, 1993; Reference Mulvaney and WolffMulvaney and Wolff, 1994;Reference Kreutz and MayewskiKreutz and Mayewski, 1999; Reference Lyons, Welch, Fountain, Dana and VaughnLyons and others, 2003;Reference Bertler and MayewskiBertler and others, 2004b, Reference Bertler2005b). However, these trends are not present within this dataset, indicating that within the MDV different soil sources and site exposures provide stronger influences on site chemistries along a north–south axis than do these regional-scale parameters. Because the sites in this study represent different valleys within the MDV, we can examine these intra-valley effects and compare them with effects previously cataloged within individual valleys.

Fig. 1. Index map showing locations of Victoria Upper, Clark, Commonwealth and Blue Glaciers. Base map by GeographX, 2006.
Field Sampling Locations and Techniques
Samples for this study were collected from accumulation zones on Clark Glacier (77.4054° S, 162.3656° E; 816 m a.s.l.), Commonwealth Glacier (77.5423° S, 163.0226° E;723 m a.s.l.), Blue Glacier (78.0830° S, 163.2932° E;1022 m a.s.l.) and Victoria Upper Glacier (77.3005° S, 161.0419° E;1350m a.s.l.), located in the Olympus, Asgaard, Royal Society and Clare Ranges, respectively. Snow pits were excavated in November 2003 at Clark, Commonwealth and Blue locations and in November 2004 at Victoria Upper Glacier as part of efforts to determine suitability for collection of medium-depth ice cores.
Snow pits at Clark, Blue and Victoria Upper Glaciers were dug to depths of 226, 224 and 200 cm, respectively; the pit at Commonwealth Glacier was dug to 304 cm. One wall of each pit was prepared for sampling by first removing the outer 10 cm of firn with a clean plastic shovel and then scraping with a pre-rinsed plastic scraper to remove another 2 cm of material to avoid contamination. During this preparation process and the sampling process, the person collecting samples wore a Tyvek® clean suit and two pairs of clean polyethylene gloves. Using pre-cleaned titanium tools, samples were collected at 2 cm intervals for major-ion and isotopic analysis and at 10cm intervals for trace element analysis. A higher-volume lower-resolution sample was collected for trace metals to allow multiple tests of trace elements from each interval (Reference WilliamsonWilliamson, 2006) while staying within the lateral area associated with the data for the major ions.
Each major-ion and isotope sample was collected into one 60 mL polypropylene cup and each trace element sample was collected into a separate 500 mL polypropylene bottle. Major-ion/isotope containers were cleaned before use by rinsing three times with deionized water (>18 MΩ cm resistivity), soaking for >8 hours in deionized water, rinsing again three times and drying in a clean laminar flow bench for 2 hours. Trace metal containers were soaked in 10% HNO3 for 24 hours, rinsed once, soaked for 24 hours and rinsed again in deionized water before drying on the clean bench. After collection, samples were maintained at –20°C and shipped back to the University of Maine Climate Change Institute for analysis.
Borehole temperature data were collected using an RBR model TR-1050P temperature logger lowered into boreholes on Clark, Commonwealth and Victoria Upper Glaciers during November 2005. The temperatures presented here represent equilibration for a minimum of 45 min at selected ice depths.
Mass-balance pole networks included 4 pole x 5 pole grids on Clark and Commonwealth Glaciers with 200 m spacing between poles, and a 3 pole x 3 pole grid on Victoria Upper Glacier with 100 m spacing. These networks were left in place between the 2004 and 2005 seasons, yielding 1 year of data. Mass-balance poles were also installed in the 2003 season at Clark, Commonwealth and Blue Glaciers, with greater and more irregular pole spacing (∼500 m);2004/05 data for Blue Glacier come from the measurements of these poles in November 2005. Mass-balance data collected by the Long-Term Ecological Research (LTER) group for Commonwealth Glacier are included here for comparison during time periods not covered by the above networks (A.G. Fountain, http://metacat.lternet.edu/knb/metacat?action=read&qformat=mcm&docid=knb-lter-mcm.2008). Though there have been more than 20 LTER poles monitored on Commonwealth Glacier on an intermittent basis, only four were located within 1500 m of the snow pit in areas which likely shared similar accumulation histories with the pit. Only data from these four poles were used to maximize the likelihood that pole data represented similar accumulation histories to those determined at the pit location.
Chemical and Isotopic Analysis
Major-ion analysis was conducted using Dionex™ DX-100 ion chromatographs (ICs) after samples were melted and transferred via pipette to 5mL mailing tubes used to introduce samples onto the column of the IC. These pipettes and mailing tubes were cleaned according to the same procedures used for the original sample containers. Anions (MS–, Cl–, NO3–, SO4 2–1 were measured using an AS-11 column and a Dionex™ Reagent Free Controller producing a KOH eluent gradient of 1–8mM. Cations (Na+, K+, Mg2+, Ca2+) were measured using a CS-12A column with 25 mM methanesulfonic acid eluent. In addition to samples, ten deionized water blanks were analyzed using the same methods. Values for the blanks were <1% of the lowest sample values for all species except for K+, for which three of the blanks had values ∼13% of the lowest sample or ∼2% of the mean sample value. Duplicates were run every 20th sample; sample variability was <5% for all duplicates for all species except for Ca2+ (11%) and SO4 2¯ (5.3%).
2H/1H isotope ratios were determined using gas source mass spectrometry conducted on a Micromass Isoprime system configured for continuous flow, fitted with a EuroVector Pyr OH furnace and liquid autosampler running DataLynx software. Values are reported as a difference relative to the Standard Mean Ocean Water (SMOW) standard according to the formula
The long-term precision and duplicate variability using laboratory and international standards was 0.5% for δDSMOW. Maximum duplicate variability was <2%.
Trace metal concentrations were determined for samples from Clark, Commonwealth and Blue Glaciers using a ThermoFinnigan ELEMENT2TM inductively coupled plasma mass spectrometer (ICP-MS) for Ba, Cd, Co, Cr, Cs, Cu, Mn, Pb, Sr, Ti, U, V, Zn and the rare-earth elements (REE). A Perkin–Elmer Optima 3000 XL axial inductively coupled plasma optical emission spectroscope with a CETAC (Omaha, USA) ultrasonic nebulizer (ICP-OES-USN) was used to determine values of Al, Ca, Fe and S. For samples from Victoria Upper Glacier, concentrations of elements in both of the above lists were determined using ICP-MS. Preparation of samples for both instruments involved melting the original sample, agitating it to suspend sediment, and then immediately transferring an aliquot by pre-cleaned pipette from the original sample bottle to polypropylene analysis vials. For the ICP-MS the aliquot was 3.5 mL, and for the ICP-OES the aliquot was 10 mL. Analysis vials were then acidified to 1% HNO3 using Fisher Optima® grade nitric acid to prevent material from plating to the vial walls. Based on runs of several metals using both methods, both sample magnitudes and trends are the same between ICP-MS and ICP-OES; limited variability found among the data likely relates to different amounts of particles being captured in separate runs (Reference WilliamsonWilliamson, 2006). Because of overall good agreement, data from these two instruments are compared directly. Blank samples were again prepared using deionized water. For Al, Cu, Fe, Mn, Pb, S, Sr, Ti and REE, blank values were <10% of average sample values at all sites. In all statistical analyses presented below, elements that do not meet this standard are not used.
Results
Chronologies/accumulation rates
Prior investigations in Antarctica have depended on a variety of techniques for dating chemical profiles, including chrono-stratigraphic radioactive layers from atomic bomb testing (Reference Crozaz and LangwayCrozaz and others, 1966;Reference BoutronBoutron, 1982;Reference MayewskiMayewski and others, 1995;Reference Bertler and MayewskiBertler and others, 2004b), strain-thickness calculation (Reference Mayewski and LyonsMayewski and Lyons, 1982), visual stratigraphy (Reference Boutron and LoriusBoutron and Lorius, 1979), and seasonal variations in the concentration and relative proportions of Na+, Cl–, methyl-sulfonate (MS–), and the stable isotopes of oxygen and hydrogen (Reference BoutronBoutron, 1982;Reference Welch and MayewskiWelch and others, 1993; Reference Kreutz, Mayewski, Pittalwala, Meeker and TwicklerKreutz and others, 2000;Reference DoranSteig and others, 2000, Reference Steig2005;Reference Bertler and MayewskiBertler and others, 2004b;Reference DixonDixon and others, 2005). For the sites described in this study, limitations exist for several of these methods. Deuterium ratios (δ2H), for example, are modified after deposition by a smoothing effect thought to be related to low accumulation rate and diffusion processes (Reference JohnsenJohnsen, 1977;Reference MayewskiMayewski and others, 1995). Stratigraphy is not well defined at the Victoria Upper Glacier site below 25 cm, with firn becoming homogeneous with large crystal size (diameter = ∼4 mm). As at other Dry Valleys sites, no surface melting was visible above the firn containing these crystals (Reference Lyons, Welch, Fountain, Dana and VaughnLyons and others, 2003), and the top 25 cm appeared consistent with unmodified surface snowfall. Instead of liquid water at the surface, however, with firn densities in the top layers as low as 0.25 g cm–3, these conditions may represent subsurface melting (Reference Brandt and WarrenBrandt and Warren, 1993), and dictate caution in interpreting temporal trends at this site. While MS– has been used as a seasonal marker at some coastal sites in Antarctica (Reference Legrand and MayewskiLegrand and Mayewski, 1997), this species has been associated with vertical migration between seasonal ice layers at other sites, making proposed chronologies more complex (Reference Mulvaney, Pasteur, Peel, Saltzman and Whung.Mulvaney and others, 1992;Reference Legrand and MayewskiLegrand and Mayewski, 1997;Reference Kreutz, Mayewski and WhitlowKreutz and others, 1998;Reference Pasteur and MulvaneyPasteur and Mulvaney, 1999, Reference Pasteur and Mulvaney2000; Reference CurranCurran and others, 2002; Reference Smith and van OmmenSmith and others, 2004). Given that glaciers in the Dry Valleys have low accumulation rates (Reference Welch and MayewskiWelch and others, 1993;Reference MayewskiMayewski and others, 1995;Reference Bertler and MayewskiBertler and others, 2004b), even a slight migration of MS– could have a significant effect
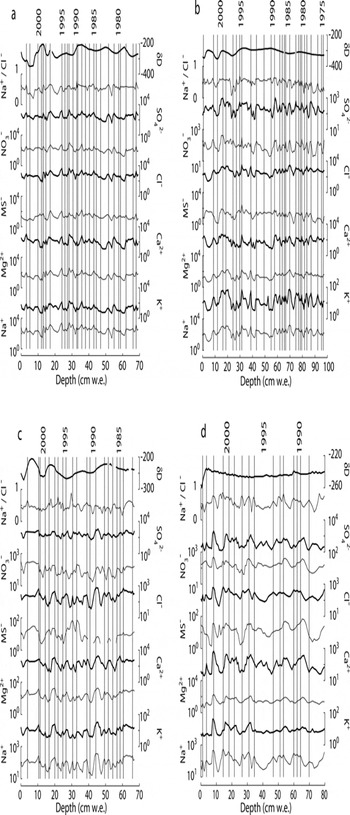
Because of uncertainties with these other methods, variations in Na+ concentration, which reflect seasonal signals at a variety of sites in Antarctica (Reference Welch and MayewskiWelch and others, 1993;Reference Legrand and MayewskiLegrand and Mayewski, 1997;Reference Kreutz and MayewskiKreutz and Mayewski, 1999;Reference Kreutz, Mayewski, Pittalwala, Meeker and TwicklerKreutz and others, 2000;Reference Bertler and MayewskiBertler and others, 2004b), including the Dry Valleys (Reference Welch and MayewskiWelch and others, 1993;Reference Bertler and MayewskiBertler and others, 2004b), provide the most consistent chemical depth series with which to develop chronologies for the sites discussed here (Fig. 2). Snow-pit samples for this study were collected in November, during the Antarctic spring (here considered September–November), and eight of ten pits sampled in the 2003 and 2004 seasons yielded Na+ values that decrease with depth in surface snow. These findings support the conclusion of Reference Bertler and MayewskiBertler and others (2004b) that peaks in Na+ represent summer precipitation in the MDV, in contrast to winter Na+ peaks found at many other sites in Antarctica (Reference Legrand and DelmasLegrand and Delmas, 1984;Reference WagenbachWagenbach and others, 1998). Based on layer counting between peaks after adjusting for the density profile at each site, mean annual net mass balance is 2.5, 3.4, 3.1 and 4.6 cm water equivalent (w.e.) for Clark, Commonwealth, Blue and Victoria Upper Glaciers, respectively. The range of accumulations found within the depth series for each snow pit was 1–7 cm w.e. at Clark, Commonwealth and Blue Glaciers and 1–12cmw.e. at Victoria Upper Glacier.
Fig. 2. Major ions and isotope ratios for (a) Clark Glacier, (b) Commonwealth Glacier, (c) Blue Glacier and (d) Victoria Upper Glacier plotted with dates corresponding to summer (December–February) peaks in sodium concentrations. Peaks are defined as snow or firn layers with concentrations>10% higher than the layers above or below. Ion concentrations are reported as the absolute concentration in µg L−1 (scaled logarithmically), and isotope ratio δD (=deuterium/hydrogen) is reported as ‰V-SMOW (Vienna Standard Mean Ocean Water). Dating, supported by agreement with physical mass-balance measurements, is estimated to be accurate to ±1 year.
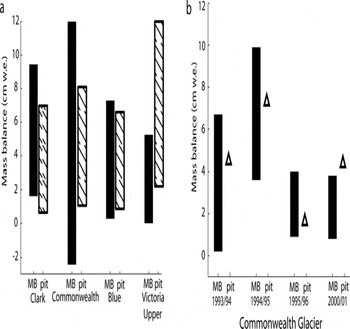
Networks of mass-balance poles installed near the four snow pits provide a complementary geophysical dataset with which to check accumulation-rate histories derived from chemical measurements. Only pole data for the year 2004/05 are included to examine a common time period where data exist for all sites. The range of values for mass balance from pole networks agrees well with the range of mass-balance values derived from Na+ measurements over the time period covered in the snow pits at all sites except for Victoria Upper Glacier (Fig. 3). However, as 2004/05 pole data represent a time period after the snow pit was sampled, they cannot provide a direct comparison of mass balance during the time period covered by the pits. At Commonwealth Glacier, on the other hand, the LTER mass-balance network covers several years included in the chronology presented here (A.G. Fountain, http://metacat.lternet.edu/knb/metacat?action=read qformat=mcm do-cid=knb-lter-mcm.2008). These values, when compared with the net mass accumulation value for the corresponding years in the snow pit, provide additional confirmation that chemistry-based accumulation rates fall within the range of mass balances calculated from physical measurements.

Fig. 3. Mass-balance comparisons between physical measurement of mass-balance poles (MB) and mass differences between sodium peaks measured in snow pits (pit). In (a) the black lines represent the range of mass-balance pole measurements for the 2004/05 season (a spatial range) and the hatched lines represent the range of accumulations determined according to mass differences in sodium (temporal range). In (b) the black lines represent the range of LTER stakes (n = 4) in place on Commonwealth Glacier during each of these seasons (A.G. Fountain, http://mercury.ornl.gov/metadata/lter/html/lter/metacat.lternet.edu_knb_metacat_action_read_qformat_xml_docid_knb-lter-mcm.2008.2.html) and the open triangles represent the accumulation for the corresponding year derived using the data used to generate Figure 2.
Intra-site variability
Major-ion concentrations measured in four pits separated by ∼800 m at Clark Glacier and from four similarly separated pits at Commonwealth Glacier provide a measure of intrasite variability. Mean values from snow and firn samples representing the time period 1996–2002 (depths 10–96 cm, depending on the pit) were used for this comparison at the Clark site; mean values from samples representing 2000–02 (depths 4–58 cm) were used at the Commonwealth site. Concentrations within each of these sites vary across three orders of magnitude as they do at other locations in the Dry Valleys (Reference Lyons, Welch, Fountain, Dana and VaughnLyons and others, 2003;Reference Bertler and MayewskiBertler and others, 2004b); because lower concentrations are more prevalent than higher concentrations, indicative of a log-normal distribution, the geometric mean and standard deviation are presented here instead of the arithmetic mean and standard deviation.
Both ion concentrations (µgcm–2) and fluxes (µgcm–2 a–1) were considered in all comparisons discussed here. Because concentration differences possibly can be interpreted as either a change in the amount of a given species arriving at a site or as a change in the accumulation of ice surrounding the species creating a dilution effect, accounting for the accumulation rate is necessary to determine whether a dilution effect exists at a given location (Reference Mulvaney and WolffMulvaney and Wolff, 1994;Reference Yang, Mayewski, Linder and WhitlowYang and others, 1996;Reference Kreutz and MayewskiKreutz and Mayewski, 1999). However, even accounting for annual accumulation rates, problems may still be encountered with individual storm events providing unique concentration signatures not necessarily well captured in a flux comparison calculated in this manner. In the case of the snow pits at these locations, the same statistically significant differences occur within and among the accumulation zones when either fluxes or concentrations are compared; because this indicates that a dilution effect is secondary, we use concentration values for the purposes of comparison. Mean Na : Cl and Ca : (Na + K + Mg) ratios for each site are also examined to provide information regarding the relative importance of sea salt (with expected ratios of Na : Cl ∼ 0.86 molar and Ca : (Na + K + Mg) ∼ 0.06 molar) vs local soils and other atmospheric sources in determining snow and firn chemistry (Reference MayewskiMayewski and others, 1995;Reference Lyons, Welch, Fountain, Dana and VaughnLyons and others, 2003).
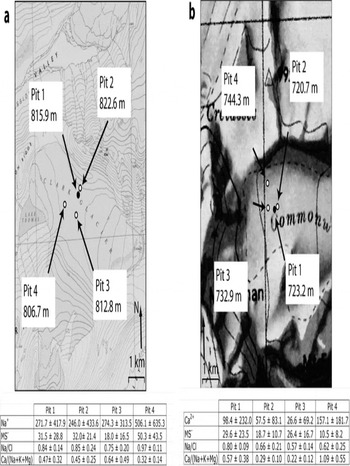
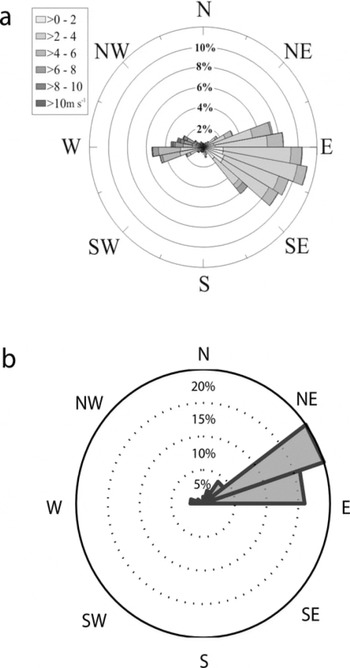
On both Clark and Commonwealth Glaciers, statistically significant differences are found in concentrations of multiple species within each accumulation zone (Fig. 4). Trends in chemistry are unrelated to geographic variables, and instead site-specific factors are assumed to influence these intra-site patterns (Reference WilliamsonWilliamson, 2006). Causes may include varying exposures both to marine influence and to material inputs from the nearby valley floors. An example of potential marine effects is evident in an examination of austral summer wind data from the 2000 season. During a common time period from that summer, for which wind direction measurements are available both from Lake Brownworth automatic weather station in Wright Valley (LB in Fig. 1)and from a similar weather station on the ice divide of Victoria Lower Glacier (VLG in Fig. 1), a split in ground-level wind direction was active, with winds at Lake Brownworth flowing predominantly from the east-northeast while winds at Victoria Lower Glacier flowed predominantly from the east-southeast (Fig. 5) (Reference Bertler and MayewskiBertler and others, 2004b; A.G. Fountain, http://metacat.lternet.edu/knb/metacat?action=read qformat=mcm docid=knb-lter-mcm.7005). Lake Brownworth meteorological station measurements. knb-lter-mcm.7005.1). This pattern suggests that onshore winds flow around Mount Allen, which lies between Clark Glacier and the Ross Sea to the northeast, altering local airflow. This pattern may explain why pit 4 on Clark Glacier (the lowest-elevation pit, the closest to Victoria Valley and the farthest from the shelter of Mount Allen) contains significantly higher concentrations of Na+ and MS– than do the other pits.

Fig. 4. Locations and selected geometric mean species concentrations (in µgL1) for multiple 1m pits on (a) Clark Glacier and (b) Commonwealth Glacier. The primary pit excavated in 2003 is shown as the black circle. The three pits excavated in 2004 to explore spatial variability are shown as open circles. Statistical similarity was measured using p values associated with two-tailed t tests (n = 31, 23, 24 and 28 samples on Clark Glacier; n = 13, 11, 10 and 11 samples on Commonwealth Glacier). Species concentration differences with p<0.05 are considered significant. On Clark Glacier, Na+ and MS− concentrations were found to be significantly high at pit 4 relative to multiple pits. On Commonwealth Glacier, Ca2+ concentrations were high and MS– concentrations were low at pit 4. The Na:Cl and Ca : (Na + K + Mg) ratios also contained significant differences at pits 3 and 4 on Clark Glacier and for pits 1 and 4 on Commonwealth Glacier. Base maps US Geological Survey (USGS) Lake Brownworth quadrangle, 1977, and USGS Ross Island and Vicinity, 1986.
However, a direct marine influence does not explain significant variation in Na : Cl ratios in the accumulation zone of both glaciers, or high Ca2+ values at pit 4 on Commonwealth Glacier. In addition, Ca : (Na + K + Mg) values for all pits at both sites are an order of magnitude higher than marine values. These data require additional ion sources, and demonstrate that, on an intra-site scale, relative exposure to the materials of the nearby Wright and Victoria Valleys also contributes to different major-ion concentrations.

Fig. 5. Wind direction data from (a) Victoria Lower Glacier (Reference Bertler and MayewskiBertler and others, 2004b) and (b) Lake Brownworth (A.G. Fountain, http://metacat.lternet.edu/knb/metacat?action=read qformat=mcm docid=knb-lter-mcm.7005). Both panels represent the percentage of wind originating in the direction shown by each bin. Bin size for (a) is 10°; bin size for (b) is 18°.
Regional trends
Major ions
Sodium derived from sea salt has provided records of marine activity around Antarctica, with Cl–, K+, Mg2+, Ca2+ and SO4 2_ inputs being attributed in part to sea salt and in part to terrestrial and atmospheric sources (Reference Legrand and DelmasLegrand and Delmas, 1988;Reference Mulvaney and WolffMulvaney and Wolff, 1994;Reference Legrand and MayewskiLegrand and Mayewski, 1997;Reference Kreutz and MayewskiKreutz and Mayewski, 1999;Reference Kreutz, Mayewski, Pittalwala, Meeker and TwicklerKreutz and others, 2000). Similarly, within the MDV, the seasonality of the Na+ signal and the delineation by previous investigators of negative concentration gradients with distance from the coast along valley transects suggest that Na+ variation in MDV ice reflects marine influence (Reference Lyons, Welch, Fountain, Dana and VaughnLyons and others, 2003; Reference Bertler and MayewskiBertler and others, 2004b). The data from the four sites discussed here support this conclusion as long as the data are examined within individual valley systems.
Mean ion concentrations from snow and firn representing the period 1989–2002, for example, provide confirmation that concentrations of Na+ and MS– (the two ions most clearly related to sea salt) decrease with distance from the coast within Victoria Valley and among glaciers of the Asgaard Range (Table 1). In Victoria Valley, analyte concentrations from the pits described here on Victoria Upper Glacier and Clark Glacier fit well into the decreasing trend described in Reference Bertler and MayewskiBertler and others (2004b) for Wilson Piedmont Glacier (WPG), Victoria Lower Glacier (VLG) and Baldwin Valley Glacier (BVG). A similar comparison can be made in the Asgaard Range comparing data from Commonwealth Glacier with data collected from Newall Glacier (Reference WelchWelch, 1993). This comparison likewise confirms that given presumably similar soil influences (both sites reside on the ridge between Taylor and Wright Valleys), opposing trends in elevation and species concentration dominate. The time period for the Newall record does not intersect with the time period covered here, but significantly lower values for all ions on Newall Glacier relative to Commonwealth Glacier likely represent a real trend, given the large difference in elevation and proximity to valley soil material between the two sites. The lower Na : Cl ratio also suggests more substantial sea-salt fractionation at Newall Glacier than at Commonwealth.
Table 1. Comparison of numerical mean concentrations (in µgL¯1) for ion and metal species and isotope ratios (expressed as ‰ deviation from V-SMOW standard) from four sites presented here (Commonwealth (CMW), Blue (BG), Clark (CL) and Victoria Upper (VU) Glaciers) with data for Wilson Piedmont Glacier (WPG), Victoria Lower Glacier (VLG), Baldwin Valley Glacier (BVG) and polar plateau (PP) from Reference Bertler and MayewskiBertler and others (2004b), Commonwealth Glacier data from Reference Lyons, Welch, Fountain, Dana and VaughnLyons and others (2003), and Newall Glacier (NG) data from Reference WelchWelch (1993). Format is similar to that in Reference Bertler and MayewskiBertler and others (2004b), with species organized from left to right according to increasing distance from the coast. Some of the species designations regarding source have been altered from those used in Reference Bertler and MayewskiBertler and others (2004b) based on results presented here. Note that Reference Lyons, Welch, Fountain, Dana and VaughnLyons and others (2003) and Reference WelchWelch (1993) did not publish error bounds with their data, and that xs-Ca (from Reference Lyons, Welch, Fountain, Dana and VaughnLyons and others, 2003) is equivalent to nssCa as defined here

However, the adjacent exposed valleys and salt-rich soils of the MDV complicate the relationships between site chemistry and elevation or distance from the coast when data are compared among the Clark, Commonwealth, Blue and Victoria Upper sites. Based on the data collected at these four sites, when chemistry is compared among the valleys, rather than within a particular valley, concentration gradients no longer exist with respect to either of these variables. The Commonwealth Glacier snow pit, for example, which is only 12.5 km from the coast and at 723ma.s.l. has lower values for Na+ than does the Clark Glacier pit, which is 30 km from the coast and 816ma.s.l. Blue Glacier, 25 km from the coast and at 1022ma.s.l., likewise yields lower values for Na+, Cl– and Mg2+ than does Victoria Upper Glacier, 60 km from the coast and at 1350m a.s.l.
Total concentrations of major ions generally decrease from north to south within 30 km of the coast. The most northerly site, Clark Glacier, has the highest values in seven of eight species, and the most southerly site, Blue Glacier, has the lowest values. Concentrations for Commonwealth Glacier fall inside the range of values for Blue and Clark Glaciers. Ca2+ provides the notable exception to this pattern, with Blue Glacier having the highest mean concentrations, 50% higher than those found at Clark Glacier and 400% higher than those at Commonwealth.
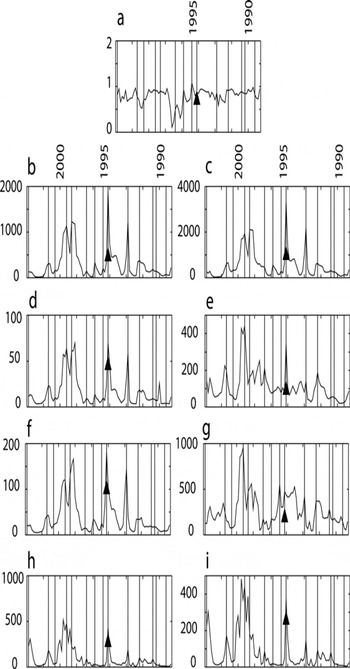
Comparison with major-ion data from Reference Lyons, Welch, Fountain, Dana and VaughnLyons and others (2003) at Commonwealth Glacier highlights high intraannual and interannual variability in MDV chemistry. Disagreement between the data of Reference Lyons, Welch, Fountain, Dana and VaughnLyons and others (2003) and the results here is likely because the former study was conducted using surface samples, including in most cases ∼5 cm of surface snow collected in early austral summer (Reference Lyons, Welch, Fountain, Dana and VaughnLyons and others, 2003) and representing roughly half of the mean annual accumulation as calculated from the samples collected in our work. As described above, surface snow in the MDV during austral summer has peaks in Na+ and several other ionic species. This dictates that the means of Reference Lyons, Welch, Fountain, Dana and VaughnLyons and others (2003) represent mean peak values, while the record presented here includes both lower ‘background’ winter values and these peak values. When the values of Reference Lyons, Welch, Fountain, Dana and VaughnLyons and others (2003) are compared with the peak values presented here, the results agree within sampling/timing errors (Fig. 6).

Fig. 6. Mean major-ion concentrations from Reference Lyons, Welch, Fountain, Dana and VaughnLyons and others (2003) (black triangles) plotted within the annually dated records reported here for (a) Na:Cl, (b) Na+, (c) Cl–, (d) K+, (e) NO3 –, (f) Mg2+, (g) SO4 2¯, (h) Ca2+ and (i) nssCa2+. The data from Reference Lyons, Welch, Fountain, Dana and VaughnLyons and others (2003) were collected in the three summer seasons surrounding 1994/–95. These seasons recorded some of the highest peaks in the record in most ions. The data from Reference Lyons, Welch, Fountain, Dana and VaughnLyons and others (2003) were translated from µmol L–1 to µgL–1 for comparison in all cases except Na:Cl, where the data presented here were translated into µmol L–1 to compare ratios.
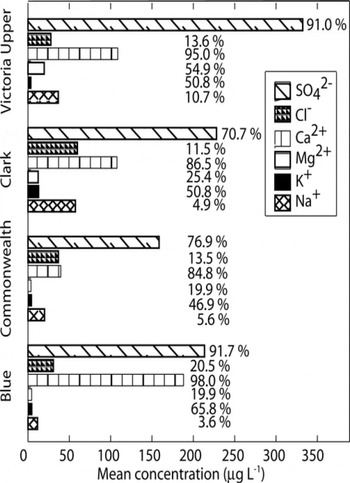
Non-sea-salt (nss) concentrations at these sites provide additional clues regarding variation in MDV snow chemistry. Concentrations of Ca : K : Mg : Na : Cl : SO4 within each sample that conform to the sea-salt proportions of 1.04:1.00:3.24 27.00:55.00:7.76 are considered to derive from a sea-salt source. Non-sea-salt species are here defined as the amount of sample chemistry that cannot be explained using the above ratios (Reference Legrand and MayewskiLegrand and Mayewski, 1997). Because it is possible that material other than sea-salt aerosols may have these analytes in the same proportions, the method used here provides a minimum estimate for non-sea-salt contribution to chemistry. Differences between total and non-sea-salt chemistry are most pronounced at Clark and Commonwealth Glaciers, where Na+ and Cl− dominate the overall ion budget,but nssSO4 2− and nssCa2+ are the largest contributors for non-sea-salt species (Fig. 7). Non-sea-salt Ca2+ and nssSO4 2– dominate both the total Ca2+ and SO4 2– budgets and the total non-sea-salt ion budget at all four sites (though the mean nssCl– concentration at Commonwealth Glacier is not significantly different from that of nssCa2+). Values for nssCa2+ and nssSO4 2– at the sites are also from 120 to >1000% higher than total (ss + nss) concentrations for these species on the nearby polar plateau (Reference SteigSteig and others, 2000;Reference Bertler and MayewskiBertler and others, 2004b), indicating that MDV ice contains local soil inputs in addition to those associated with long-range transport.

Fig. 7. Non-sea-salt components of Na+, K+, Mg2+, Ca2+, Cl and SO4 2− at Victoria Upper, Clark, Commonwealth and Blue Glaciers. Bars represent absolute concentration in µgL–1, while the value beside each bar describes the percentage of that ion found in nonsea-salt material relative to the total amount of the ion measured (e.g. on Victoria Upper Glacier, 91% of SO4 2¯ is determined to be of non-sea-salt origin, while 9% is calculated as the sea-salt contribution).
Trace metals
Of the trace metals analyzed for these sites, six will be discussed here, chosen to represent a variety of metal species. Al and Fe, for example, represent the largest absolute contributions to the MDV metal budget, Sr is abundant in both the terrestrial and the marine environment, and oxides of Mn play a key role in particle scavenging of trace elements in MDV lake water (Reference De Carlo and Green.De Carlo and Green,2002). Cu and Nd here represent examples of trace constituents and the REE. All metals, except Sr, occur in MDV snow and ice in ratios relative to the major ions orders of magnitude higher than exist in sea water (Reference Weisel, Duce and FaschingWeisel and others, 1984;Reference Abollino, Aceto, La Gioia and SarzaniniAbollino and others, 2001).
Note: ND: no data. *nssCa for Reference WelchWelch (1993) calculated according to author’s statement of ∼9O% nssCa fraction.
Samples from Clark Glacier have either the highest or near-highest mean concentrations for these sites in all of these metals except Sr; samples from Commonwealth Glacier have among the lowest metal concentrations. Concentrations of Fe at all sites are comparable to values found by Reference Mayewski and LyonsMayewski and Lyons (1982) (∼20–270µgL–1) in a study of Meserve Glacier covering ∼370 years of MDV climate history. However, they are substantially higher than concentrations reported by Reference Bertler and MayewskiBertler and others (2004b) in a survey of snow pits (covering 20–35 years) from four sites in Victoria Valley. Because three of the sites in that study were either on the polar plateau or on glaciers in closer proximity to the coast, these concentrations may represent more direct coastal or plateau influences than do concentrations from the sites described here, which are located in closer proximity to the uncovered valley floors and farther from the Ross Sea.
In order to examine chemical variation in the insoluble particulate fraction at these sites, enrichment factors relative to Al are defined as:
where C is the concentration of the metal in question (in µgL–1), and listed in Table 2. These enrichment factors yield a complex picture, but among the four metals with the highest concentrations (Al, Fe, Sr and Mn), ratios are closer to values for the upper crust (Reference WedepohlWedepohl, 1995) at the more northern sites, with the Clark and Victoria Upper sites being closest to these values. These trends may represent either an increasing soil influence to the north, different soil types at the four sites, or soil particulate fractionation during transport.
Table 2. Metal:Al ratios for Clark, Commonwealth, Blue and Victoria Upper Glaciers, and enrichment factors associated with these ratios. Upper crust values from Reference WedepohlWedepohl (1995)

Discussion
Spatial differences in mean chemistry among the sites presented here can be divided into differences between two sites along a west–east axis (Victoria Upper and Clark Glaciers) and differences among three sites along a coastal north–south axis (Clark, Commonwealth and Blue Glaciers). Data from the east–west sites examined here confirm previously documented trends in concentrations in Victoria Valley based on distance to the Ross Sea and on elevation. However, while Reference Bertler and MayewskiBertler and others (2004b) classified K+, Mg2+ and Sr as marine species, at the sites discussed here it appears these ions share a mixed terrestrial/marine source. Though mean concentration differences between Reference Bertler and MayewskiBertler and others (2004b) and this work might be explained by slightly different time periods covered by pits, the likelihood of soil influence playing a role is supported by non-sea-salt species analysis, in which calculated nssMg2+ comprises 25–50% of total Mg2+ and nssK+ comprises ∼50% of total K+ at the Clark and Victoria Upper sites.
When compared with the work by Reference Lyons, Welch, Fountain, Dana and VaughnMayewski and others (1995) and Reference WelchWelch (1993) on Newall Glacier, these results also suggest similar geographically driven trends within the glaciers of the Asgaard Range. However, the data presented here also support the hypothesis of Reference WelchWelch (1993) that relatively high values for Ca2+ and SO4 2− at Newall Glacier (NG in Fig. 1) are related to the nearby MDV soil source. Reference WelchWelch (1993) found ∼90% nssSO4 2− which is the same value found here for Blue and Victoria Upper Glaciers.
When examined alongside these relationships among mean chemistry data, elevation and distance from the coast within the Asgaard Range and the Victoria Valley, the lack of chemistry trends following these two variables along the axis of the coast suggests separate dominant influences. The
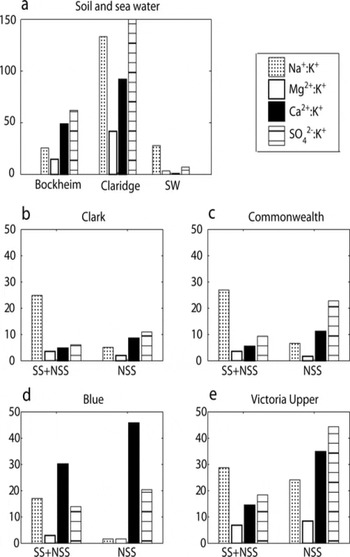
simplest explanation for north–south variation at these sites lies in the different local exposures to soil and marine sources from which they draw material. Because soil salt chemistry within the Dry Valleys varies spatially (Reference Claridge and CampbellClaridge and Campbell, 1977;Reference Keys and WilliamsKeys and Williams, 1981;Reference BockheimBockheim, 1997), we would expect to see a correspondingly complex influence on snow and firn chemistry. However, examination of published data describing the salt composition of a wide selection of MDV soil samples reveals some common patterns. In particular, ratios between Mg : K and Ca: K are both higher in all MDV soil samples than they are in sea salt (Fig. 8) (Reference Claridge and CampbellClaridge and Campbell, 1977;Reference Keys and WilliamsKeys and Williams, 1981; Reference BockheimBockheim, 1997;Reference Abollino, Aceto, La Gioia and SarzaniniAbollino and others, 2001). The magnitude of these ratios also provides an identifiable pattern, with marine material showing a Mg : K ratio higher than the Ca : K ratio, and soil material showing the opposite. The relationship between Mg : K and Ca : K in the snow and firn examined here is similar to that shown by samples from the soil source (though lower in magnitude), highlighting the influence of valley soils in determining solute chemistry at these sites.

Fig. 8. Molar ion ratios of material collected at MDV sites (total (= SS + NSS) and the non-sea-salt component (=NSS)) compared with those of mean regional soil samples and of sea water. Bockheim mean ratios include data from eight sites (Reference BockheimBockheim, 1997), while Claridge mean ratios include data from 20 sites (Reference Claridge and CampbellClaridge and Campbell, 1977). Ratio of SO4 2−:K+ is 109 for the excess material at the Victoria Upper site, though axis was kept at 60 for purposes of comparison. Note that the scale is higher for soil samples (0–150) than for snow-pit samples (0–60).
Different influences from marine air masses further distinguish the chemistry of each site. Na+, Cl– and MS– likely reflect this marine influence. Both Clark and Commonwealth Glaciers, where Na+ and Cl– concentrations are highest, have uninterrupted corridors to the coast through which up-valley winds characterizing summer daytime ground-level flow can carry marine aerosols. Clark Glacier in particular has two exposures, through Victoria and Wright Valleys, leading to the highest concentrations of marine species at this site. Victoria Upper Glacier, though twice as far from the coast as the other sites, likewise sits at the head of Victoria Valley, which may funnel marine species inland. Blue Glacier, on the other hand, though relatively close to the coast, is sheltered from low-elevation marine air to the east by a coastal range of mountains with peaks from 800 to 1500m elevation. The combination of this shelter from the marine environment and a presumed high-calcium soil source may give Blue Glacier its unique ion signature of high Ca2+ concentrations alongside low concentrations of other major ions relative to the other sites.
Although the close proximity of soil materials to snow surfaces in the MDV makes the examination of terrestrially derived particulates particularly critical, the Dry Valleys are not unique in the presence of these materials. In areas of Antarctica more remote from soil sources, a variety of studies have drawn conclusions regarding the likely provenance and the potential effects of insoluble trace metals (Reference Boutron and LoriusBoutron and Lorius, 1979;Reference BoutronBoutron, 1982;Reference Edwards, Sedwick, Morgan and BoutronEdwards and others, 1998;Reference Edwards and SedwickEdwards and Sedwick, 2001). The work here, however, demonstrates that the effect of this terrestrial material may not only be isolated to the classically ‘terrestrial’ elements, such as Al and Fe, but may also influence the chemistry of what are considered to be more ‘marine’ indicators, such as Na+ or Mg2+. While calculations of the non-sea-salt fraction of these materials provides some accounting for this influence, the presence of terrestrial material coincident with these marine elements should be examined carefully when drawing conclusions regarding their climatic significance.
Conclusions
Snow pits excavated to 2 and 3 m at Victoria Upper, Clark, Commonwealth and Blue Glaciers in the Dry Valleys provide information on marine and local soil chemistry input into regional surface snow and firn. Measurements from additional pits at locations separated by hundreds of meters at Clark and Commonwealth Glaciers show significant variability, and require both marine and soil inputs to explain. Chronologies based on marine-species input, confirmed alongside mass accumulation rates measured directly by networks of mass-balance poles, show that these four sites share a common time frame of 1989–2002, with some of the sites having slightly longer coverage. Accumulation rates average 2.5, 3.4, 3.1 and 4.6cmw.e. for Clark, Commonwealth, Blue and Victoria Upper sites, respectively; our interpretation of temporal data from Victoria Upper Glacier is offered with a caution regarding signs of potential subsurface melting at this location.
A survey of mean chemistry among the sites shows Clark and Commonwealth Glaciers with the highest concentrations in marine species (350 and 167 µgL−1 for Na+, 25 and 21 µg L−1 for MS−), while Blue Glacier shows unexpectedly low concentrations (72 µgL−1 Na+, 10 µgL−1 MS−), likely related to shelter provided by a coastal range to the east. Trace metals are in highest abundance at Clark Glacier (Al concentration = 234µgL−1), with the lowest concentrations found at Commonwealth Glacier (Al concentration = 45 µgL−1). Major-ion concentrations at Victoria Upper, Clark and Commonwealth sites are in good agreement with previously published intra-valley trends in Victoria Valley and the Asgaard Range, showing broadly decreasing values with increasing distance from the coast and increasing elevation. However, along a north-south axis trends in chemistry following elevation and distance from the coast do not appear. Instead, variations related to different soil sources and exposures to the Ross Sea dominate coastal mean chemistry gradients at these sites.
The circumstances defining the MDV climate system, including the onshore-offshore wind regime, widespread aridity and exposed rock and soils, help to give the valleys their unique character. This character also creates a wide selection of individual snow and firn signatures within a small area. Understanding broader climate changes in this area will therefore require continuing attention to local variation in Dry Valleys ice-core and snow-pit locations so as to be able to determine the difference between regional climate change and local variability. These results also suggest caution is required in defining separation between ‘marine’ and ‘terrestrial’ signals in Antarctic ice and snow samples.
Acknowledgements
We thank all of the people who assisted in conducting this research. In particular, M. Wasckiewicz, T. Gacke, E. Osterberg, S. Arcone, T. Burdet and K. Lindemueller provided assistance at our field locations, without which this project would have been impossible. In addition, the assistance of Raytheon Polar Services Company and of the pilots and staff from PSI for helicopter support is greatly appreciated. For help with global positioning system (GPS) surveys and map generation, we thank B. Bartel and J. Walker, with the University Navstar Consortium (UNAVCO) and the United States Antarctic Program, respectively. Funding for this project was provided under US National Science Foundation Award OPP 0228052.