


Introduction
The snowpack consists of layers which, after collapse, disintegrate and transform into a granular fluid. The physical properties of the granules (size, hardness, shape) play an important role in the dynamics of snow avalanches. Since the 1980s, avalanche dynamic models have been proposed that account for how the granular interaction influences flow friction (Reference Salm and GublerSalm and Gubler, 1985; Reference Norem, Irgens and SchieldropNorem and others, 1987; Reference DentDent, 1993; Reference SalmSalm, 1993). Reference Issler, Errera, Priano, Gubler, Teufen and Krumme-nacherIssler and others (2008) have shown that avalanche motion and path are affected by the granulometric properties of the multilayered flow, in such a way that dense core and fluidized layers might have different directions depending on the topography of the slope. More recent models explicitly track the evolution of granular fluctuation energy (Reference Bartelt, Buser and PlatzerBartelt and others, 2006; Reference Buser and BarteltBuser and Bartelt, 2009). A basal layer of ice grains with high friction ensures fast motion of the upper layers, in which the low shear rates allow the cohesive grains to sinter together (Reference Rognon, Chevoir, Bellot, Ousset, Naai’m and CoussotRognon and others, 2008). In the deposition zone, grain dimension, d, varies from solid blocks, which can be >200 mm in diameter, to smaller elements (d < 50 mm) (Reference Bartelt and McArdellBartelt and McArdell, 2009). The grain distribution has been shown to depend upon avalanche type: in dry avalanches median grain sizes are smaller than in wet snow avalanches, which are characterized by larger blocks. The former are, moreover, better sorted than the latter (Reference Bartelt and McArdellBartelt and McArdell, 2009). In addition, recent studies conducted in snow chutes have shown that the maximum diameter can reach the entire flow depth (Reference Rognon, Chevoir, Bellot, Ousset, Naai’m and CoussotRognon and others, 2008). Reference Jomelli and BertranJomelli and Bertran (2001) analyzed the deposit of 25 wet snow avalanches in the French Alps and noted that the distribution of grains shows a vertical and longitudinal sorting that reflects a sieve effect, similar to that observed in other rapid internal granular flows (e.g. debris flow).
Granulometric investigations are usually part of geotechnical research. The analysis of soils often requires the evaluation of the dimensions and the percentage of particles of a given size in order to classify sands, limes and clays. Operatively, a sample of soil is riddled using sieves with different mesh sizes. The weight of the material fraction retained in each sieve is related to the total weight and the data are plotted on logarithmic scales. Cumulative curves, i.e. log-normal, as well as Weibull and Pareto distributions, are usually employed for data interpretation. Reference TurcotteTurcotte (1997) collected granulometric data from deposits of different fragmented objects (quartz, gneiss, granite, asteroids, clays, glacial till, ash, etc.) and plotted the cumulative curves on log-log scales. He observed that the plotted points may be interpolated with a power law, which can be easily related to a fractal law with the form
where r is particle size, N is the number of particles which are larger than (or equal to) the considered size and D is the fractal dimension (Reference MandelbrotMandelbrot, 1982). In general, the latter belongs to ℚ+ (i.e. the set of all positive rational numbers) and might not be an integer (otherwise it would be considered as a Euclidean dimension). The strength of brittle materials, however, has been observed to be size- dependent, and a fractal approach has been shown to confirm experimental evidence (Reference CarpinteriCarpinteri, 1994; Reference Carpinteri and ChiaiaCarpinteri and Chiaia, 1995; Reference Chiaia, Cornetti and FrigoChiaia and others, 2008).
The concept of scale invariance has also been applied in snow engineering (Reference Chiaia and FrigoChiaia and Frigo, 2009). Reference Rosenthal and ElderRosenthal and Elder (2003) analyzed the behavior of 8023 avalanches over 140 different paths and observed a fractal power law between a given crown size and the number of larger events. This tendency has been confirmed by Reference Faillettaz, Louchet, Grasso, Daudon, Dendievel and StevensFaillettaz and others (2002, Reference Faillettaz, Louchet and Grasso2003) observing the behavior of 5000 avalanches in the French Alps monitored over 4 years. They supposed that the roll-off observed at large crown sizes in plots involving the slab depth may indirectly reflect a scale-invariant distribution of snow shear resistance. Reference Chiaia, Frigo, Carini, Mimmi and PivaChiaia and Frigo (2007) analyzed three-dimensional (3-D) radiographs of four cubic samples of snow at different densities in detail and introduced a deterministic model to describe the distribution of ice grains. The authors confirmed that the fractal dimension, D, is the parameter that optimally describes the distribution of the voids in the snow sample, and that it can be used to represent the scaling of the mechanical properties of snow at different sizes. Furthermore, to capture the randomness of the local structure of real snow samples and to investigate snow metamorphism, random fractal models (Reference Carbone, Chiaia, Frigo and TurkCarbone and others, 2009) and generalized Menger sponge models (Reference Carbone, Chiaia, Frigo and TurkCarbone and others, 2010) have been used. Using D and the size invariance of snow shear strength, Reference Chiaia and FrigoChiaia and Frigo (2009) presented a renormalization group model to describe the spontaneous release of slab avalanches.
The present work investigates the granulometric distribution of ‘snow grains’, which are defined as the solid rounded aggregates of ice particles formed during the shear flow within the dense core of an avalanche (Reference Bartelt and McArdellBartelt and McArdell, 2009). We adopt a fractal description of the material that is able to reproduce the cohesive behavior of snow. The paper is organized as follows. First, the fractal model of a two-dimensional (2-D) grain distribution is illustrated and the new concept of aggregation probability is presented. Then a complementary cumulative function of snow grain sizes is calculated, in order to compare the results of the model with real data related to the deposit area of a snow avalanche. Finally, the physical meaning of model parameters is discussed, the application of the model to a real avalanche event is shown and an extension to multifractality is presented.
A Fractal Model for Snow Grain Distribution
In the analysis of snow avalanche granulometry, power laws have been highlighted by the research of Reference Rognon, Chevoir, Bellot, Ousset, Naai’m and CoussotRognon and others (2008), conducted in a channel chute. Supposing that the flow is initially made of a mixture of single ice particles, they used particle optical techniques to find that the size distribution of snow grains in a steady and uniform avalanche flow can be described with a power law similar to Eqn (1) with D = 2.
In the model presented herein, the fractality is governed by the a-value, defined in detail below, which reflects the capacity of the ice particles to aggregate to form snow grains. The influence of the capacity of particles to aggregate on the fractal dimension has been highlighted by other research on fractal properties of cohesive materials and biological structures (e.g. Reference Logan and WilkinsonLogan and Wilkinson, 1990; Reference KranenburgKranenburg, 1994; Reference Son and HsuSon and Hsu, 2008).
Due to the brittleness of ice grains in snow, the analysis of grain-size distribution of an avalanche deposit cannot be performed using the common geotechnical approaches, which suppose sieving, because the mechanical action breaks up the aggregates and the measurements may therefore be misleading. In that sense, the granulometric distribution of the deposit must be related to only the surveys performed on the surface (Reference Bartelt and McArdellBartelt and McArdell, 2009). The fractal model proposed in this paper reflects the difficulty in having data related to the core of the deposit.
In general, as anticipated by Eqn (1), a fractal distribution can be expressed as

where Ni is the number of objects with a characteristic linear dimension ri (say the diameter) and C is a constant term (Reference MandelbrotMandelbrot, 1982; Reference TurcotteTurcotte, 1997). Equation (2) can be defined as a fractal density and is the basis of the granulometric model proposed here.
Let us suppose that large snow aggregates derive from the union between smaller particles which, in turn, originate from a similar mechanism, and so forth. Let a be the probability that, for a given set of elements of equal characteristic size, particles merge with each other to form a grain of bigger size. That quantity, which can be defined as ‘probability of aggregation’, is a direct consequence of sintering between particles, as highlighted by Reference Rognon, Chevoir, Bellot, Ousset, Naai’m and CoussotRognon and others (2008). For a = 0 no aggregates form, while for a =1 all the particles merge. Intermediate values imply that, on the surface, both aggregates and single particles are present.
A square element with a linear dimension l0, representing the zero-order cell is given. The corresponding area is
and the number of elements of that size is N 0. Four zero- order cells may aggregate and form a first-order element with dimension l 1 = 2l 0 with area
Considering that a is the probability of each generic ith-order cell aggregating with a similar one, the probability that a grain of (i + 1)th order will form is
Each event, i.e. the aggregation of two particles, is statistically independent for each particle. Therefore,
Since four zero-order cells are needed to generate a first-order cell, the number of first-order cells is

After aggregation, if a differs from one, there are still zeroorder particles that remain separated. The number of these is
The problem is now renormalized and first-order elements are treated exactly as the zero-order elements treated above. Each particle with dimensionl 1 = 2l 0 is now taken to be the source of second-order elements with dimension l 2 = 4l 0. The area of each second-order element is
and the number of particles is given by

As before, the number of first-order particles that remain separated is
This process is repeated at successively higher orders for large particles (Fig. 1). For the nth cell, with linear dimension l n = 2 n l 0, the area is

Fig. 1. Fractal model of snow grain merging up to the third level.
while the number of unaggregated elements is given by

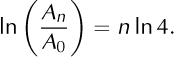
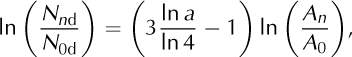
Substituting Eqn (8) in Eqn (13), N nd may be related to unaggregated zero-order elements, i.e.

Taking the natural logarithm of both sides of Eqns (14) and (12), one can write

and
Replacing Eqn (16) in Eqn (15) gives
which is equivalent to

Equation (18) may then be rewritten as

since

where l n is the characteristic dimension of the nth-order cell, Eqn (19) becomes
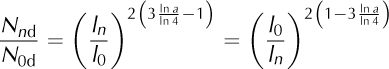
and the number of unaggregated cells of nth order is
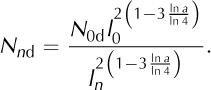
Analogies between Eqns (22) and (2) are clear. The fractal dimension, D, is equal to
while the constant term, C, is equal to
The fractal model of grain distribution on the deposition surface of a snow avalanche is now mathematically formulated. Fractal dimension, D, depends upon the value of the probability of aggregation, as detailed in Table 1. The fractal dimension is always ≥2, which represents the highest order, and it tends to infinity for a = 0 (highest disorder).
Table 1. Values of the fractal dimension, D, as a varies from 0 to 1

The Complementary Cumulative Fractal Function
This fractal model allows us to calculate (once the constant term, C, and the fractal dimension, D, are fixed) the number of grains of a given linear dimension. Usually, granulometric distributions are described with cumulative functions. Within a fractal framework, granular distributions will be described by cumulative fractal density functions. From Eqn (2), and from the results of the previous section, i.e. Eqns (23) and (24), the fractal density function can be expressed as
Given the grain diameter, x, the cumulative fractal function, N cum(x), representing the number of elements smaller than x, can be calculated as
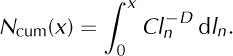
Note that analytical integration is not finite because the integrand function is unbounded in the integration interval. That is, for D > 0
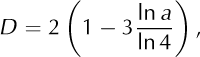
Solving the integral, remembering D ≠ 1,
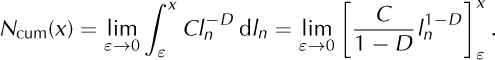
The definite integral does not exist in (0; x] because
Therefore, definite integration has to be performed in a reduced interval. This assumption reflects the physical aspect that a minimum dimension (e.g. a ‘quantum of snow’) is a model input. As a matter of evidence, it can be taken as the diameter of the smallest of particles constituting the avalanche deposit (i.e. of elementary ice grains). Thus, once the minimum particle dimension, φ min, is defined, the cumulative fractal function can be calculated from

Solving the integral, for a size x, the cumulative fractal function is

For x = φ min, this is equal to zero, and for larger grain dimensionsNcum increases accordingly.While it is necessary to focus attention on larger rather than small particles, it is convenient to compute the complementary cumulative function which has the maximum value for the smallest diameter and decreases to zero for larger particle sizes. For a given length x, Eqn (31) gives the number of particles of size ≥ x. Therefore, the complementary cumulative function, N compl, is
where N max is the maximum number of elements, which can be calculated from Eqn (31):

The final form of Eqn (32) can be written as

note that this is independent of the minimum particle size.
As before, analogies between Eqns (34) and (2) can be found. The complementary cumulative function can be rewritten in the form
where the constant term is
and the fractal dimension is
which depends, in turn, upon the probability, a,
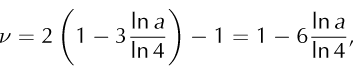
as shown in Table 2.
Table 2. Values of the fractal dimension, ν = D − 1, for a varyingfrom 0 to 1

Model Parameters
The physical implications of the above model parameters are now investigated. Although the fractal dimension, D, and the constant term, C, can be related to the probability, a, and to the number of particles, N 0d, it is better to discuss quantities C and a, which directly affect D.
Firstly, it is important to justify some choices made throughout the model formulation. Although circular or hexagonal elements can also generate fractal series, for simplicity we use square elements. The basic idea behind the model is the same. As shown below, independent of the generating element, the fractal dimension D → 2, i.e. the complete covering of the surface, and a → 1. Then the ratio u = l i+1/l i between higher- and lower-order element sizes is taken equal to 2. With this approach, it is possible to sinter nine lower-order elements to form one higher-order element (in that case the size ratio, u, would be 3) without changing the main idea behind the model. The parameters would change but the fractal properties of the system remain.
Taking the logarithm of both sides of Eqn (2):
Plotting log r as an independent variable and log N as a dependent variable, D is the slope and log C the y intercept of Eqn (39) in a log-log coordinate system. The C-value (Eqn (24)) represents the number of particles of characteristic length equal to one, that remain separated. The fractal dimension, D, refers to the power of aggregation and with higher values, i.e. as D approaches 2.00, the size of the largest particle increases. The probability, a, accordingly, reflects the fact that for a = 0 there are only particles of unitary size, i.e. only small grains are observed. For a = 1 the surface is totally filled with grains because the fractal dimension collapses onto the Euclidean dimension, D = 2.
In Figure 2, Eqn (2) is plotted for different values of a and C. Dotted lines refer to C = 1000, while continuous lines refer to C = 10 000. The black lines refer to a = 0.9 and gray lines refer to a = 0.7. As can be seen, an increase of C-value shifts the plot to higher N nd values and, as a increases, the absolute value of the slope of the line reduces, i.e. there is less difference between the continuous and dotted lines.

Fig. 2. Dependence of N nd = C/rD about a and C.
Although both a and C affect the granulometric distribution, the only parameter that could be helpful in distinguishing between avalanche types is the fractal dimension, D. In fact, the C-value depends upon the number of measurements taken during the field survey and on the spatial extension of the sampling zone.
From the observations taken during avalanche events, we believe that high values of D, typical of ash and glacial tills (Reference TurcotteTurcotte, 1997), correspond to dry avalanches where the fluidized layer is developed, whereas values of D close to 2 might be related to wet avalanche flows for which the powder-like fraction is reduced (Reference Bartelt and McArdellBartelt and McArdell, 2009).
Application to a Real Case
A real set of granulometric data was collected in order to test the predictions of the model. On 19 March 2011 a granulometric survey was made at Punta Seehore test site, Aosta Valley, northwestern Italian Alps, to collect grain-size data (Fig. 3). The sampling methodology adopted was as described by Reference Church, McLean, Wolcott, Thorne, Bathurst and HeyChurch and others (1987) and also used by Reference Bartelt and McArdellBartelt and McArdell (2009) in snow avalanche deposits.

Fig. 3. Punta Seehore test site on 19 March 2011. Average grain size is a few centimeters.
Following this approach, the surveyor first divides an area of 5 × 5 m2 into a 50 cm grid mesh and then measures the size of the aggregates lying exactly under each vertex. The sampling is considered satisfactory when the number of measured grains is >100 (Reference Bartelt and McArdellBartelt and McArdell, 2009). Grain diameters are grouped into size classes in a geometric progression following 21/2 with diameter, d (mm), taken, by convention, to be the intermediate length of the three orthogonal axes. Performing the survey, the authors encountered difficulties, in particular when it was not possible to distinguish the grains buried in snow powder. Because of this, no particles of <45 mm diameter were counted in the analysis. This aspect does not invalidate the results, because the mass of the avalanche is contained in the large grains, and particles several centimeters in diameter are relevant for the flow rheology (Reference Rognon, Chevoir, Bellot, Ousset, Naai’m and CoussotRognon and others, 2008). It is, however, necessary to develop more sophisticated methods so smaller aggregates can also be considered in future work (Reference Rastello, Rastello, Bellot, Ousset, Dufour and MeierRastello and others, 2011). The results of the survey are reported in Table 3. Although the collected dataset is limited, it is possible to draw preliminary conclusions about the effectiveness of the model.
Table 3. Punta Seehore 19 March 2011: granulometric classes, number of particles of each size and complementary cumulative value

The complementary cumulative values are plotted vs grain size in Figure 4. The line shows the complementary cumulative function, (Eqn (35)) with fractal dimension v = 1.1262 and B = 12 448. The statistical goodness-of-fit parameter R2 = 0.8694. Using Eqn (38), the corresponding probability of aggregation is computed as a = 0.97. In parallel, the D-value is computed (Eqn (37)) as D = 2.1262. The values of the parameters show that the avalanche behavior was similar to wet snow avalanches (high a-value and D close to 2), confirming the on-site observations.

Fig. 4. Punta Seehore test site (19 March 2011). Surveyed data (×) and fractal fitting with the cumulative complementary function(−) of Eqn (35) with ν = 1.1262 and B = 12 448 plotted on the grain-size vs complementary cumulative values diagram. 95% prediction bounds are represented by dotted lines. The goodnessof- fit parameter R 2 = 0.8694.
This fitting shows that the surveyed data are not well fitted by the previous fractal scaling law at small and large diameters. This is mainly due to the finite number of observations, which imposes a horizontal left-hand side asymptote, set at the total number of observations, in the log-log plot. Because of this we suggest a multifractal scaling law (MFSL) similar to that proposed by BaZant for concrete strength (Reference BažantBažant, 1984). Any MFSL has a plot similar to that presented in Figure 5: the function is limited by a horizontal and an oblique asymptote. Physically, we assume that the horizontal asymptote can be ascribed to the limited number of observations performed at small scales. (Implications of this limitation are an object of our current research.) However, fractal behavior emerges at the medium and large scales; in this region, the oblique asymptote of Figure 5 represents the fractal (power-law) behavior previously discussed. Thus, the multifractal complementary cumulative function, N compl, is now rewritten as


Fig. 5. A MFSL plot with horizontal and oblique asymptotes.
where α can be interpreted as the ‘hypothetical’ total number of observations. In fact,

where γ represents the slope of the oblique asymptote of the MFSL curve for x → ∞ to. This can be proved by taking the logarithm of both sides of Eqn (40) and studying the first derivative. In parallel, it is straightforward to demonstrate that the, 3-value represents a characteristic snow grain size, as shown in Figure 5, representing a sort of ‘turning point’ between a limit condition (on the left-hand side) and a linear fractal model (on the right-hand side).
The surveyed data were analyzed using the MFSL model presented in the previous paragraph. Figure 6 shows the plot of the multifractal complementary cumulative function (Eqn (40)) with parameters α = 129, β = 793 and γ =−4.481. The statistical goodness-of-fit parameter R 2 = 0.9921, showing a better fit than the fractal scaling law of Eqn (35).
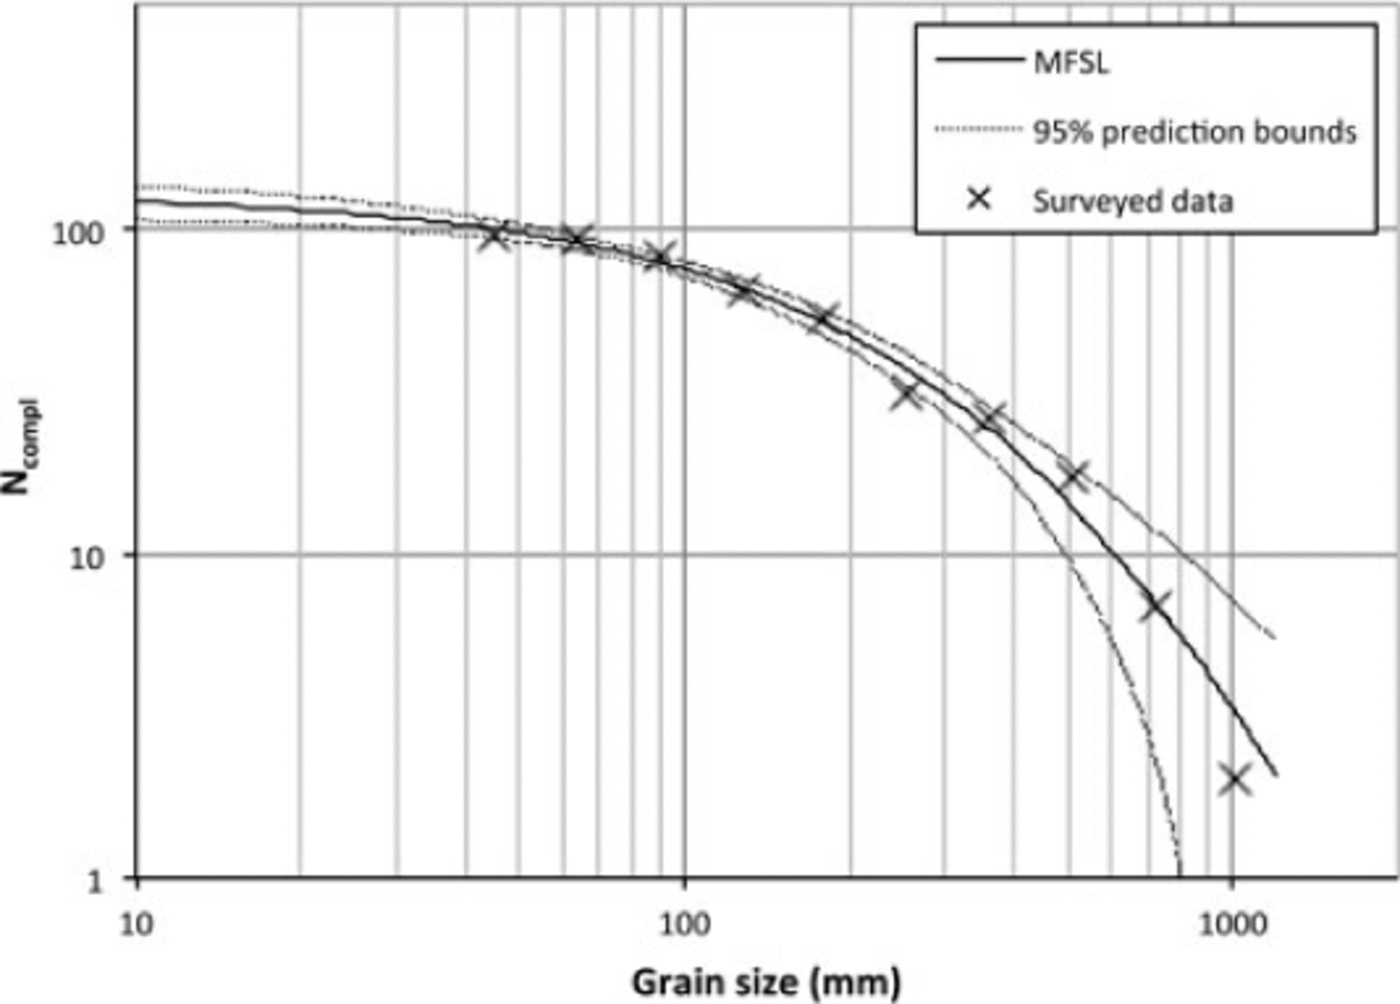
Fig. 6. Punta Seehore test site (19 March 2011). Surveyed data (×) and fractal fitting with the multifractal cumulative complementary function (−) of Eqn (40) with α = 129, β = 793 and γ = −4.481, plotted on the grain-size vs complementary cumulative values diagram. 95% prediction bounds are represented by dotted lines. The goodness-of-fit parameter R 2 = 0.9921.
Conclusions
We have developed a fractal model able to investigate the ice grain-size distribution in the deposit of a snow avalanche. First, an aggregation probability taking into account sintering processes between snow grains was introduced. Considering this quantity to be scale-invariant, the process of aggregation is extended from single grains to larger blocks. Thus, a power law with a fractal exponent is obtained to describe the number of particles of a given dimension. In order to analyze data from real measurements, the cumulative complementary quantity was defined and, in order to address the lack of fit for small and large particles, a multifractal model was introduced and first results are presented. The 2-D model herein might be extended to a 3-D case, which would be able to consider the granulometric distribution within the entire deposition area, using the same approach and considering that the probability for which a snow grain of higher order is generated, i.e. Eqn (5), is a 7, and eight cubes of characteristic dimension, l, are needed to form a cube of dimension 2l, and so forth. As before, the choice of a cube is totally arbitrary, in the sense that one can adopt other shapes without changing the fractal aspect of the problem.
In addition, field measurements have shown that the procedure suggested by Reference Church, McLean, Wolcott, Thorne, Bathurst and HeyChurch and others (1987) for riverbed sampling can be applied to snow avalanche deposits for measuring snow grain sizes for diameters larger than 40-50mm (Reference Bartelt and McArdellBartelt and McArdell, 2009). It is not possible to identify smaller particles generated within the flow at the bottom layer and at the front. Other methods need to be developed to overcome this problem. The use of granulometric distributions for understanding sieving mechanisms, as well as evaluating shear forces within avalanche flow, could potentially lead to an alternative approach to the study of snow avalanches. The impossibility of investigating small snow grains does not invalidate the analysis of avalanche dynamics or the effects of the impact of an avalanche on a building, because flow rheology and destructive power depend mainly on the median and large particle sizes.
In the future, a detailed analysis of the multifractality of snow grain distribution, as presented here, will be necessary in order to better understand the role of the different parameters involved in the model.
Acknowledgements
We thank E. Bovet for support in the granulometric survey at the Punta Seehore test site. We are grateful to the reviewers for suggestions and corrections to the manuscript. Support by Valle d’Aosta Regional Agency of Natural Disaster Prevention is gratefully acknowledged.


