


1. INTRODUCTION
The role of mountains in sustaining the social and economic wellbeing of millions of people is well known and unquestioned since snow fields and glaciers provide indispensable water resources for municipal and industrial water supplies, irrigation, hydropower production and other environmental services (e.g., Viviroli and Weingartner, Reference Viviroli and Weingartner2004; Barnett and others, Reference Barnett, Adam and Lettenmaier2005; Viviroli and others, Reference Viviroli, Dürr, Messerli, Meybeck and Weingartner2007, Reference Viviroli2011).
Glaciers are considered as one of the most reliable indicators of climate variations, having either an anthropogenic or natural origin (Oerlemans, Reference Oerlemans1986; Haeberli, Reference Haeberli, Huber, Bugmann and Reasoner1995, Reference Haeberli2005; Johannesson, Reference Johannesson1997). Changes in melt rates impact runoff dynamics and mainly regulate summer stream flows (Jansson and others, Reference Jansson, Hock and Schneider2003; Dahlke and others, Reference Dahlke, Lyon, Stedinger, Rosqvist and Jansson2012). Therefore, in highly glacierized catchments, glacier melt provides an important contribution to the river discharge, particularly during the summer (Verbunt and others, Reference Verbunt2003; Koboltschnig and others, Reference Koboltschnig, Schoner, Zappa, Kroisleitner and Hubert2008; Jost and others, Reference Jost, Moore, Menounos and Wheate2012). The retreat of glaciers could lead to increased hazards, such as outbursts of glacier lakes, destabilization of slopes and floods. Furthermore, glaciers have been the biggest source of the observed sea-level rise since 1900 (Vaughan and others, Reference Vaughan, Stocker, Qin, Plattner, Tignor, Allen, Boschung, Nauels, Xia, Bex and Midgley2013) and they will potentially contribute more strongly to sea-level rise within the 21st century than the ice sheets (Church and others, Reference Church, Stocker, Qin, Plattner, Tignor, Allen, Boschung, Nauels, Xia, Bex and Midgley2013). For this reason, it is important to have a good understanding of the summer glacier surface mass-balance evolution in order to improve the knowledge of the interaction between glaciers, climate and hydrology. In addition, the assessment of meltwater runoff is crucial for both water supply and hydropower applications.
The determination of the glacier mass balances can be obtained using different methods, such as geodetic, glaciological and energy balance methods (Cogley and others, Reference Cogley2011). There are several studies on modelling of glacier surface mass balance, in the context of providing future projections of runoff from specific glaciers (Immerzeel and others, Reference Immerzeel, Beek, Konz, Shrestha and Bierkens2012) and all glaciers worldwide (Marzeion and others, Reference Marzeion, Jarosch and Hofer2012). These models are often calibrated/validated against glaciological and/or altimetric measurements of glacier mass balance. If such models are used to calculate future runoff, they may be erroneous, as they are not accounting for inter-basin transfer (i.e. subterranean fluxes).
The current study shows the importance of considering the groundwater fluxes. The method proposed is to estimate the glacier-wide summer surface mass balance using the hydrological method in two glacierized catchments. Our attention is focused on the Argentière and Mer de Glace-Leschaux glaciers, located in the upper part of the Arve watershed at Chamonix (French Alps). To this end, the glacier-wide summer surface mass balance is obtained using observed runoff data and the quantification of each term of the hydrological balance equation, as well as their uncertainties during the summer season (June, July, August, September, hereafter denoted as JJAS) over the period 1996–2004. Meteorological data are taken from the SAFRAN (Système d'Analyse Fournissant des Renseignements Adaptés à la Nivologie) (see Section 3.2) reanalysis due to the lack of in situ measurements. An adjusted precipitation dataset (adjusted SAFRAN) has been produced on the base of the SAFRAN reanalysis (original SAFRAN) taking into account the observed accumulation measurements at each glacier surface. The performance of the summer surface mass-balance estimations based on hydrological data (sSMBhydro) is evaluated by comparing them with the glacier-wide summer surface mass balances based on in situ glaciological observations (sSMBglacio), over the period 1996–2004.
This paper will first describe the study sites (Section 2) and the available data (Section 3). Then, we will focus on the methodology (Section 4). The estimation of the glacier-wide summer surface mass balances obtained with hydrological and glaciological methods (Section 5) and their comparison (Section 6) will be analysed in detail.
2. STUDY SITE
The Arve River is an alpine river with a glacial regime that flows mainly through France in the region of Haute-Savoie. Rising in the Graian Alps, close to the Swiss border, it receives water from many glaciers of the Mont Blanc massif before flowing into the Rhône River. The Arve catchment covers a surface area of 2083 km2. This study focuses on the upper Arve catchment at Chamonix (Fig. 1a), located between the Mont Blanc and Aiguilles Rouges massifs. Its surface area is highly glacierized (35% of the total area, in 2003) with three main glaciers located in the eastern part: Glacier du Tour, Glacier d'Argentière and Glacier de la Mer de Glace-Leschaux, covering areas of 8.2, 11.4 and 31.6 km2 in 2003, respectively (Gardent and others, Reference Gardent, Rabatel, Dedieu and Deline2014; Rabatel and others, Reference Rabatel, Dedieu and Vincent2016). Here, we focus on the glaciers that belong to the GLACIOCLIM (Les GLACIers, un Observatoire du CLIMat) observatory (https://glacioclim.osug.fr, Six and Vincent (Reference Six and Vincent2014)): Glacier d'Argentière, monitored since 1976, and Glacier de la Mer de Glace-Leschaux, monitored since 1979 (Fig. 1b, Table 1). All the tributaries of these glaciers are considered in the present study. The main tributaries are Glacier des Améthystes (1.3 km2) and Glacier du Tour Noir (1.2 km2) for Argentière and Glacier de Talèfre (7.7 km2) for Mer de Glace-Leschaux (Fig. 1b). In 2003, the overall surface area of the Argentière glacier with its tributaries was 15.7 km2, while that of Mer de Glace-Leschaux and its tributaries was 42.3 km2. The hypsometric curves of the glaciers and their tributaries are shown in Fig. 2.

Fig. 1. (a) Location and altimetry of the upper Arve watershed, Arveyron d'Argentière and Arveyron de la Mer de Glace catchments and their respective glaciers (in 2003). The black points and orange triangles respectively indicate the location of the hydrological gauging stations of the two catchments considered and the network of the snow depth gauging stations. The star locates the water intake of the centrale des Bois hydroelectric plant. (b) Mer de Glace-Leschaux (left) and Argentière glaciers (right) with all their tributaries in 2003 (Gardent and others, Reference Gardent, Rabatel, Dedieu and Deline2014; Rabatel and others, Reference Rabatel, Dedieu and Vincent2016). The triangles represent the network of the in situ surface mass-balance measurements in both the accumulation (blue) and ablation (red) areas. The different coloured areas indicate the glacier divisions for the computation of the glacier-wide winter glaciological surface mass balance (see Section 4.2). (c) Land cover map of the study area (CLC 06 (Corine Land Cover 2006) (EEA (European Environment Agency), 2007)). (d) Geological map provided by BRGM (Bureau de Recherches Géologiques et Minières). The solid and dotted purple lines respectively represent the main shear zones and their interpolation (Rossi and Rolland, Reference Rossi and Rolland2014). The pink line indicates the location of the Mont Blanc road tunnel. In figures (c) and (d), the glacier extents are indicative only.
Fig. 2. Hypsometric curves for the (a) Arveyron d'Argentière and Arveyron de la Mer de Glace catchments and (b) Argentière and Mer de Glace-Leschaux glaciers (with all of their tributaries) in 2003.
Table 1. Main characteristics of the two glaciers considered and their main tributaries. The surface areas, elevations and equilibrium-line altitude (ELA) were obtained using satellite images (Rabatel and others, Reference Rabatel, Letréguilly, Dedieu and Eckert2013). The number of measurement sites in the ablation and accumulation areas are also listed (Six and Vincent, Reference Six and Vincent2014)
In the upper Arve catchment, two main glacierized catchments can be identified: Arveyron d'Argentière (32.2 km2) and Arveyron de la Mer de Glace (79.4 km2) (Table 2). The lowest point reached by the Arveyron de la Mer de Glace catchment is at 1060 m a.s.l. and the highest is at 4295 m a.s.l. (Fig. 2a). The elevation range of the Arveyron d'Argentière catchment is between 1363 and 4079 m a.s.l. (Fig. 2a). The largest part of the Arveyron d'Argentière catchment faces southwest (19.2%), while that of the Arveyron de la Mer de Glace faces northwest (17.9%). Nine percent of the area of both catchments faces southward. The extent of the forested and vegetated areas of the Arveyron de la Mer de Glace catchment is slightly higher (1.4%) than that of the Arveyron d'Argentière (Fig. 1c, Table 2). Upstream of the Arveyron d'Argentière gauging station (at 2060 m a.s.l.), water from the Argentière main glacier is collected by a subterranean tunnel carved into the rock, managed by Electricité d'Emosson S.A. and directed toward Emosson lake (Switzerland) for electricity production (Fig. 1a). Within the Arveyron de la Mer de Glace catchment, there is a subterranean hydroelectric power plant (centrale des Bois, 1075 m a.s.l.) managed by EDF (Electricité De France) using part of the water of the sub-glacial river of the Mer de Glace-Leschaux glacier (Fig. 1a). The outflow of this hydroelectric plant is located upstream of the Arveyron de la Mer de Glace hydrological gauging station.
Table 2. Main characteristics and land covers (CLC 06, (EEA, 2007)) of the two glacierized catchments considered
The major rock types present in the Mont Blanc and Aiguilles Rouges massifs, and thus also in the two glacierized catchments considered here, are granite and gneiss (Fig. 1d). These crystalline rocks underwent several episodes of ductile and brittle tectonic deformation (Corbin and Oulianoff, Reference Corbin and Oulianoff1930; Jamier, Reference Jamier1975). The results are fissure and fracture systems in a N-S and NE-SW direction that primarily stretch across the southern part of the upper Arve watershed (Fig. 1d) (Dubois, Reference Dubois1992; Rossi and Rolland, Reference Rossi and Rolland2014). It is also noticeable that there is a significant amount of alluvial soils and scree in the lowest part of the Arveyron de la Mer de Glace catchment.
3. DATA
3.1. DEM, glacier surfaces, land cover and geology
The RGE ALTI DEM provided by the French National Geographic Institute (IGN, Institut Géographique National, France) with a horizontal resolution of 5 m is used to extract topographic information (elevation, slope and aspect) for the study area in 2012 and to calculate the potential solar radiation based on a hemispherical viewshed algorithm (Rich and others, Reference Rich, Dubayah, Hetrick and Saving1994; Fu and Rich, Reference Fu and Rich1999, Reference Fu and Rich2002). In addition, glacier shapes obtained using Landsat and ASTER images in 2003 and 2012 (Gardent and others, Reference Gardent, Rabatel, Dedieu and Deline2014; Rabatel and others, Reference Rabatel, Dedieu and Vincent2016) are used to calculate changes in the glacier surface area, assuming an annual linear change between the two dates. The land cover is investigated using the 2006 Corine Land Cover map, generated with an automatic classification for the whole of Europe (EEA, 2007). Finally, the 1 : 50000 geological map provided by BRGM is used to investigate the lithology of the study area.
3.2. Meteorological data
Because of the lack of long-term meteorological records at high altitudes close to glaciers, atmospheric temperature and precipitation data are taken from the SAFRAN reanalysis, available at an hourly timescale over the 1958–2013 period at 300 m altitude steps from 1200 m to 3600 m a.s.l., at the scale of the Mont Blanc massif. SAFRAN (Durand and others, Reference Durand, Giraud, Brun, Mérindol and Martin1999, Reference Durand2009) is a meteorological analysis system performing a spatialisation of the observed weather data available over the considered elevations and aspects of 23 different massifs within the French Alps. SAFRAN provides near-surface atmospheric variables (temperature, precipitation rate and phase, incoming shortwave and longwave radiations, wind speed and relative humidity) combining in situ and remotely sensed observations with a prior estimation (called ‘guess’) provided by the results of the ARPEGE (Action Recherche Petite Echelle Grande Echelle) French meteorological model (Courtier and others, Reference Courtier, Freyder, Geleyn, Rabier and Rochas1991) or from the ECMWF (European Centre for Medium-range Weather Forecasts) analyses through appropriate downscaling operators (Hagemann and others, Reference Hagemann, Arpe and Bengtsson2009). The altitude parameters (air temperature, wind, humidity and cloudiness) are analysed by the Optimal Analysis (OI) method (Durand, Reference Durand1985), a linear regression that uses a flexible statistical scheme, which allows an estimate of every analysed parameter with different possible adjacent data. In a first stage, air temperature, wind and humidity variables are interpolated horizontally using Bichkard polynomials and vertically on analysis locations. Afterwards, the preliminary estimated variables are modified using observed values to fit daily meteorological conditions better (for further details see Durand and others, Reference Durand1993).
In this study, only the Mont Blanc massif is considered since it covers the whole study area.
3.3. Glaciological data
Available point measurements of the summer (psSMB) and winter (pwSMB) surface mass balances over the accumulation and ablation areas of the Argentière and Mer de Glace-Leschaux glaciers and their main tributaries (Tour Noir, Améthystes and Talèfre glaciers) since 1995 are used (Six and Vincent, Reference Six and Vincent2014) (Fig. 1b). The psSMB measurements, made at the end of September/beginning of October, are obtained from the difference between the point measurements of the annual and winter surface mass balances. The point winter surface mass balances are measured at the end of April/middle of May by drilling cores, based on snow layering (stratigraphy) and density, giving the amount of snow accumulated and its water equivalent. The point annual surface mass balances are determined from wood stakes inserted in the ice. The glacier-wide annual surface mass balances (aSMBglacio) of the two considered glaciers quantified by GLACIOCLIM (Vincent and others, Reference Vincent, Soruco, Six and Meur2009, Reference Vincent, Harter, Gilbert, Berthier and Six2014) are also used. Available over the period 1979–2012, they are calculated using the linear model (Lliboutry, Reference Lliboutry1974; Vincent and others, Reference Vincent2017) adjusted by the geodetic method.
3.4. Snow cover
The MOD10A1 products (snow cover and fractional snow cover) with 500 m grid resolution, available from MODIS (MODerate resolution Imaging Spectroradiometer) satellite sensors since 2000, are used to investigate the extent of the snow cover (Hall and others, Reference Hall, George and Vincent2006). These data are based on a snow mapping algorithm that uses the Normalized Difference Snow Index (NDSI). The NDSI is a spectral band ratio that takes advantage of the spectral differences of snow in short-wave infrared and visible MODIS spectral bands to distinguish snow from clouds and other nonsnow-covered conditions (Salomonson and Appel, Reference Salomonson and Appel2004). Furthermore, point snow depth measurements provided by four stations (Fig. 1a) located within the study area at different elevations (Chamonix at 1025 m a.s.l., Le Tour at 1470 m a.s.l., Lognan at 1970 m a.s.l. and Aiguilles Rouges Nivose at 2365 m a.s.l.), belonging to the Météo-France observation network, are used to estimate the amount of winter snow contributing to the summer discharge over the 1996–2004 period.
3.5. Hydrological data
The analyses presented in this study are carried out using the total discharge dataset for both Arveyron d'Argentière (available over the period 1955–2004) and Arveyron de la Mer de Glace (available over the period 1950–2014) catchments, available at daily time step and provided by EDF. Because of the water withdrawals below the Argentière glacier, the total discharge of the Arveyron d'Argentière was obtained by adding the data measured at the extraction point to the stream discharge values registered by the gauging station located at the outlet of the catchment. The discharge values of the Arveyron de la Mer de Glace catchment are provided by the gauging station at its outlet. In the Argentière drainage basin, the available data are mainly concentrated from the end of May–October as the sensors are removed during winter.
Finally, it should be noted that the common period covered by all of the datasets (except for the MODIS images) ranges from 1996 to 2004 over the summer season.
4. METHODS
4.1. Hydrological method
The simulated glacier-wide summer surface mass balances are obtained by calculating the hydrological balance equation (Eqn (1)) of each glacier drainage basin over the summer season (JJAS).
 $$\eqalign{& - \; sSMBhydro\; \; = \; - \; Q_{in - situ\; JJAS} \cr & \quad + P_{tot\; JJAS} - \; ETA_{ JJAS} - S_{JJAS} + \; \Delta S_{JJAS}} $$
 $$\; \; \Delta S_{JJAS} = \; \Delta M_{snow\; JJAS} - \Delta G_{JJAS}$$
 $$\; \; \Delta G_{JJAS} = \; 0$$
where sSMBhydro is the simulated glacier-wide summer surface mass balance, Q in−situ JJAS , P tot JJAS , ETA JJAS and S JJAS are the runoff, the total amount of precipitation over the entire catchment considered, the actual evapotranspiration of the overall catchment and the sublimation of the overall ice and snow surfaces of the catchment considered, respectively, over the JJAS period. ΔS JJAS (Eqn (2)) represents the storage variation of the catchment during the summer, including the contribution given by the melting of snow (ΔM snow JJAS) accumulated during the wintertime (October–May) outside of the glacierized areas and the groundwater (ΔG JJAS ). The latter is assumed to be equal to zero (Eqn (3)). The glacier storage variation is included in the glacier-wide summer surface mass-balance term. All quantities are in m3 s−1. A semi-distributed approach is used: each catchment has been divided into 10 elevation bands. We have added another band to the nine bands based on the SAFRAN division, in order to take the area of the catchments located above 3750 m a.s.l. into account (see the details of the elevation range of the bands in Table 3).
Table 3. Values of the central altitude of the bands and the Y multiplication factors used in Eqn (6)
The elevation ranges of each band are the following: Band 1 [1050–1350 m a.s.l.], Band 2 [1350–1650 m a.s.l.], Band 3 [1650–1950 m a.s.l.], Band 4 [1950–2250 m a.s.l.], Band 5 [2250–2550 m a.s.l.], Band 6 [2550–2850 m a.s.l.], Band 7 [2850–3150 m a.s.l.], Band 8 [3150–3450 m a.s.l.], Band 9 [3450–3750 m a.s.l.] and Band 10 [3750–4300 m a.s.l.].
The summer (JJAS) potential evapotranspiration (ETP) of glacierized catchments is obtained as the product of the reference evapotranspiration (ET 0) and the crop coefficient value (K c), according to the FAO method (FAO, 1998). ET 0 is calculated using the formula proposed by Oudin and others (Reference Oudin2005), based on the mean daily air temperature and calculated extra-terrestrial radiation (Morton, Reference Morton1983). Four reference K c values (FAO, 1998), one for each summer month, are adopted for the different types of soil (Table 4). The summer ETP (m3 a−1) is then calculated as follows:
 $$\eqalign{& ETP_{JJAS\; } = \cr & \quad \left( {\mathop \sum \limits_{b = 1}^{10} {\left( {\mathop \sum \limits_{m = 6}^9 {\left( {\mathop \sum \limits_{n = 1}^N (K_C(n,m)A(n,b)\; ET_0(m,b)} \right)}_n} \right)}_m} \right)_b} $$
where the indexes b, m and n represent the bands of altitude, summer months and different types of land cover, respectively. A is the area, K c is the crop coefficient and ET 0 is the reference evapotranspiration value calculated using the SAFRAN daily temperature. Thus, the summer ETP volume for the catchments considered in this work is obtained as the sum of the summer potential evapotranspiration associated with the 10 bands of altitude (Eqn (4)). Evapotranspiration above the summer 0 °C isotherm (3750 m a.s.l.) is considered to be negligible. The glacier evaporation is considered negligible as it is usually small compared with the other terms of the hydrological balance equation (Paterson, Reference Paterson1994). Due to the frequent precipitation events during the summer season over the upper Arve catchment (60% of the summer days over the 1996–2004 period), the actual evapotranspiration (ETA) is expected to be equal to the potential evapotranspiration on most days (Konzelmann and others, Reference Konzelmann, Calanca, Müller, Menzel and Lang1997) (Eqn (5)).
 $$ETA_{JJAS}\; = ETP_{JJAS}\; $$
Table 4. Reference K c values for each type of land cover, for each summer month (JJAS), used in Eqn (4)
Three temperature time series (mean, maximum and minimum) from the SAFRAN reanalysis were used to calculate the ETA in order to know its range of interannual variability.
Six and others (Reference Six, Wagnon, Sicart and Vincent2009) have shown that, during the summer season, sublimation is <0.12 mm w.e. d−1 on the Saint-Sorlin glacier, located in the French Alps. Based on this result and in light of the relatively small distance (~100 km as the crow flies) to the Arve watershed, we assumed that sublimation is negligible compared with the other fluxes in our study area. Therefore, the SJJAS in Eqn (1) is set to zero.
The contribution of solid precipitation accumulated during the wintertime (ΔM snow ) to the summer discharge is calculated by considering the melting of the available snowpack that exists on 1 June outside of the glacierized areas. The presence of the snowpack and its thickness are quantified from the SAFRAN winter (October–May) snowfall data, MODIS images and in situ snow depth measurements. The following formula is used:
 $$\Delta M_{snow\; JJAS} = \mathop \sum \limits_{b = 1}^{10} (Y_\; (b)\; Psnow_{\; ONDJFMAM}(b))\; $$
where the index b represents the elevation bands (Table 3),Psnow ONDJFMAM is the amount of winter (October–May) solid precipitation from the SAFRAN reanalysis (in mm w.e.) and Y is a multiplication factor indicating the percentage of the snow present on 1 June that can melt (in %). We assumed that there is negligible melt above the mean summer 0 °C isotherm (at 3750 m a.s.l.). MODIS images are used to identify the range of altitude characterized by the presence of snow on 1 June outside of the glacierized areas. The available point measurements of snow depth (Fig. 3) are used to validate the observation from the MODIS images and to quantify the snow depth at 1 June (in case of the presence of snow) in the part of the catchments up to 2550 m a.s.l. over the period 1996–2004. Once the altitude bands with snow on 1 June are identified, the Y is obtained by assuming a linear change with altitude and the complete melting of the existing percentage of snow. We estimate that the areas below 2350 m a.s.l. and above 3750 m a.s.l. do not represent a source of summer discharge (Y 1,2,3,4,10 = 0) due to the absence of snow below 2350 m a.s.l. at the beginning of June and the absence of snow melt above 3750 m a.s.l. over the 1996–2004 period due to low temperatures (Table 3). The contributing areas to the summer snow melt range from 2350 to 3750 m a.s.l., i.e. from the 5th to the 9th band of altitude (Table 3). On the basis of the in situ measurements the Y value at the 5th band is estimated equal to 0.22 while it is set to 1 at the 9th band. Doing a linear interpolation between these two extreme values of Y, we obtained Y values equal to 0.415, 0.610 and 0.805 respectively for the 6th, 7th and 8th bands of altitude (Table 3).
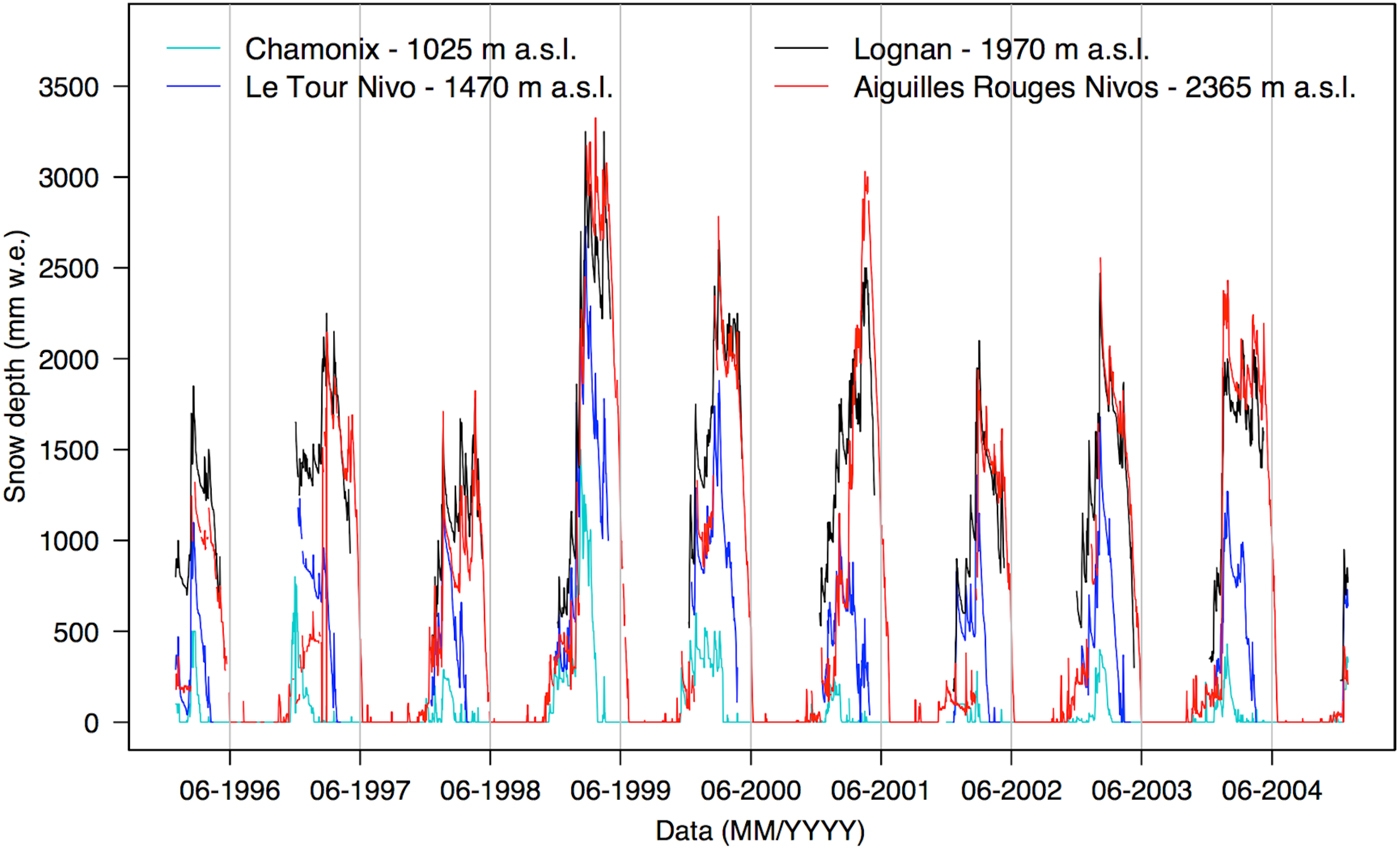
Fig. 3. Evolution of the point-scale snow depth measurements over the period 1996-2004, registered by four Météo-France meteorological stations at different altitudes. Grey vertical lines indicate 1 June of each year.
4.2. Glaciological method
In order to know the performance of the simulated glacier-wide summer surface mass balances using the hydrological method (sSMBhydro) (Eqn (1)), we compared these balances with the ‘observed’ glacier-wide summer glaciological surface mass balances (sSMBglacio) quantified for the Argentière and Mer de Glace-Leschaux glaciers (and their tributaries) as follows:
 $$sSMBglacio = \; aSMBglacio - \; wSMBglacio$$
where aSMBglacio is the glacier-wide annual glaciological surface mass balance and wSMBglacio is the glacier-wide winter glaciological surface mass balance. wSMBglacio is obtained as follows. First, the glaciers are divided into different zones: seven for Argentière and nine for Mer de Glace-Leschaux, respectively ranging from 1.4 to 3.7 km2 and 0.8 to 14.9 km2 based on altitude, potential solar radiation and exposure (Fig. 1b). Then, for the years when some pwSMB measurements are missing (20% of the cases for Argentière and 27% for Mer de Glace-Leschaux), each missing stake measurement is estimated using a linear function with the next best fitting neighbouring stake. The fitting stake is chosen among the different neighbouring stakes on the base of the value of the determination coefficient (R 2, that ranges from 0.70 to 0.97). Second, for each glacier and for each year, the complete pwSMB dataset is interpolated with quadratic curves as a function of altitude (Réveillet and others, Reference Réveillet, Vincent, Six and Rabatel2017). wSMBglacio (in m w.e. a−1) is calculated as the sum of the products between the pwSMB values at the mean altitude of the zone considered and its area, normalized by the area of the whole glacier considered in the year considered, to take the evolution of the glacier surface into account.
4.3. SAFRAN precipitation adjustment
Given that the SAFRAN reanalysis only partially represents the spatial variability of the meteorological conditions within a massif (Durand and others, Reference Durand2009; Vionnet and others, Reference Vionnet2016; Birman and others, Reference Birman2017), we propose a correction of the SAFRAN precipitation values based on the comparison with the pwSMB measurements (Gerbaux and others, Reference Gerbaux, Genthon, Etchevers, Vincent and Dedieu2005; Dumont and others, Reference Dumont, Durand, Arnaud and Six2012; Réveillet and others, Reference Réveillet, Vincent, Six and Rabatel2017). Glacier winter surface mass-balance observations have often been used to either replace precipitation measurements or to validate precipitation estimates at high altitudes (Bucher and others, Reference Bucher, Kerschner, Lumasegger, Mergili and Rastner2004; Carturan and others, Reference Carturan, Fontana and Borga2012). To capture the spatial variability in the amount of precipitation for the Arveyron d'Argentière and the Arveyron de la Mer de Glace catchments, the correction is done separately for the upper reaches of the two glacierized catchments over the 1996–2004 period. Below the mean altitude reached by the winter 0 °C isotherm (at 2550 m a.s.l.), the SAFRAN values are not modified because melting processes can occur and therefore the winter surface mass-balance measurements can underestimate the winter solid precipitation. Conversely, SAFRAN values for higher elevation bands (from 2550 to 4300 m a.s.l.) are increased by an amount that is given by the difference between the trend lines for the SAFRAN winter precipitation and the pwSMB measurements, located in the accumulation zone of the glaciers or at least above 2550 m, obtained using quadratic functions that best fit the data (Fig. 4). The same precipitation adjustment is applied over the winter and the summer seasons.

Fig. 4. Evolution with altitude of the point winter surface mass balance (pwSMB) of the (a) Argentière and (b) Mer de Glace-Leschaux glaciers and the winter precipitation of the SAFRAN reanalysis, averaged over the period 1996–2004. The dotted lines represent the trend lines of the original SAFRAN winter precipitation and the pwSMB obtained using quadratic functions. The black crosses show the adjusted SAFRAN winter precipitation values. The grey area represents the altitude range reached by the 0 °C isotherm during winter (over the period 1996–2004).
In this study, we therefore, consider two SAFRAN precipitation datasets: the original one (hereafter called ‘original SAFRAN’) and the adjusted one (hereafter called ‘adjusted SAFRAN’).
4.4. Uncertainty in the simulated and ‘observed’ glacier-wide summer surface mass balances
The standard uncertainty of the sSMBhydro (σ sSMBhydro ), at the 68% level of confidence, is obtained as follows, assuming the errors are random and independent:
 $$\sigma _{sSMBhydro} = \sqrt {\sigma _{Q_{in - situ}}^2 + \sigma _{P_{tot}}^2 + \sigma _{ETA}^2 + \sigma _{\Delta M_{snow}}^2} $$
where $\sigma _{Q_{in - situ}}$
,
$\sigma _{Q_{in - situ}}$
, $\sigma _{P_{tot}}$
, σ
ETA
and
$\sigma _{P_{tot}}$
, σ
ETA
and $\sigma _{\Delta M_{snow}}$
are, respectively, the standard uncertainties on the in situ runoff data, the total amount of summer precipitation, the actual evapotranspiration and the melting of the winter snow terms, all over the JJAS period, at the 68% level of confidence.
$\sigma _{\Delta M_{snow}}$
are, respectively, the standard uncertainties on the in situ runoff data, the total amount of summer precipitation, the actual evapotranspiration and the melting of the winter snow terms, all over the JJAS period, at the 68% level of confidence. $\sigma _{Q_{in - situ}}$
is quantified using the formulation described in the Manual on Stream Gauging (WMO, 2010), in ISO 1088 (2007a) and ISO 748 (2007b) and adapted to the gauging stations of our study. A 10% standard uncertainty was assumed reliable and conservative.
$\sigma _{Q_{in - situ}}$
is quantified using the formulation described in the Manual on Stream Gauging (WMO, 2010), in ISO 1088 (2007a) and ISO 748 (2007b) and adapted to the gauging stations of our study. A 10% standard uncertainty was assumed reliable and conservative. $\sigma _{P_{tot}}$
Z and
$\sigma _{P_{tot}}$
Z and $\sigma _{\Delta M_{snow}}$
Z are obtained by multiplying the daily standard uncertainty of the original SAFRAN massif precipitation (σ
p) for the summer and winter days, respectively. σ
p (in mm d−1) is calculated as follows, considering the winter season:
$\sigma _{\Delta M_{snow}}$
Z are obtained by multiplying the daily standard uncertainty of the original SAFRAN massif precipitation (σ
p) for the summer and winter days, respectively. σ
p (in mm d−1) is calculated as follows, considering the winter season:
 $$\sigma _{\rm P} = \displaystyle{{\sqrt {\sigma {_{wP}^2} _{SAFRAN} + \sigma _{\,pwSMB}^2}} \over {winter\; days}}$$
where σ wP SAFRAN and σ pwSMB are the standard uncertainties of the original winter SAFRAN precipitation and the pwSMB data, respectively. σ wP SAFRAN is taken as equal to the difference between the trend lines of the SAFRAN winter precipitation and the pwSMB measurements at the median altitude of the considered catchments (Table 2). σ pwSMB is considered as equal to the mean deviation of pwSMB for the considered glacier from its quadratic trend line above the winter 0 °C isotherm, over the period 1996–2004. These uncertainties are also applied to the adjusted SAFRAN precipitation values.
σ ETA is quantified as half the range of the maximum to minimum ETA difference over the period 1996–2004.
The standard uncertainty of the sSMBglacio (σ sSMBglacio ), at the 68% level of confidence, is calculated as follows:
 $$\sigma _{sSMBglacio} = \sqrt {\; \sigma _{aSMBglacio}^2 + \; \sigma _{wSMBglacio}^2} $$
where σ aSMBglacio and σ wSMBglacio are the standard uncertainties of the aSMBglacio and the wSMBglacio, respectively. σ wSMBglacio is taken as equal to the mean of the deviation of the pwSMB data for the considered glacier from the quadratic line fitted to pwSMB with their elevation, over the period 1996–2004. For the σ aSMBglacio value of both glaciers, we used the error quantified by Berthier and others (Reference Berthier2014) for the glaciological mass balance of the Argentière glacier, that is equal to ± 0.40 m w.e. a−1.
It is important to note that the approach for the uncertainty estimation used in this paper is characterized by a significant degree of subjectivity, so one has to have in mind that the uncertainties could be slightly larger or slightly smaller.
5. RESULTS
5.1. Glacier-wide summer surface mass balance from in situ glaciological measurements
Looking at the evolution of the sSMBglacio (Fig. 5a, c), it can be seen that the two glaciers considered here (with their tributaries) are characterized by almost the same interannual variability over the period 1996–2004. The mass loss of the Mer de Glace-Leschaux glacier (including all its tributaries) is slightly greater than that of the Argentière glacier (also including all its tributaries) over the entire period considered (−2.68 m w.e. a−1 vs −2.62 m w.e. a−1), but the average difference between the two series can be considered within their measurement uncertainties (±0.49 m w.e. a−1 for Argentière and ± 0.58 m w.e. a−1 for Mer de Glace-Leschaux) (Table 5). The amount of water provided by the two glaciers can be considered as similar and therefore these glaciers appear to be characterized by the same glaciological behaviour.
Fig. 5. Comparison between the ‘observed’ glacier-wide summer surface mass balances (sSMBglacio) and the quantified balances (sSMBhydro) using the original and adjusted SAFRAN data for (a) the Argentière (including its tributaries) and (c) Mer de Glace-Leschaux (including its tributaries) glaciers over the period 1996-2004. Vertical bars represent the standard uncertainties. Correlations between the sSMBglacio dataset and the two estimates of sSMBhydro for (b) the Argentière and (d) Mer de Glace-Leschaux glaciers over the 1996–2004 are also presented. The dashed lines presented in (b) and (d) represent the bisector.
Table 5. Average values of the ‘observed’ (sSMBglacio) and simulated (sSMBhydro) glacier-wide summer surface mass balances of the Argenitère (including its tributaries) and Mer de Glace-Leschaux (including its tributaries) glaciers over the period 1996–2004
In addition, the wSMBglacio data for both glaciers, used to calculate sSMBglacio (Eqn (7)), reproduce similar interannual variations over the study period. The winter budget is equal to + 1.77 m w.e. a−1 for Argentière and + 1.71 m w.e. a−1 for Mer de Glace-Leschaux. The difference between these two series is smaller than their uncertainty (±0.29 m w.e. a−1 for Argentière and ± 0.42 m w.e. a−1 for Mer de Glace-Leschaux).
5.2. Glacier-wide summer surface mass balance from hydrological data
Hereafter we present a quantification of each term of the hydrological balance equation (Eqn (1)) using both the original and adjusted SAFRAN reanalysis during the summer season (JJAS) over the period 1996–2004 for the Arveyron d'Argentière and Arveyron de la Mer de Glace catchments.
Over the period 1996–2004, the highest amounts of summer total precipitation occur in the 7th (between 2850 and 3150 m a.s.l.) and 8th band (between 3150 and 3450 m a.s.l.) of altitude for the Arveyron d'Argentière and Arveyron de la Mer de Glace catchments, respectively. Over this period, the discharge produced by the total summer precipitation for the two considered catchments is similar in relation to their size. Over the study period, the average contribution to the outflow given by the total precipitation (original SAFRAN) equals 2.55 m3 s−1 (i.e. 0.84 m w.e. a−1) and 6.20 m3 s−1 (i.e. 0.82 m w.e. a−1) for the Arveyron d'Argentière and Arveyron de la Mer de Glace catchments, respectively. On average, the multiplication factors used for the SAFRAN precipitation adjustment are 1.3 for Arveyron d'Argentière and 1.4 for Arveyron de la Mer de Glace. For comparison, these values are slightly lower than those quantified by Gerbaux and others (Reference Gerbaux, Genthon, Etchevers, Vincent and Dedieu2005) (1.5) for the Argentière and Saint-Sorlin glaciers, Gottardi (Reference Gottardi2009) (1.6) for solid precipitation on the French Alps and Dumont and others (Reference Dumont, Durand, Arnaud and Six2012) (1.64) for the Saint-Sorlin glacier. It should be noted that the values for this factor depend on the calibration period and the site considered. On average, over the study period, the discharges produced by total summer precipitation obtained from the adjusted SAFRAN are 20% (i.e. 0.51 m3 s−1) and 24% (i.e. 1.50 m3 s−1) higher than those obtained using the original SAFRAN reanalysis for the Arveyron d'Argentière and Arveyron de la Mer de Glace catchments, respectively. The difference of these rates is due to the different spatial distribution of precipitation over the two considered catchments.
The highest values of summer ETA (Eqn (5)) are produced in the 4th band of altitude (between 1950 and 2250 m a.s.l.) for both the Arveyron d'Argentière (0.03 m3 s−1) and Arveyron de la Mer de Glace (0.09 m3 s−1) catchments. It is interesting to note that, on average, the ETA rate (m w.e. a−1) is 27.2% (i.e. 0.031 m w.e. a−1) higher for Arveyron de la Mer de Glace, over the period 1996–2004. This could be because this catchment is characterized by a greater expanse of forested area related to Arveyron d'Argentière (3.7% vs 2.3%, respectively) and by a wider expanse of lower areas with higher temperature. The difference between the ETA for the two catchments remains constant over the whole period.
Over the study period, on average, the contribution to the discharge given by the winter snow melt (Eqn (6)) outside of the glacierized area during the summer months is estimated (original SAFRAN) to be equal to 0.6 m3 s−1 (i.e. 0.42 m w.e. a−1) and 1.1 m3 s−1 (i.e. 0.31 m w.e. a−1) for the Arveyron d'Argentière and Arveyron de la Mer de Glace catchments, respectively. These values increase by 30% (i.e. 0.18 m3 s−1) for Arveyron d'Argentière and 34% (i.e. 0.36 m3 s−1) for Arveyron de la Mer de Glace when the adjusted SAFRAN precipitation amounts are used instead of the original data.
After quantifying all the contributions, the glacier-wide summer surface mass balance based on hydrological data (Eqn (1)) can be estimated for each glacier using the original and adjusted SAFRAN reanalysis (Fig. 6). Ice and snow melt from glacierized areas are clearly one of the main contributors to summer runoff. On average, the contributions of the sSMBhydro to the discharge, using the original (adjusted) SAFRAN values, are estimated to be 58% (49%) for Arveyron d'Argentière and 54% (42%) for Arveyron de la Mer de Glace. The amount of water loss through evapotranspiration represents ~6% (5%) of the summer total precipitation calculated using the original (adjusted) SAFRAN values for both the Arveyron d'Argentière and Arveyron de la Mer de Glace catchments. The contribution given by the summer total precipitation calculated with the original (adjusted) SAFRAN values represents 35% (42%) of the discharge for the Arveyron d'Argentière catchment and 41% (51%) for the Arveyron de la Mer de Glace catchment. The snow melt runoff (outside the glacier) represents 9% (11%) and 7% (9%) of the total summer discharge, respectively, for the Arveyron d'Argentière and Arveyron de la Mer de Glace catchments. The observed inter-annual variations in summer discharge from the two catchments are almost similar over the period 1996–2004 (not shown here).
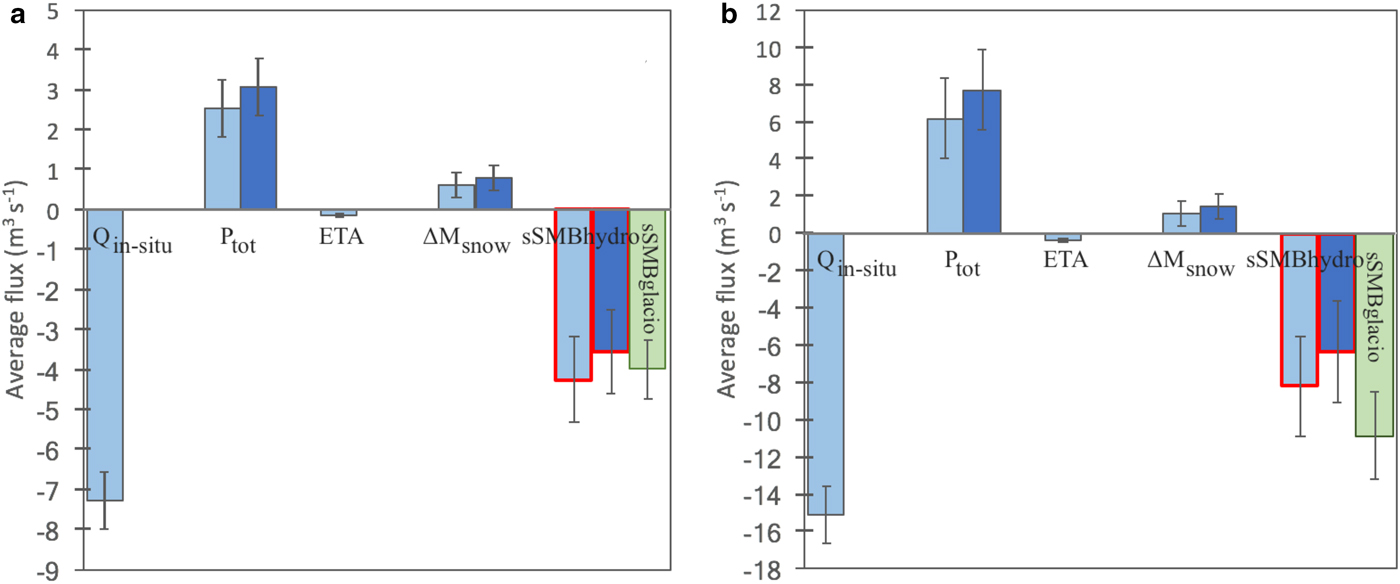
Fig. 6. Hydrological balance for the (a) Arveyron d'Argentière and (b) Arveyron de la Mer de Glace catchments. Light and dark blue bars represent the average summer flux of the variables involved in the hydrological balance equation (in situ stream outflow (Q in−situ ), total precipitation (P tot ), actual evapotranspiration (ETA) and snow melt runoff (ΔM snow )) calculated using the original and adjusted SAFRAN reanalysis, respectively, over the period 1996–2004. Red contours highlight the two sSMBhydro estimates for the glaciers considered. Green bars represent the sSMBglacio values. Vertical black lines represent the standard uncertainties.
The standard uncertainties of the terms involved in the hydrological balance equation are listed in Table 6. The average standard uncertainties for sSMBhydro are equal to ± 1.06 m3 s−1 (i.e. ± 0.67 m w.e. a−1) for Argentière and ± 2.71 m3 s−1 (i.e. ± 0.66 m w.e. a−1) for Mer de Glace-Leschaux. The greatest errors affecting sSMBhydro, in terms of m3 s−1, are introduced by precipitation and discharge measurements, i.e. 0.71 m3 s−1 and 0.73 m3 s−1 for Argentière and 2.14 m3 s−1 and 1.51 m3 s−1 for Mer de Glace-Leschaux (Fig. 6 and Table 6). The daily standard uncertainty estimated for precipitation is almost the same as that quantified by Quintana-Seguì and others (Reference Quintana-Seguì2008) for the SAFRAN precipitation over France (2.3 mm d−1 for the Arveyron d'Argentière and 2.4 mm d−1 for the Arveyron de la Mer de Glace vs 2.4 mm d−1).
Table 6. Standard uncertainties (σ) (m3 s−1 and m w.e. a−1) for the variables involved in the hydrological balance equation (Q in−situ , Ptot, ETA, ΔM snow ), the simulated glacier-wide summer surface mass balance (sSMBhydro) obtained in the case of the original and the adjusted SAFRAN reanalysis, the glacier-wide winter surface mass balance (wSMBglacio), the glacier-wide annual surface mass balance (aSMBglacio) and the ‘observed’ glacier-wide summer surface mass balance (sSMBglacio)
6. DISCUSSION
For the Argentière glacier, a small difference can be noted when comparing the average sSMBhydro and sSMBglacio values over the 1996–2004 period (Fig. 6a). The simulated values using the original SAFRAN reanalysis are more negative than the sSMBglacio values by 12% (−2.79 m w.e. a−1 vs −2.62 m w.e. a−1) while those obtained from the adjusted SAFRAN are less negative by 6% (−2.33 m w.e. a−1 vs −2.62 m w.e. a−1) (Table 5). The evolution of the sSMBhydro values over the considered period is in good agreement with the sSMBglacio values, showing almost the same inter-annual variability (Fig. 5a). The correlations between the sSMBglacio dataset and the two estimates of sSMBhydro are significant at 99% confidence interval according to the Pearson's test (R 2>0.81) (Fig. 5b). We can conclude that the difference between the sSMBglacio calculation and the two sSMBhydro estimates for the Argentière glacier is comprised in their measurement uncertainties, equal to ± 0.49 m w.e. a−1 on the former and ± 0.67 m w.e. a−1 on the latter (Table 5). As a consequence, the two estimates of the summer surface mass balance using the hydrological and glaciological data are in good agreement.
In the case of the Mer de Glace-Leschaux glacier, the sSMBhydro values quantified from the original and adjusted SAFRAN data are less negative than the sSMBglacio values by 24% (−2.00 m w.e. a−1 vs −2.68 m w.e. a−1) and 41% (−1.55 m w.e. a−1 vs −2.68 m w.e. a−1), respectively (Table 5). As for the Argentière glacier, the correlations between the sSMBglacio dataset and the two estimates of sSMBhydro for Mer de Glace-Leschaux are significant at 99% confidence (Pearson's test) (R 2>0.72) (Fig. 5d). In this case, although the uncertainty ranges overlap (±0.66 m w.e. a−1 on the sSMBhydro data and ± 0.58 m w.e. a−1 on the sSMBglacio data) (Fig. 5c), the marked difference between the sSMBhydro and sSMBglacio values probably also results from another source. It could be attributed to the presence of aquifers and subterranean fluxes in the Arveyron de la Mer de Glace catchment that prevents the transfer of the totality of the liquid water to the outlet of the catchment. Thus, we can hypothesize that the groundwater term (see Eqn (3)) cannot be neglected in the Arveyron de la Mer de Glace catchment. We might expect that the measured discharge from the Arveyron de la Mer de Glace catchment underestimates the real water production of the catchment, leading to an underestimation of the sSMBhydro value for the Mer de Glace-Leschaux glacier. By observing the network of fractures located in the upper Arve watershed (Fig. 1d), we can notice that they are mainly concentrated in the Arveyron de la Mer de Glace catchment. They are NE-SW and N-S oriented and can drive the subterranean fluxes southward, outside of the topographic catchment. The abundance of open fractures actually leads to a relatively higher permeability of the ground, compared with that of undisturbed crystalline rocks (Kilchmann, Reference Kilchmann2001). The real existence of deep large groundwater fluxes within the Mont Blanc massif has already been demonstrated through studies carried out on water inflows during the drilling of the Mont Blanc road tunnel (Maréchal, Reference Maréchal1998, Reference Maréchal2000, Reference Maréchal2012; Rolland and others, Reference Rolland, Cox, Boullier, Pennacchioni and Mancktelow2003). The zones characterized by high water inflows are accompanied by a decrease in the water temperature, due to the large cold water infiltration from the glaciers. The water inflows are also recharged by snow melt at the beginning of summer on the Glacier du Géant and more probably on the Glacier de Toule (Maréchal, Reference Maréchal2000), which are located in the Arveyron de la Mer de Glace catchment. On the other hand, observing the geological map (Fig. 1d), it can be noted that in the lower part of the Arveyron de la Mer de Glace catchment there is a significant amount of alluvial soils that do not exist in the Arveyron d'Argentière catchment, which likely facilitates the movement of groundwater into local shallow aquifers.
The adjustment of precipitation does not lead to a clear improvement of the computation of the sSMBhydro (Figs 5 and 6). For the Argentière glacier the two estimates of the summer surface mass balance, with and without precipitation adjustment, are respectively a little higher and a little lower than what the glaciological data suggest. In the case of Mer de Glace glacier, it seems that the adjustment leads in the wrong direction compared with the glaciological values. This simply means that this catchment might lose an important water amount through groundwater flows. Since SAFRAN reanalysis yields an underestimation of winter precipitation, the adjustment is made to reproduce the observed spatial distribution of the winter accumulation.
7. CONCLUSION
The comparison between the glaciological summer mass balances and the runoff measurements shows that the water provided by the two glaciers, including snow and ice melt, can be considered as the main contributor of summer runoff. After the quantification of all components of the summer hydrological balance equation for each study catchment, it can be seen that the contributions of the simulated glacier-wide summer surface mass balance obtained using the original and adjusted SAFRAN data to the discharge are estimated to be 58% and 49% for the Arveyron d'Argentière catchment and 54% and 42% for the Arveyron de la Mer de Glace catchment. In the two catchments, the volume of evapotranspiration remains small and does not strongly impact the hydrological balance.
The spatial distribution of precipitation within the considered catchments is adjusted using in situ winter mass balance measurements. The multiplication factors applied to the original SAFRAN data, estimated from the point winter glaciological surface mass-balance measurements, revealed that the precipitation amount that falls over the Arveyron de la Mer de Glace catchment is slightly higher than that over the Arveyron d'Argentière catchment on average (1.4 vs 1.3, respectively).
The standard uncertainty of the Argentière glacier-wide summer surface mass balance based on hydrological data are equal to ± 0.67 m w.e. a−1 over the 1996–2004 period. The differences between the glacier-wide summer glaciological surface mass balance and the two estimates of the hydrological glacier-wide summer surface mass balance, computed with and without adjusted precipitation values, are not significant and can be justified by the measurement uncertainties. In addition, the summer mass balances quantified from the hydrological and glaciological data show almost the same interannual variability. In the case of the Mer de Glace-Leschaux glacier, the average error of the glacier-wide summer surface mass balance based on hydrological data are equal to ± 0.66 m w.e. a−1. The two estimates of the glacier-wide summer surface mass balance based on hydrological data are less negative than the summer mass balances quantified from glaciological data. This difference cannot be explained by the measurement uncertainties alone and therefore it can be hypothesized that in the Arveyron de la Mer de Glace catchment the groundwater term of the hydrological balance equation cannot be neglected and that the measured discharge underestimates the real water production of the catchment. The presence of aquifers and subterranean fluxes could prevent the transfer of all of the liquid water to the outlet, leading to an underestimation of the glacier-wide summer surface mass balance for Mer de Glace-Leschaux. Further investigations are needed in order to quantify these subterranean water fluxes.
The precipitation adjustment does not improve the computation of the glacier-wide summer surface mass balance based on the hydrological data, for both Argentière and Mer de Glace glaciers. The results point out the important loss of water through groundwater flows in the Arveyron de la Mer de Glace catchment. Substantially, the adjustment of the SAFRAN reanalysis allows for a better reproduction of the spatial distribution of the winter accumulation.
In essence, this study underlines the importance of estimating the groundwater fluxes and taking them into account when they are not negligible, for a comprehensive assessment of the present and future hydro-glaciological behaviour of a catchment.
Acknowledgements
This study was conducted in the context of a research project to develop a flood forecasting system in the Arve catchment (funded by the SM3A). The authors acknowledge the French glacier observatory GLACIOCLIM (https://glacioclim.osug.fr) and the Labex OSUG@2020 (Investissements d'avenir – ANR10 LABX56). We thank CNRM/CEN (Météo-France and CNRS) for providing the SAFRAN reanalysis data and in situ snow depth data; Frederic Gottardi (EDF/DTG) for providing the hydrological data. We are grateful to R. Ranzi, O. Laarman and C. Coulaud for fruitful discussions and to S. Morin for his constructive and useful comments. We thank all those who collected data from field measurements on the two glaciers as well as meteorological and snow observations used for this study. Finally, we are very grateful to the two anonymous reviewers for their comments and suggestions that have improved greatly the quality of the manuscript.


 Open access