


1. Introduction
Pine Island Bay is the least studied drainage system of West Antarctica (Reference Vaughan, Alley and BindschadlerVaughan and others, 2001) despite its likely importance to the stability of the West Antarctic ice sheet (Reference HughesHughes, 1981). Glaciological studies of this region took a new turn in the 1990s with the advent of the European Remote-sensing Satellites ERS-1 and -2. The radar altimeter on board ERS-1 provided information about the surface topography of the drainage basin and ice shelf (Reference Bamber and BindschadlerBamber and Bindschadler, 1997).The synthetic aperture radar (SAR) data on board ERS-1 measured the ice-shelf flow velocity more precisely than in prior attempts (Reference Lucchitta, Rosanova and MullinsLucchitta and others, 1995) and provided new insights into tributary flow motion (Reference Stenoien and BentleyStenoien and Bentley, 2000). The data also revealed that rapid changes are taking place in this sector: (1) the grounding line of Pine Island Glacier retreated 5 km between 1992 and 1996 at the glacier center and less on its sides (Reference RignotRignot, 1998); (2) the drainage basin of Thwaites and Pine Island Glaciers thinned 10 cm a−1 in the 1990s (Reference Wingham, Ridout, Scharroo, Arthern and ShumWingham and others, 1998) ; (3) Pine Island Glacier thinned 1.6 m a−1 in its lower reaches, with thinning concentrated in areas of fast flow (Reference Shepherd, Wingham, Mansley and CorrShepherd and others, 2001); (4) the basin of Thwaites Glacier is significantly out of balance and its grounding line is retreating (Reference RignotRignot, 2001); and (5) the flow of Pine Island Glacier accelerated 18% over the last 8 years over a region > 150 km in length, including the ice shelf, and the glacier thinned as a result of the acceleration (Reference Rignot, Vaughan, Schmeltz, Dupont and MacAyealRignot and others, 2002).
These glaciological changes call for an explanation. While inland thinning may be related to temporal changes in snow accumulation (Reference Wingham, Ridout, Scharroo, Arthern and ShumWingham and others, 1998), and ice-shelf thinning may be due to an increase in the intensity of basal melting (Reference Jacobs, Hellmer and JenkinsJacobs and others, 1996; Reference RignotRignot, 1998), coastal thinning of fast-moving grounded ice is clearly an ice dynamic effect (Reference Rignot, Vaughan, Schmeltz, Dupont and MacAyealRignot and others, 2002; Reference Shepherd, Wingham, Mansley and CorrShepherd and others, 2001). The origin of the flow acceleration and its potential future evolution, however, are unknown. More information about the glacier flow boundaries (basal shear stress, geothermal heat flux, lateral friction, tributary flow motion, ice-shelf buttressing) and its temporal evolution is required to address this issue.
Here, we examine available aerial and satellite imagery of Pine Island Bay collected since it was first surveyed in 1947. The multi-sensor imagery is analyzed to detect glaciological changes of the floating ice shelves at the mouth of Pine Island Glacier over the past 50 years and to comment on how these changes may provide insights into the recent glaciological evolution of this sector of the West Antarctic ice sheet.
2. Study Area
Pine Island Bay is located at 75° S, 102° W in the Amundsen Sea, Antarctica. Figure 1 shows the grounding-line position, ice rises and the zone of tidal flexure (i.e. the 10 km wide region where ice adjusts to hydrostatic equilibrium) of the ice shelf. For the purpose of the discussion, the floating ice is divided into three sectors: (1) a slow-moving (50–100 m a−1) northern ice shelf, fed by two tributaries flowing at about 150 m a−1 from the Hudson Mountains and pinned down by numerous ice rises (B-N in Fig. 1); (2) a fast-moving (1000–2700 m a−1) central ice shelf, directly fed by Pine Island Glacier, and with an ice-front position confined between ice rises A and B; and (3) a smaller, southern ice shelf, fed by two tributaries that flow at 300–600 m a−1, which squeezes its way out through a narrow ice front.

Fig. 1. ERS-1 image of Pine Island Bay (see inset for location) acquired on 12 November 1995 overlain on the ice-front position in 1947 (green), 1966 (light blue), 1973 (dark blue), 1980 (red), 1992 (yellow), 1995 (black) and 2000 (purple). Dotted lines indicate the location of cracks which appeared prior to a large calving event, with a color coding corresponding to the year of observation (e.g dotted yellow for 1992 crack). The grounding-line positions in 1992 and 2000 are shown in yellow and purple, respectively. In places where two 1992 or 2000 curves are present, the mapping was done twice with independent pairs. The 1996 grounding-line position (not shown in black) is equivalent to the transition between grounded and floating ice. Tidal flexure zones are colored light blue, with an intensity modulated by radar brightness. Landmarks used for geometric control are indicated with black diamonds and annotated. Ice rises A–N are discussed in the text. Latitude is plotted every 1/4 degree, longitude every degree. Ice velocity is shown in black contours, in m a−1. ©European Space Agency 1996.
Several volcanoes, knolls and nunataks emerge from the land ice of the Hudson Mountains. These features are easily recognized in multi-sensor imagery. Combined with ice rises along the ice front (Fig. 1), they provide reliable control for the registration of imagery acquired on different years and from different platforms.
3. Methods
Pine Island Bay was discovered in 1947 during the U.S. Navy’s Operation High Jump (Reference ByrdByrd, 1947) which included the catapult ship Pine Island. The survey produced the first cartographic map of the region (courtesy of R. Allen, United States Geological Survey (USGS), Reston, VA 2000), but with considerable uncertainty in absolute referencing: comparison of that map with ERS data reveals an absolute offset of 0.5° in longitude. Yet the presence of recognizable terrain features along the Hudson Mountains permits its registration to a similar map made in 1966 (courtesy of J. Ferrigno, USGS, Reston, VA 1999) from a more accurate and complete set of aerial photos. The 1966 cartography includes vertical photography, which facilitates its registration with satellite image data. Both the 1947 and 1966 maps (scanned into a digital version) were subsequently registered to a reference ERS scene.
The first, cloud-free Landsat Multispectral Scanner (MSS) image of Pine Island Glacier was acquired in January 1973 (courtesy of B. Lucchitta, USGS, Flagstaff, AZ 1999). In the 1980s, an Advanced Very High Resolution Radiometer (AVHRR) mosaic of Antarctica was assembled by the USGS at a 1 km spacing (Reference MersonMerson, 1989; and http://terraweb.wr.usgs.gov/TRS/projects/Antarctica/AVHRR.html), which includes data over Pine Island Bay acquired in January 1980.
The ERS satellites (ERS-1 and -2) collected the first time series of radar images of Pine Island Bay, over a decade of austral summers, in early 1992. The imagery has a geolocation accuracy of 50 m and makes it possible to examine ice flow interferometrically. The ERS-1 image acquired on 12 November 1995 (orbit 22625, track 92) was used here as an absolute reference for all image data. This ERS scene was geocoded using a topographic map generated from interferometric SAR (InSAR) and controlled with the digital elevation model of Antarctica (Reference Bamber and BindschadlerBamber and Bindschadler, 1997). Control points (>20) were selected manually in the multi-sensor imagery to perform the registration, excluding features that were not preserved across the imaging spectrum or that changed in position through time. ERS data from different years were registered from amplitude correlation alone, effectively including thousands of control points, after exclusion of areas of fast-moving ice, sea ice and ice-shelf fronts. The resampling of all image data was effected using a polynomial interpolation. The resulting registration accuracy of the imagery in reference to the ERS scene is 1–2 km for the 1947 map, 500 m for the 1966 map, 100 m for Landsat MSS, 1 km for AVHRR and better than 50 m for ERS.
Ice-shelf changes were also studied interferometrically using ERS data from 1992, 1996 and 2000. The migration of the ice-shelf grounding line was mapped in 1992, 1996 and 2000 using the last ERS-1/-2 tandem acquisitions and additional tracks to complete prior mappings (Reference RignotRignot, 1998). A velocity map of the lower reaches of Pine Island Glacier, including its ice shelves, was assembled using a combination of ERS-1/-2 tracks acquired in November 1995. Details on the generation of this vector velocity map and the subsequent analysis of the retrieved strain field will be given in a follow-on article.
4. Results
4.1. Ice-front changes
Figure 1 shows changes in ice-shelf front position from 1947 to 2000. The ice front of the central ice shelf fluctuated greatly over the years (e.g. Reference Jenkins, Vaughan, Jacobs, Hellmer and KeysJenkins and others, 1997), yet there is no discernible change in the mean position of the ice front over the last 50 years. Year-to-year fluctuations in ice-front position in the 1990s were clearly influenced by periodic, major calving events which removed tabular icebergs up to several km long and 10–20 km wide. An example calving event from late 1995 is shown in Figure 2. The ice front retreated 4 km as a result of this calving event. The two tabular icebergs that calved off the ice shelf rapidly moved away from the glacier front: the images in Figure 2c and d were collected, respectively, 1 day and 35 days after the image in Figure 2b.

Fig. 2. Calving event in Pine Island Bay from late 1995. (a) ERS-1 image acquired on 12 November 1995; (b) ERS-1 image acquired on 21 January 1996; (c) ERS-2 image acquired on 22 January 1996; and (d) ERS-1 image acquired on 25 February 1996. See Figure 1 for location. ©European Space Agency 1996.
All ERS data collected in 1992–2000 show a bay free of large tabular icebergs. This situation contrasts with the imagery of the glacier front in 1947 which shows a long series of tabular bergs forming a near-continuum with the ice front, glued together with an ice melange of what is probably broken ice, sea ice, blown snow and smaller bergs (Fig. 3). From the speed of the glacier and the horizontal scale of these bergs, they correspond to calving events cumulated over more than a decade. Similarly, data from 1966, 1973 and 1980 reveal the presence of series of tabular bergs glued to the ice front (Fig. 4). Calf-ice production did not increase after 1980, or the ice front would have experienced a discernible retreat, and there is no seasonal bias in the data, which were all acquired in January–February. The data therefore suggest a reduction in the residence time of tabular bergs at the front of the glacier between the period 1947–80 and the 1990s, which could be due to a change in atmospheric forcing (e.g. wind, surface currents) or a decrease in sea-ice cover.

Fig. 3. Aerial photograph of Pine Island Bay recorded in January 1947, with location of Evans Knoll, ice rise A, and ice front going from north (a, b) to south (c). A tenuous crack is visible several km inland of the inferred ice front. The location of the pictures is shown in Figure 4a in red. The images are from USGS, Reston, Virginia, TMA5137 series.
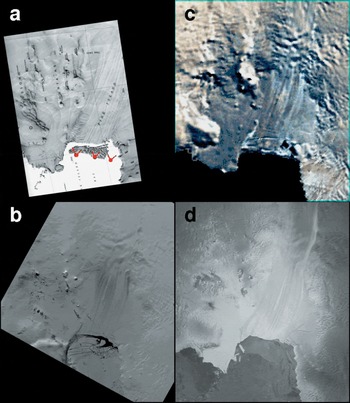
Fig. 4. Pine Island Bay in (a) January 1966 (vertical aerial photography), (b) January 1973 (Landsat MSS), (c) January 1980 (AVHRR) and (d) September 1997 (RADARSAT) from multiple sensors. The locations of the photographs in Figure 3 are shown by red angles in (a). ©Canadian Space Agency 1997.
The ice front of the southern ice shelf did not migrate between 1947 and 2000. In contrast, the front of the northern ice shelf retreated rapidly, especially in recent years. The retreat is observed along the sector bordered by ice rises G and J beginning between 1973 and 1980 (Fig. 1), followed by a retreat along E-G and J-M in subsequent years. A rift between G, I and J increased in width between 1996 and 2000, indicating that a large piece of that sector will calve in the near future. Although the time series of observations is sparse, it is unlikely to have missed readvance events in between since the ice-shelf front moves rather slowly. The image data therefore suggest an accelerating rate of retreat of the northern ice shelf from enhanced calving.
The ice-shelf area between ice rises E and M was 930 km2 in 1966. It was reduced by 13.3% in 1992 (in reference to 1966), 16.7% in 1996 and 27.2% in 2000. The reduction in ice-shelf area over the last 8 years (14%) is therefore equivalent to its reduction in the previous three decades. It is also three times greater in 1996–2000 than in 1992–96. The rate of retreat is therefore accelerating with time rather than remaining constant. At the current rate of retreat, half of the 1966 ice shelf will be removed by 2010.
4.2. Ice-shelf rifting
Figure 5 shows new cracks and rifts formed on the central ice shelf prior to 2000 that are much less visible in the 1992 or 1996 imagery, using the same sensor and imaging geometry. These features are likely to be rifts rather than surface crevasses, meaning that they penetrate the entire ice-shelf thickness. Their appearance in ERS imagery is similar to the rifts and cracks observed in the wake of Hemmen Ice Rise, Ronne Ice Shelf, Antarctica (Reference Hartl, Thiel, Wu, Doake and SieversHartl and others 1994; Reference Rignot and MacAyealRignot and MacAyeal, 1998), and is confirmed by the examination of higher-resolution imagery (Reference Bindschadler and RignotBindschadler and Rignot, 2001).

Fig. 5. ERS-1 image of ice-shelf rifting in Pine Island Bay on (a) 15 February 1992, (b) 12 November 1995, (c) 10 April 2000 and (d) 15 May 2000. Ice rises A–C (see Fig. 1) are indicated, along with Evans Knoll. ©European Space Agency 2000.
The floating ice between Evans Knoll and ice rises B and C (Fig. 1) is deeply incised and fractured in 2000 (Fig. 5c and d). As a result, this part of the ice shelf is likely contributing less side-shear resistance to inland flow than in prior years. The sector between B and the ice front is even more heavily rifted, and is probably not contributing any resistance to ice flow in 2000, as discussed below. The entire sector between Evans Knoll and the ice front, or 30% in length of the northern flank of the central ice shelf, is in a similar state of mechanical decay.
In January 2001, a crack was identified upstream of the 2000 ice front using Landsat 7 imagery (Reference Bindschadler and RignotBindschadler and Rignot, 2001).The crack location, shown as the dotted purple line in Figure 1, had already been noted in RADARSAT data acquired in September 2000, but went unreported (personal communication from I. Joughin, 2000). ERS imagery subsequently revealed that the crack appeared in < 35 days between 10 April 2000 (Fig. 5c) and 15 May 2000 (Fig. 5d), suggesting a dynamic rupture of the ice shelf rather than the slow propagation of a rupture tip via viscoelastic processes. The crack was 19 km long and 200 m wide near ice rise B and < 40 m at its western end in May 2000. The rupture tip of the crack is difficult to locate precisely in the radar imagery due to the presence of image speckle, but the origin of the rupture clearly belongs to a pre-existing rift in the wake of ice rise B (e.g. Fig. 5c). Subsequent imagery (not shown in Fig. 5) indicates that the rift increased in width with time and continued its transverse-flow progression across the shelf. The detached portion of the ice shelf (between B and the ice front) is therefore moving faster than the rest of the ice shelf, and as such is no longer participating in the overall ice-shelf resistance to inland ice flow.
ERS imagery shows that a crack of similar width and length occurred 2 km downstream in 1992 and 4.5 km downstream in 1996 (Fig. 1). Hence, ice-shelf rupturing took place near that location in the past, yet there is no prior record of a crack opening this far upstream and accompanied by fresh lines of enhanced rifting near the ice-shelf pinning points.
4.3. Grounding-line migration
Figure 6 shows the migration of the grounding line of Pine Island Glacier between 1992, 1996 and 2000, effectively updating the results in Reference RignotRignot (1998). Figure 1 shows the grounding-line migration between 1992 and 2000 for the northern and southern ice shelves. The grounding-line mapping was performed using double-difference interferograms corrected for topography. Surface topography was derived from a combination of InSAR data and radar altimetry data. The results show that the grounding-line retreat is most pronounced along Pine Island Glacier, which continued its retreat after 1996. In contrast, little retreat is observed along the southern and northern ice shelves (Fig. 1).

Fig. 6. Grounding-line retreat of Pine Island Glacier between (a) 1992 (red) (pair 3418, 3375 and 3461 in Table 1) (b) 1996 (white) (pair 23627, 24128 in Table 1), and (c) 2000 (black) (pair 43599, 45102 in Table 1) overlain on an image of tidal deformation for each epoch. One color cycle (from purple to yellow, blue and purple again) represents a 3 cm increment in vertical motion of the floating ice. Segment A, discussed in the text, is used to calculate an average rate of retreat at the glacier center.
The 2000 grounding-line position of Pine Island Glacier is more sinuous than those obtained from prior years, which requires an explanation. One factor is the presence of a low-slope region immediately upstream of the 1996 grounding line, identified as an ice plain by Reference Corr, Doake, Jenkins and VaughanCorr and others (2001). The grounding line is likely migrating more significantly back and forth with changes in ocean tide as the ice retreats in a sector which is already close to hydrostatic equilibrium. A second factor is a stronger contamination of the interferometric signal with flow changes in 2000 than in 1992 and 1996. The glacier velocity is 2500 m a−1, and the flow acceleration is 2% a−1 (Reference Rignot, Vaughan, Schmeltz, Dupont and MacAyealRignot and others, 2002). In 1992, the grounding line was mapped by differencing two 6 day interferograms acquired 6 days apart, i.e. over a time period for which the glacier flow was not expected to change at a detectable level, i.e. about 0.8 m a−1. In 1996, the two 1 day interferograms which we differenced were acquired 35 days apart. In 2000, the mapping combined pairs acquired 105 days apart (no other data were acquired in between those dates), implying a change in velocity of 14 m a−1, equivalent to half an interferometric fringe at the glacier center and less on the sides. The flow acceleration may therefore have slightly contaminated the differential fringes.
Reference RignotRignot (1998) used the largest retreat rate at the glacier center to estimate glacier thinning. To obtain an estimate that may be more readily comparable with satellite radar altimetry data (which average results over several km), the rate of retreat was here re-evaluated along a 14 km long segment labeled A in Figure 6, at the glacier center. The calculated mean retreat is 4.4 km for 1992–2000 and 2.5 km for 1992–96. Using a glacier slope of −0.5 % and a bed slope of +1% (both slopes are counted positive upwards, as in Reference RignotRignot (1998)), the inferred rate of glacier thinning is 1.9 m a−1 for 1992–2000 and 2.1 m a−1 for 1992–96. These results are consistent with Reference Shepherd, Wingham, Mansley and CorrShepherd and others’ (2001) estimate of 1.6 m a−1 thinning near the grounding-line center. No particular trend in ice thinning is noted over the 8 year time period.
A retreat of the grounding line is detected along several of the tributaries of Pine Island Glacier, but the amplitude of the retreat is much less than along Pine Island Glacier, and closer to the range of variability expected from changes in oceanic tides. A retreat is detected for the tributary at 74.5° S, 100° W, west of Mount Moses (Fig. 1); no grounding-line migration data are available along the second tributary that flows between Mount Moses and Mount Manthe; a retreat is detected on the tributary flowing south of Shepherd Dome, on the northern flank of Pine Island Glacier at 75° S, 99.5° W (Fig. 1). In contrast, the level of retreat on the tributaries feeding into the southern ice shelf is negligible.
4.4. Ephemeral grounding
Figure 7 shows the evolution of areas of ephemeral grounding on the northern ice shelf between 1992 and 2000. Ephemeral grounding means that the ice shelf is only grounded at low tide but not at high tide (Reference Schmeltz, Rignot and MacAyealSchmeltz and others, 2001). In contrast, an ice rise is grounded at all tides. The magnitude of tidal flexing recorded with InSAR between the center of a zone of ephemeral grounding and the surrounding freely floating ice is always less than that recorded between an ice rise and floating ice. Hence, fewer interferometric fringes are counted across the tidal flexure zone of an area of ephemeral grounding than across the flexure zone of an ice rise.

Fig. 7. Tidal deformation of the northern ice shelf (see Fig. 1 for location) in (a) 1992, (b) 1996 and (c) 2000. One color cycle (from purple to yellow, blue and purple again) represents a 3 cm increment in vertical displacement of the ice shelf due to a change in oceanic tide. Areas of ephemeral grounding in E1–E3 in (d) progressively disappear from (a–c) due to ice-shelf thinning
If the thickness of the ice shelf decreases with time around an area of ephemeral grounding, the duration of contact between the ice-shelf bottom and bedrock will decrease during the tidal cycle, hence the number of displacement fringes recorded across the flexure zone will be less. The exact reduction in the number of fringes observed across the area of ephemeral grounding, however, will also depend on the oceanic tides at the time of imaging. For instance, if all imagery were acquired at low tide, it would not be possible to distinguish an ice rise from areas of ephemeral grounding. Conversely, imagery acquired at high tide would only detect ice rises.
Here, the data show that the ice shelf was nearly grounded at E1–E3 (Fig. 1) in 1992, and nearly ungrounded in 2000 (Table 1). Conversely, no new zones of partial grounding appeared in 2000 that were not present in prior years. This trend is indicative of thinning and unpinning of the ice shelf.
Table 1. ERS-1 orbit number, tidal displacement measured with InSAR, and tidal displacements predicted by FES99 at the time of acquisition of ERS data in Pine Island Bay

The tidal displacements calculated using the FES99 tidal model (F. Lefevre and others, unpublished information) are compared with the differential tides measured with InSAR in Table 1. InSAR measures changes in tidal displacement between three (in the case of 1992 data) or four epochs (in the case of 1996 and 2000 data). Table 1 indicates that the FES99 tidal predictions are accurate to first order (standard deviation is ±9 cm). This accuracy is low compared to the nominal performance of the FES99 tidal model at lower latitudes (2–3 cm), but this is expected since the coastal regions of Antarctica are not constrained by satellite altimetry data and the bathymetry of Pine Island Bay is poorly known.
The precision of the FES99 tidal model is sufficient to allow the following observations to be made. First, the disappearance of zones of ephemeral grounding is not an artefact of oceanic tides. This would be the case if, for instance, the lowest tide in 2000 — lowest tide means greater potential of contact with bedrock — were significantly more positive (i.e. upwards) than in 1996 or 1992. Table 1 shows that the lowest tide in the 2000 data (−45.1 cm) is comparable to that in the 1996 (−33.1 cm) and 1992 (−36 cm) data. Second, if we assume that the tidal predictions are correct, it is possible to estimate the mean-sea-level water-column thickness underneath areas of ephemeral grounding and determine how it changed with time. For instance, in 1992 (Fig. 7a), E2 displayed 6 tidal fringes (or 18 cm), whereas the full tidal displacement was 11 fringes (or 33 cm). E2 must have been in contact with bedrock at the lowest tide (−36 cm), otherwise there would be no ephemeral grounding, but it could not have been in contact with bedrock at the highest tide (−4 cm), otherwise it would look like an ice rise. The 18 cm displacement exhibited by E2 therefore implies a mean-sea-level water-column thickness of 33 − 18 = 15 cm. In 2000, E2 exhibited 0.5 fringes or 1 cm. It must have been in contact with bedrock only at the lowest tide (−45 cm), which indicates a water-column thickness of 45 − 1 = 44 cm. This implies a reduction in ice-shelf thickness of (44 − 15) = 29 cm in 8 years at E2. The same exercise repeated at E3 yields an increase in water-column thickness of 33 cm in 8 years. At E1, the water-column thickness increased from 6 cm in 1992 to 42 cm in 2000. Overall, the increase in mean-sea-level water thickness is 4.1 ± 0.5 cm a over E1–E3, which is equivalent to a reduction in ice thickness of about 4.5 cm a−1.
This calculated thinning rate is low, but it is measured over a part of the ice shelf where basal melting is likely to be low: the water-column thickness is shallow, hence limiting heat-flow exchanges, and the ice-shelf thickness is only 100–200 m vs 1200 m for Pine Island Glacier. Basal melting should be at least one order of magnitude less in that region than in the deeper part of the sub-ice cavity of Pine Island Glacier since the melting point of ice decreases linearly with increasing water pressure and hence the depth of the ice draft. The more important aspect of the observed thinning, however, is that the ice shelf is slowly unpinning from its anchor points.
5. Discussion
Sediment analysis by Reference Kellogg and KelloggKellogg and Kellogg (1987) suggested the presence of a more extensive ice shelf in Pine Island Bay in the past, yet with considerable uncertainty in the timing of the retreat. The remote-sensing data presented here indicate that the ice shelf was not significantly larger in 1947 than at present, so that any retreat of a more extensive paleo ice shelf must have started > 50 years ago. Ice-shelf changes seemed rather subdued between 1947 and 1973, but apparently began to accelerate in the 1980s. The central ice shelf, which is directly fed by Pine Island Glacier, now thins at 1.9 m a−1 and shows signs of rifting and rupturing along its northern flank that were not visible in earlier imagery. The rapid grounding-line thinning of the central ice shelf is for the most part explained by the flow acceleration of Pine Island Glacier, as discussed by Reference Rignot, Vaughan, Schmeltz, Dupont and MacAyealRignot and others (2002). The thinning of the northern ice shelf is less likely to be the result of flow changes, because the creep rates are much lower; it probably implies an increase in basal melting above that which would maintain the ice shelf in a state of mass balance.
The ongoing ice-shelf retreat in Pine Island Bay is unlike the more spectacular and well-documented collapses recorded further north along the Antarctic Peninsula (Reference Doake, Corr, Rott, Skvarca and YoungDoake and others, 1998). The collapse of the Larsen and Wordie Ice Shelves has been attributed to a vigorous regional increase in air temperature which brought those ice shelves under the limit of viability as determined by Reference MercerMercer (1978). Water-filled crevasses (Reference Doake, Corr, Rott, Skvarca and YoungDoake and others, 1998) and warmer summer temperatures (Reference Scambos, Hulbe, Fahnestock and BohlanderScambos and others, 2000) caused enhanced crevassing, rifting and breaking-up of those ice shelves. In Pine Island Bay, air temperatures are much lower than along the Antarctic Peninsula, and surface melting, if any, is unlikely to produce water-filled crevasses, at least not ones that have been documented with remote-sensing data. Processes other than air temperature and surface melt must control the mechanical competence and evolution of ice in Pine Island Bay.
One major factor in the evolution of the ice shelves should be basal melting. Basal melting is particularly effective in Pine Island Bay due to the presence of warm circumpolar deep water (CDW), which has long been known to intrude onto the continental shelf (Reference Jacobs, Hellmer and JenkinsJacobs and others, 1996), and which is typically 2°C warmer than at most other locations on the Antarctic shelf. Basal melting is very sensitive to ocean temperature (Reference Hellmer, Jacobs, Jenkins, Jacobs and WeissHellmer and others, 1998), and hence to the presence of CDW. An increase in basal melting compared to that required to maintain the ice shelves in a state of mass balance would obviously cause the ice shelves to thin. As the grounding line of the glaciers starts to retreat, basal melting would further increase because the ice sheet would retreat into a deeper basin.
As an equivalent to the water-filled surface crevasses pervading on the Larsen and Wordie Ice Shelves, bottom crevasses generated in the wake of grounding lines, ice rises and floating shear margins (Reference Jezek and BentleyJezek and Bentley, 1983) may propagate upwards more easily through the ice column if eroded and/or warmed by a tidally mixed influx of warm water. Bottom crevasses are most likely to be at the origin of the rifts observed in 2000 since water-free surface crevasses should not be able to evolve into rifts (Reference WeertmanWeertman, 1980; Reference Van der VeenVan der Veen, 1998).
What is the evidence for ongoing changes in the Bellingshausen and Amundsen Seas sector of West Antarctica? One evidence is a 20% decline in sea-ice cover between 1973 and 1993 reported by Reference Jacobs and ComisoJacobs and Comiso (1997). They attributed this trend to enhanced surface currents caused by a change in atmospheric forcing, or to the upwelling of warm CDW on the continental shelf. More recent analysis indicates that the trend persisted at least through 1998 (Reference Kwok and ComisoKwok and Comiso, 2002; personal communication from J. C. Comiso, 2001). It is the most significant negative trend in sea-ice cover in Antarctica. Reference Kwok and ComisoKwok and Comiso (2002) further noted that the entire Bellingshausen/Amundsen Sea sector has a significant correlation with the Southern Oscillation (SO), which is unique in Antarctica. Yet there is no significant trend in the SO over the last 20 years which would explain the observed negative trend in sea-ice cover.
A reduction in sea-ice cover alters the vertical heat flux, brine formation and sub-ice-shelf circulation. Reference NichollsNicholls (1997) argues that this results in a reduction rather than an increase in melt intensity since the thermohaline convection responsible for melting is reduced. This conclusion applies, for instance, to the case of the Ronne Ice Shelf for which a thermohaline convection is the principal mechanism of basal erosion. It does not apply to the ice shelves in Pine Island Bay where a second mechanism of basal erosion involving intermediate-depth warm-water inflows from the slope-front region directly onto the ice shelf (Reference Jacobs, Hellmer, Doake, Jenkins and FrolichJacobs and others, 1992) is believed to be the main factor responsible for the observed high melt rates (Reference Jacobs, Hellmer and JenkinsJacobs and others, 1996).
Another line of evidence for anomalies in this sector of Antarctica is that ice shelves throughout the Amundsen and Bellingshausen Seas are experiencing high rates of thin-ning at present, as observed with ERS radar altimetry (H. J. Zwally and others, unpublished information). The observed thinning rates (up to several m a−1 in some sectors) are too large to be attributed to changes in snow precipitation, surface melt or creep flow. They must be thinning principally by basal ablation.
6. Conclusions
An analysis of glacier imagery collected in Pine Island Bay over half a century suggests that its floating glacier ice is retreating and weakening, with a marked acceleration of that trend in the last decade. The satellite observations do not suggest that the ice shelves in this region are in steady state at present. The coincidence of the retreat of the central ice shelf with the flow acceleration of Pine Island Glacier is not fortuitous and suggests that ongoing changes in floating ice may have had an impact on the inland flow of ice. Most of the buttressing force exerted by the ice shelf onto the grounded ice is from lateral shear (ice rises A and B exert little buttressing at the grounding line), which in turn is directly influenced by the presence of rifts and crevasses along the shear margins. A rifted shear margin will exert less side shear, and hence decrease lateral resistance to inland flow, and allow faster rates of ice discharge from inland. This issue is addressed in more detail in a forthcoming paper on a model study of Pine Island Glacier.
Although Pine Island Bay lies well south of the limit of viability of ice shelves suggested by Reference MercerMercer (1978) (−5°C mean January temperature), its ice shelves are almost certainly thinning, weakening and fracturing at present and its grounding line is retreating. The cause of thinning and weakening is unlikely to be a change in surface conditions, such as air temperature, but could be a change in oceanic forcing related, for instance, to the intrusion of warm CDW over the continental ice shelf. This possibility suggests that oceanic forcing should be considered as a factor equally important to atmospheric forcing in predictive studies of the evolution of Antarctic ice shelves in a warmer climate.
Acknowledgements
This work was performed at the Jet Propulsion Laboratory, California Institute of Technology, under a contract with the National Aeronautics and Space Administration (NASA) Cryospheric Sciences Program. I thank the reviewers, C. S. M. Doake and C. R. Bentley, and the Scientific Editor, J.W. Glen, for helping me greatly improve the quality of the manuscript, and the European Space Agency’s VECTRA project and NASA’s Alaska SAR Facility for providing the ERS radar data employed in this study.


