


1. Introduction
The study of economic inequality has soared in recent years thanks to numerous studies dedicated to the proper measurement of inequality (Atkinson et al., Reference Atkinson, Piketty and Saez2011; Kopczuk et al., Reference Kopczuk, Saez and Song2010; Piketty and Saez, Reference Piketty and Saez2003; Piketty et al., Reference Piketty, Saez and Zucman2017). This prompted attempts to link inequality to economic growth (Bowles, Reference Bowles2012; Cingano, Reference Cingano2014; Deaton, Reference Deaton2003). Some studies found that inequality deters growth (Alesina and Perotti, Reference Alesina and Perotti1996; Atems and Jones, Reference Atems and Jones2015; Halter et al., Reference Halter, Oechslin and Zweimüller2014) whereas others have found no significant effects (Ferreira et al., Reference Ferreira, Lakner, Lugo and Özler2018) or even positive effects (Forbes, Reference Forbes2000).
This range of results implies that something else is in play. One prominent explanation for the discordance relates to the role of the institutions in determining the level and effects of inequality (Ashby and Sobel, Reference Ashby and Sobel2008; Bennett and Nikolaev, Reference Bennett and Nikolaev2017; Bennett and Vedder, Reference Bennett and Vedder2013; Boudreaux, Reference Boudreaux2014; Hall and Lawson, Reference Hall and Lawson2014; Holcombe and Boudreaux, Reference Holcombe and Boudreaux2016; Sturm and de Haan, Reference Sturm and de Haan2015). Essentially, inequality affects outcomes conditional on the quality of institutions within a country.
To test this statement, we propose to concentrate on the microcosm of outcomes in Summer Olympic Games. Microcosms have often been used in the literature on inequality because they concentrate on one particular through which inequality affects outcomes.Footnote 1
The Olympics are a particular fruitful microcosm for connecting inequality, institutions and outcomes. Innate talents required to compete in the Olympics are unrelated to wealth; rich and poor can be high-performing athletes. The costs of talent development are subjectively greater for the poorest. Thus, more inequality entails that a larger share of the population faces a significant cost hurdle to participation in the Olympics. Some potential medal-winning athletes cannot participate which reduces medal counts (Bai et al., Reference Bai, Uhlmann and Berdahl2015; Berdahl et al., Reference Berdahl, Uhlmann and Bai2015). The effect of inequality can be mitigated, or even overturned, by better institutions that allow athletes to appropriate the gains of Olympic participation. As the gains can be disproportionately large for the poorest (relative to their incomes), there is a strong incentive to invest in training. Thus, countries with better institutions, most notably with respect to property rights protections that permit appropriation of the gains, mitigate the effects of inequality.
To test this possibility, we use the Rio 2016 Olympics. Data regarding medal numbers and the characteristics of participating countries were combined with the data from the Economic Freedom of the World (EFW) database as our proxy for institutional quality (Hall and Lawson, Reference Hall and Lawson2014; Hall et al., Reference Hall, Sobel and Crowley2010). As the index of economic freedom includes a security of property rights component, it speaks to the ability to secure gains of Olympic participation. We expect economic freedom to improve Olympic performance. Our results bear out our argument: countries with low economic freedom experienced larger negative effects of inequality on medals won per million inhabitants whereas those with more economic freedom experienced no statistically significant effects. For the sake of robustness, we also employ a hurdle model and find that the marginal effect of economic freedom is large and overshadows that of inequality. Our results also hold in the face of robustness checks regarding the demographic size of nations.
We divide our paper as follows. In section 2, we discuss the literature on inequality and the Olympics in order to properly frame our theoretical proposition. In section 3, we highlight the data and methodology that we used. In section 4, we present our results. In section 5, we discuss and conclude.
2. Inequality, future outcomes and the Olympics
Many arguments regarding the negative relationship between inequality and outcomes speak to relative capabilities. Robert Fogel (Reference Fogel1994) pointed out that food production in 18th century France was so low that those at the bottom of the income distribution were so undernourished that they could not provide more than 6 hours of light work every day. Chronic malnutrition limited the ability to increase incomes. Elsewhere, Angus Deaton (Reference Deaton2003: 130–131) rephrased the argument by stating that guaranteeing ‘basic needs’ by redistribution enables those at the bottom ‘to participate gainfully in the labor market’. As such, ‘destitution is (…) seen as a problem that can be dealt with by a more equitable distribution’. Channels that emphasize heavier credit constraints at the bottom of the income distribution or limit the ability to make investments in human capital amount to the same: more inequality entails greater constraints at the bottom of the income distribution.
The link between inequality and the ability to win medals is similar. Innate athletic skills are distributed independently of income. However, the training of an athlete is a costly endeavor – a cost which is also independent of income. Athletes from richer households have an easier time clearing that hurdle. Thus, the pool of the best athletes in a country is limited by this ability to leap over the cost hurdle. All else being equal, high inequality limits the ability of the poorest to participate in international competitions such as the quadrennial Olympic Games (Krishna and Haglund, Reference Krishna and Haglund2008). Most studies of Olympic outcomes rarely consider inequality (Bernard and Busse, Reference Bernard and Busse2004; Johnson and Ali, Reference Johnson and Ali2004; Trivedi and Zimmer, Reference Trivedi and Zimmer2014). However, the few studies that do find a negative effect of inequality on Olympic performance (Bai et al., Reference Bai, Uhlmann and Berdahl2015; Berdahl et al., Reference Berdahl, Uhlmann and Bai2015).
On the other hand, we ought to consider the gains of winning a medal as well. There are important rewards from Olympic participation (e.g. prizes, prestige, advertisement contracts, etc.). Thus, inequality can also act as a motivator. In fact, if the rewards are roughly equal in monetary terms, it stands to reason that they are subjectively more valuable for those at the bottom of the income distribution. Thus, the issue becomes one of the appropriability of the benefits from training efforts (Alchian, Reference Alchian1965; Campbell et al., Reference Campbell, Mixon and Sawyer2005; Shughart and Tollison, Reference Shughart and Tollison1993) which brings in the role of property rights regimes. Secure property rights animate individuals to allocate productive resources to the most valued ends.Footnote 2 Using the Olympic performance of former communist countries during their transition to market economies, Shughart and Tollison (Reference Shughart and Tollison1993) argued that private property rights were ‘not sufficiently well established to permit these athletes to capitalize the returns from Olympic victory in ways available to their Western counterparts’. The result was that athletes ‘tended to supply less medal winning effort’ in the 1992 Olympic Games which they used as their example (as these Olympics occurred during a transition).Footnote 3
Campbell et al. (Reference Campbell, Mixon and Sawyer2005) extended on Shughart and Tollison's insights by testing whether or not economic freedom affected medal counts. Although they found that economic freedom had a strong positive effect on medal counts, it is their choice of economic freedom as a measure institutional quality that matters to us. For our purposes, it is the ‘legal system and property rights’ component of the economic freedom index that matters most. That component of the index attributes values based on the protection of property rights, the legal enforcement of contracts, the reliability of police forces and the regulatory costs of the sale of property (Fraser Institute, 2018).Footnote 4 All of these elements speak to whether or not athletes can appropriate the returns from their efforts. A weak property rights regime (i.e. a regime with low economic freedom) creates fewer incentives to invest efforts in athletic performance. There is already corollary support in the form of the finding that corruption reduces medal counts (Pierdzioch and Emrich, Reference Pierdzioch and Emrich2013). As corruption undermines the quality of property rights, it reduces the ability to appropriate returns from winning a medal and, consequently, deters effort. In other words, just as they are expected to increase productivity-enhancing capital investments (Hall and Lawson, Reference Hall and Lawson2014; Hall et al., Reference Hall, Sobel and Crowley2010), property rights can increase investments in enhancing Olympic productivity.
In other words, bad institutions amplify the effect of inequality on medal numbers and good institutions mitigate that effect. At the same level of inequality, countries with better institutions provide stronger incentives for those at the bottom to invest resources toward winning medals. The countries with bad institutions are unable to generate the same efforts. Thus, we can expect that, if grouped by level of inequality, countries with better institutions win more medals (all else being equal). Conversely, if grouped by quality of institutions, we can expect that countries with less inequality win more medals. Finally, there is the possibility that one channel dominates the other. We consider all these possibilities in this paper.
3. Methods and data
Our empirical strategy has to reflect our underlying assumption of the heterogeneous impact of inequality on Olympic performance assumption. In terms of estimation strategy the heterogeneous impact of inequality can be captured using multiple equilibria analysis. We start with an assumption that there are at least two institutional regimes, under which inequality can either be detrimental to performance of athletes (regime of low level of economic freedom), or irrelevant for the performance of athletes (regime of high level of economic freedom). Under the regime of low economic freedom, athletes cannot easily appropriate the gains from winning a medal and thus there are fewer incentives to invest in improving Olympic performance. Under the regime of high economic freedom, these incentives are stronger and more numerous. In both regimes, the cost that inequality imposes is the same so that only the benefits that athletes can capture (i.e. those which stem from institutional quality) generate differences in performance. To do so we apply a threshold model to estimate the threshold between two regimes, rather than making an arbitrary decision (Hansen, Reference Hansen2000). The model takes the following form:

where y i is the outcome variable, namely medals per million persons; x i is the level of inequality; c i are controls for income, saving, expenditures on health and military, life expectancy, age, weight and number of athletes; u i is the error term; θ and β are coefficients for the related regimes. It follows that q i represents the threshold variable, namely the index of economic freedom, whereas γ is the threshold separating the two regimes.
Institutions enter the estimation indirectly as a regime identifier. Comparing θ 1 and θ 2 would provide information on the impact of institutional regimes on the interplay between inequality and the outcome variable. However, we might be interested in the direct impact of institutions on the outcome variable. In addition, multiple equilibria analysis is applied to the outcome variable as well as countries with zero medals should be considered in a separate equation resembling hurdle model. We reformulate model (1) with respect to a natural threshold of zero in the outcome variables and define two equations: the first equation explains the non-zero part, whereas the second equation explains the probability of winning at least one medal (zero against non-zero outcome). However, the given hurdle model does not imply a threshold. Countries not scoring any medals would most likely have a different set of slopes for the same variables. The hurdle model can be specified in the following way, where the first equation is estimated using a gamma regressionFootnote 5 and the second equation is estimated using a logit model:

where y i would be the number of medals per one million population, excluding zeros, and nonzero i would be the binary outcome for zero and nonzero cases. π and ϕ are the coefficients, whereas e and v are the errors. Due to the nonlinear nature of the gamma and logit models, average marginal effects (AMEs) are calculated and reported.
We combined multiple datasets to obtain estimates of inequality and relevant controls (see Table 1). The data on medals and population were taken from IOC (2012, 2016) and The World Bank (2018). We calculate the number of medals per million inhabitants to capture a country's effectiveness in winning medals. We used the EFW index produced by the Fraser Institute (2018) and averaged the values over the period of 2000–2014.Footnote 6 The EFW is particularly well-suited for our purposes because of the property rights component (which carry an important weight in the index) which speaks to athletes' ability to appropriate the rents from Olympic participation. Thus, it is an efficient tool to test our argument that inequality's effects are offset by institutional quality. Averaging of the EFW values is an important feature of the present paper as the decision to invest efforts is based on property rights before the Olympics which is why we average the values of EFW before the Olympics.
Table 1. Descriptive statistics

The proxies for inequality (Gini index and the income share of the top 10%) were taken from The World Bank (2018). Following the same logic as for the EFW, we averaged them for the period of 2000–2014 or 2000–2015, where applicable. As for control variables, we included GDP per capita, savings rate, state expenditures on health and the military, life expectancyFootnote 7 and the characteristics of athletes who participated.Footnote 8 The variables for GDP per capita and the savings rate are used because they capture the stock of resources available in any given country (with the expectation that richer countries can more easily afford Olympic participation). The variables for state expenditures on health and the military are used as proxies for state support to sports aimed at reducing the portion of training costs that are shouldered by athletes themselves. Only a handful of countries report data on state support to sports (International Monetary Fund, 2020). However, we expect a correlation between state expenditures on health and the military and state support for sports.Footnote 9 Thus, these variables are included as proxies to avoid a potential bias from omitting a variable measuring the degree to which training costs are being socialized through government funding to sports. Life expectancy is included to capture the overall health of the population. We also included country-averaged statistics of individual athletes as well as controls for broader regions (e.g. sub-Saharan Africa, East Asia, Latin America, Europe, etc.).Footnote 10 We also included a control variable for the medals won in previous Olympic Games. This is done to reflect the finding that investments for one Olympics increased significantly the chance of winning medals in subsequent Olympics (Bernard and Busse, Reference Bernard and Busse2004).Footnote 11 In other words, we account for a persistence effect of previous Olympics.
We also need to discuss our main variable of interest, medals won relative to population, in order to explain additional steps that we took. We selected that variable because it relates to the efficiency of countries in winning medals. Because the number of medals is expressed relative to population, including an independent variable for population size would create collinearity. However, population is a relevant indicator because it speaks to the availability of resources for competitions (Bernard and Busse, Reference Bernard and Busse2004; Rathke and Woitek, Reference Rathke and Woitek2008; Tcha and Pershin, Reference Tcha and Pershin2003). Thus, we could be biasing our results by omitting a population variable. We provide two solutions. First, we include the number of athletes per country as a share of all participating athletes. This indirectly captures some of the effect of population size as larger countries have more athletes. However, this is far from ideal because it is a measure of relative size and will not capture the absolute effect of population. As such, we took the second step of including a robustness check where we alter our econometric strategy. Rather than using medals to population, we use the medal count. This allows us to include population polynomials. Because of the large number of zeroes, we apply zero-inflated negative binomial regressions. Our main results are found to hold (see footnote 16 for the online appendix).
Before we proceed, we must highlight one limitation of our approach that we were unable to circumvent. Not all Olympic disciplines are the same in terms of costs: training an athlete for cycling is costlier than training for the 100 m dash. These costs, in turn, may affect the choice of disciplines in which athletes specialize especially in countries with high levels of inequality. To resolve this problem, we attempted to create a ranking of the costs of the different disciplines but the sources we found were of low quality and disagreed heavily on the actual ranking (in part because the costs of training also vary by country).Footnote 12 As such, we were unable to resolve this issue. However, we indirectly and partially control for this problem. First, our variable for income per capita controls for athletes' foregone incomes. Second, the costs of Olympic training include expensive facilities that exceed the private cost to athletes are often covered by government funding or by private sponsorship. Our inclusion of state expenditures on health and the military helps capture the part of training costs that are funded through taxpayers (see footnote 10). Essentially, these entail that we capture the training costs that are borne by athletes and governments but we do not capture costs borne by private sponsors. Thus, these are imperfect remedies that nevertheless minimize the problem of the lack of reliable cost estimates by discipline.
4. Results
4.1 Main results
Basic ordinary least squares (OLS) regressions (Table 2) show that inequality is a significant negative determinant of Olympic outcomes. Residual diagnostics show the absence of serial correlation, yet the presence of heteroskedasticity. Therefore, throughout the analysis, robust standard errors are used. The results of the threshold regression are crucial to our analysis. The findings confirm heterogeneous slopes for inequality proxies. The coefficients for the inequality proxies from the overall analysis (Table 2, columns 1 and 2) are negative and significant. These effects remain significant at the 10% level even after controlling for the results during the lagged Olympic Games (columns 3 and 4). From the basic threshold regressions (columns 5–8) it follows that countries with poor economic freedom tend to be less stable in their performance (smaller coefficient of the medals won during the previous games) and are exposed to significant negative impact, whereas countries with better economic freedom tend to be more stable in their performance and are less exposed to negative impacts of inequality. Although these results are in line with our argument regarding economic freedom, further controls are necessary. Since Olympic performance is persistent, controlling for the number of medals per million during the previous Olympics seems intuitive: this variable has a positive significant effect. However, results from the previous games may correlate with some of the explanatory variables and therefore we report the estimations with and without this variable.
Table 2. OLS and threshold regressions of the determinants of Olympic performance, controlling for previous results
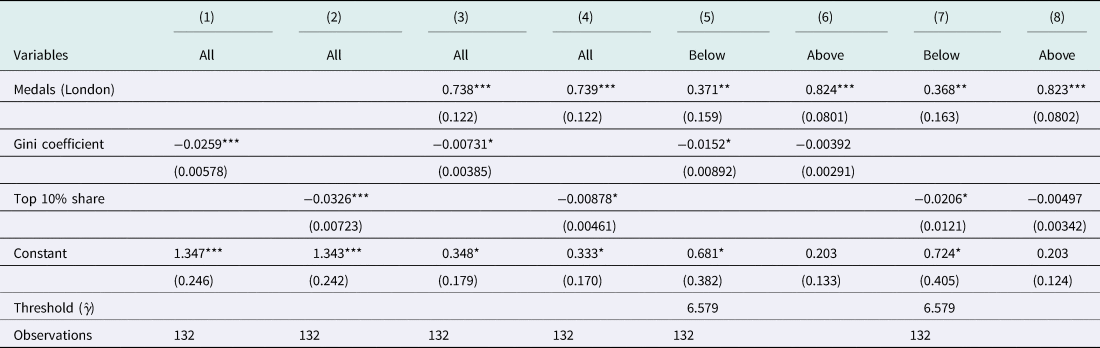
Robust standard errors in parentheses.
***p < 0.01, **p < 0.05, *p < 0.1.
The results for model 1 with further controls are presented in Tables 3 and 4. It follows that below the estimated economic freedom threshold $( \hat{\gamma })$ inequality has a detrimental impact on the performance of athletes, even after controlling for multiple other factors. Figure 1 helps to visualize the relationship between the medals and the inequality levels for countries with economic freedom below the threshold. The effect of inequality is −0.0205 per each point increase in the Gini index and −0.0190 per each percentage increase in the top 10% share of income (Table 3). After controlling for the results during the previous Olympic Games, the effects become more moderate with coefficients of −0.0135 for the Gini index and −0.0117 for the top 10% share of income. Countries above the institutional threshold do not exhibit a significant relationship between inequality and the number of medals, with the exception of the share of top 10% (see Table 4) whose impact is positive with a weak significance level. Government expenditures on health have a positive significant effect for the countries with low economic freedom only without controlling for previous results (Table 3). Another effect worth noting is the significant role of military expenditures for the number of medals for countries with more pronounced economic freedom, which is observed only for the specification with top 10% (Table 4). Per capita income has a significant positive effect on performance in sports for countries with weak economic freedom. After controlling for the results of the previous Olympic Games, this effect becomes weaker, but remains significant. For both specifications the institutional threshold $( \hat{\gamma })$
 is estimated with 50 bootstrapping rounds.Footnote 13

Figure 1. Relationship between the Olympic performance and inequality if economic freedom is below the threshold.
Table 3. Threshold regression based on economic freedom

Controlled for regions (sub-Saharan Africa, East Asia, Latin America and Europe).
Robust standard errors in parentheses.
***p < 0.01, **p < 0.05, *p < 0.1.
Table 4. Threshold regression based on economic freedom, controlling for previous results

Controlled for regions (sub-Saharan Africa, East Asia, Latin America and Europe).
Robust standard errors in parentheses.
***p < 0.01, **p < 0.05, *p < 0.1.
Although the estimation based on institutional thresholds provides empirical findings about the heterogeneous impact of income inequality on performance in sports, where economic freedom is divided into regimes, the estimations based on a hurdle model (see Tables 5–8) allow us to assess the continuous impact of economic freedom on the probability of winning at least one medal (columns 19, 23, 27 and 31) and on the number of medals (columns 17, 21, 25 and 29). The persistence, or the path dependence, in the probability of winning medals, as well as the persistence in the number of those, is still one of the strongest effects. We report AMEs for both non-linear regressions. It follows that a one-point increase in the Gini coefficient is associated with a decrease in probability of winning at least one medal by 1.51% and a decrease in the number of medals per million population by 0.0227. Controlling for the previous Olympic Games results does not substantially change the results. Economic freedom is statistically significant for the number of medals, but it does not govern the probability of winning at least one medal. A one-point increase in the economic freedom index yields a 0.475-point increase in medals per million population and a 0.354-point increase after controlling for the previous achievements. Saving rate was significant only in the equation for the probability. A one-point increase in the saving rate is associated with a 0.903% increase in the probability of winning at least one medal and a 1.16% increase after controlling for the previous achievements. The shares of public spending on health and military turned out to be significant predictors only for the number of medals. The military spending was significant only in the specification with the previous achievements. One of the most crucial controls for the logit regression is the share of athletes among all participating athletes – it follows that inequality is still a robust predictor of the probability of winning at least one medal even after controlling for the given effect. Similar results are obtained for the specification with the share of top 10%. In Table 7, a one-point increase in the income share of top 10% is associated with a decrease in the probability of winning at least one medal by 2.2%. However, the effect with respect to the number of medals is not significant. In Table 8, the income share of top 10% is significant for the probability of winning at least one medal and for the number of medals: the effects are −2.65% for the probability and −0.327 for the number of medals. From the threshold analysis and from the hurdle models it follows that inequality is a robust determinant of the performance during the Olympic Games and the effects have substantial magnitudes. However, economic freedom appears to be a mitigating force.
Table 5. Hurdle model with Gini

Controlled for regions (sub-Saharan Africa, East Asia, Latin America and Europe).
Robust standard errors in parentheses.
***p < 0.01, **p < 0.05, *p < 0.1.
Table 6. Hurdle model with Gini, controlling for previous results

Controlled for regions (sub-Saharan Africa, East Asia, Latin America and Europe).
Robust standard errors in parentheses.
***p < 0.01, **p < 0.05, *p < 0.1.
Table 7. Hurdle model with top 10% income share

Controlled for regions (sub-Saharan Africa, East Asia, Latin America and Europe).
Robust standard errors in parentheses.
***p < 0.01, **p < 0.05, *p < 0.1.
Table 8. Hurdle model with top 10% income share, controlling for previous results

Controlled for regions (sub-Saharan Africa, East Asia, Latin America and Europe).
Robust standard errors in parentheses.
***p < 0.01, **p < 0.05, *p < 0.1.
It follows that the countries with low inequality and high economic freedom are the true champions in terms of medal counts. Surprisingly, these are not only the OECD countries but also smaller developing countries such as Armenia, Mongolia and Slovenia. These three countries exhibit economic freedom levels very close to some OECD countries such as Denmark, Sweden and Australia. In fact, Armenia actually outranked Sweden (in 29th position vs Sweden in 33rd). Similarly, high inequality accompanied by low economic freedom is associated with relatively poor Olympic performance in terms of per capita medals for Argentina, Brazil and Cote D'Ivoire. The three countries stand at the 151st, 128th and 132nd positions in the economic freedom ranking. Moreover, the distance in ranks is reflected by a strong distance in points of economic freedom. For example, at 5.40 out of 10, Argentina is more than 1.5 standard deviations below the global average for economic freedom and 2.5 standard deviations below Sweden. The names of the top and bottom performers in this constellation of variables may change, yet the intuitive relationship between economic freedom, inequality and sports holds.
4.2 Robustness check for population size
To provide robustness checks, we changed our strategy in two ways. This responds to one potential criticism regarding our choice of dependent variable. Our selection of the number of medals relative to population meant that we implicitly assumed that, all else being equal, larger countries win the same number of medals per person as smaller countries. Normally, we would have preferred to control for population size but this would also be problematic as population would be included in both the dependent and independent variables.
As we indicated above, we included each country's share of athletes to partially capture the effect of a country's size. However, this is far from sufficient. In order to properly assess whether our results are robust to the size of populations, we altered our econometric specification. We switch to the use of the raw number of medals and run a zero-inflated negative binomial count model which explains both the count and the probability of winning at least one medal. By removing population from the left-hand side of our econometric specification, this setup allows us to introduce population (and its square) as an independent variable. In online Tables A1 and A2, we replicate the results from Tables 5 and 7 that showed the hurdle models. We find the same pattern of results. Both measures of inequality affect the number of medals won as well as the likelihood of winning a medal. Economic freedom also exhibits the same pattern as it provides statistically significant effects that mitigate those of inequality. The same pattern of statistical significance is observed for the other control variables.
Interestingly, the effect of population in online Tables A1 and A2 are only observed for the odds of winning medals. The effects are thus not consistently important. However, we do not find this surprising. Consider simply that seven of the 10 largest countries in the world exhibit economic freedom values inferior to the world average.Footnote 14 The effects that we found above suggest that countries with more of economic freedom enjoy important gains in the efficiency of winning medals.Footnote 15 To see if this is the case, we tested the effect of excluding the largest countries and largest medal winners from the regressions in Tables 5 and 7 but keeping the medals to population as the dependent variable. This removes the large variations in population that could affect our estimators of the determinants of medals to population. We find the same pattern of results as above but economic freedom yields stronger coefficients than before. To keep the paper brief, however, we provide these results in the online appendix.Footnote 16 This confirms the importance of economic freedom in mitigating inequality because it increases the returns to athletes (and their teams) from investing in Olympic performance.
5. Conclusions
In line with a long research tradition that uses microcosms to illustrate the channels through which inequality affects socio-economics outcomes, we used Olympic performance to study the impact of inequality conditional on institutional quality. The advantage of the Olympics as a microcosm is that inequality hinders the ability of the innately talented at the bottom of the distribution to undergo costly training. On the other hand, the gains from winning medals create incentives to invest in training which offsets inequality's downsides. The potency of this offset hinges on how easily these gains can be appropriated by athletes. As this appropriation of gains speaks to property rights, mitigation depends entirely on the quality of institutions.
Using the EFW index as our proxy for institutional quality and the Rio de Janeiro 2016 Olympics data as our outcome variable, we test our claim. As the main limitation of our study is that we cannot break down the data by discipline to account for the cost of training in each discipline, we rely on the total count of medals relative to population and attempt to control indirectly for training costs. Nevertheless, we find that the effects of inequality on Olympic performance are statistically significant only in cases where institutions are below a certain threshold of quality. Using threshold regressions, we show that countries above that threshold (those with more economic freedom) were unaffected by the level of income inequality. The negative effect of inequality on Olympic performance is found for countries below the economic freedom threshold. These results hold regardless of the measure of inequality used and is robust to controlling for the achievements during the previous games. Applying the hurdle model to account for the large number of zeros in the sample confirms the negative effect of inequality and the positive role of economic freedom with respect of Olympic outcomes.
We argue that these results from this microcosm matter to debates on inequality for two reasons. First, inequality may be hurtful to outcomes if certain key conditions are met, as Welch (Reference Welch1999: 2) pointed out when he stated that ‘inequality is destructive whenever the low-wage citizenry views society as unfair, when it views effort as not worthwhile, when upward mobility is viewed as impossible or as so unlikely that its pursuit is not worthwhile’. Second, these key conditions are intimately linked to institutions which means that inequality is but a channel through which poor institutions generate bad outcomes.
Acknowledgements
Vadim Kufenko gratefully acknowledges the support provided by the Faculty of Business, Economics, and Social Sciences at the University of Hohenheim within the research area ‘Inequality and Economic Policy Analysis (INEPA)’. We wish to acknowledge the helpful comments of Klaus Prettner, Andrew Young, Art Carden, Leshui He and Rosolino Candela.


 Open access