


Introduction
Zirconium oxide (ZrO2) is an attractive material in many applications, like ceramics production and optical devices, because of its excellent thermal, mechanical, optical, electrical, and catalytic properties [Reference Lu, Zang, Shan, Huang and Wang1, Reference Luo, Liang and Li2, Reference Nawrocki, Rigney, McCormick and Carr3, Reference Asakura, Aoki and Iwasawa4]. ZrO2 has three crystalline structures: monoclinic (below 1170 °C), tetragonal (1170–2370 °C), and cubic (above 2370 °C) [Reference Luo, Liang and Li2]. The monoclinic phase remains stable at room temperature, and the monoclinic-to-tetragonal and tetragonal-to-cubic phase transitions may occur at about 1200 °C and 2375 °C, respectively [Reference Molodetsky, Navrotsky, Paskowitz, Leppert and Risbud5]. The density of ZrO2 also varies with different crystalline structures, i.e., 5.89, 6.16, and 6.27 g/cm3 for monoclinic, tetragonal, and cubic phases, respectively [Reference Nawrocki, Rigney, McCormick and Carr3].
To date, ZrO2 thin films have already been prepared by conventional physical vapor deposition (PVD) and chemical vapor deposition (CVD). A PVD process, such as laser pulse ablation [Reference Reiße, Keiper, Weißmantel, Johansen, Scholz and Martini6] and sputtering [Reference Jonsson, Niklasson and Veszelei7], enables to control planar film growth. However, they are unable to produce conformal films and also cannot precisely control the thickness of the deposited films. A CVD process typically needs high temperature (>800 °C) and can generate uniform and high-quality films. However, CVD is also not skilled at producing conformal films. Previously, ZrO2 films have been synthesized via CVD processes using various precursors, such as chloride precursor [Reference Tauber, Dumbri and Caffrey8], alkoxide precursors [Reference Jeon, White and Kwong9], and β-diketonate precursors [Reference Balog, Schieber, Patai and Michman10, Reference Balog, Schieber, Michman and Patai11, Reference Balog, Schieber, Michman and Patai12]. Compared with PVD and CVD processes, atomic layer deposition (ALD) is an alternative technique enabling excellent uniform and conformal films over any shaped substrates at low temperatures, featuring its film controllability at the atomic level [Reference George13, Reference Puurunen14, Reference Meng, Yang and Sun15]. Owing to the many applications of ZrO2, it has been developed via some ALD processes. There were Zr[OC(CH3)3]4 [Reference Kukli, Ritala and Leskelä16], ZrI4 [Reference Kukli, Forsgren, Aarik, Uustare, Aidla, Niskanen, Ritala, Leskelä and Hårsta17], and ZrCl4 [Reference Kukli, Kemell, Köykkä, Mizohata, Vehkamäki, Ritala and Leskelä18, Reference Tamm, Kozlova, Arroval, Aarik, Ritslaid, García, Castán, Dueñas, Kukli and Aarik19] studied as Zr precursors. In these studies, H2O was widely used as the oxygen precursor. Precursors take a critical role in determining the resultant ZrO2 films such as growth per cycle (GPC), crystallinity, and temperature range for deposition. Each precursor has advantages and disadvantages. For example, ZrCl4 is a typical Zr precursor and it has a high thermal stability (∼500 °C) [Reference Cassir, Goubin, Bernay, Vernoux and Lincot20], but it suffers from low volatility and needs high evaporation temperature (165 °C) for ALD processes [Reference Nam and Rhee21]. In addition, there is HCl generated as the byproduct during ALD processes using ZrCl4 and H2O, posing risk of corrosion [Reference Nam and Rhee21] and degradation of the film quality [Reference An, Kim, Kang, Oh, Hahm, Lee, Park and Yun22]. Among all the Zr precursors investigated so far, tetrakis(dimethylamido)zirconium(IV) [Zr(NMe2)4 or TDMA-Zr] has shown some benefits over ZrCl4, including high volatility, good thermal stability, and high reactivity to surface ligands (e.g., –OH) [Reference Hausmann, Kim, Becker and Gordon23, Reference Hausmann and Gordon24, Reference Becker, Kim and Gordon25]. Liu et al. deposited ZrO2 thin films using TDMA-Zr and H2O for depositing ZrO2 films on nitrogen-doped carbon nanotubes (N-CNTs) [Reference Liu, Meng, Banis, Cai, Li and Sun26] and graphene nanosheets (GNS) [Reference Liu, Meng, Hu, Geng, Banis, Cai, Li and Sun27]. The processes in both studies are based on the following two half reactions, as proposed by Hausmann [Reference Hausmann, Kim, Becker and Gordon23]:
 $$\scale 90%{├{\rm{OH}} + {\rm{Zr}}{\left( {{\rm{NM}}{{\rm{e}}_2}} \right)_4}\left( {\rm{g}} \right) \to ├{\rm{O}}–{\rm{Zr}}{\left( {{\rm{NM}}{{\rm{e}}_2}} \right)_3} + {\rm{HNM}}{{\rm{e}}_{\rm{2}}}\left( {\rm{g}} \right)\quad ,$$
 $$\eqalign{\scale 89%{├{\rm{O}}–{\rm{Ze}}{\left( {{\rm{NM}}{{\rm{e}}_2}} \right)_3} + 3{{\rm{H}}_{\rm{2}}}{\rm{O}}\left( {\rm{g}} \right) \to ├{\rm{O}}–{\rm{Zr}}–{\left( {{\rm{OH}}} \right)_{\rm{3}}} +\cr {\rm{3HNM}}_{{\rm{E}}{\rm{2}}}\left( {\rm{g}} \right)\quad ,$$
where “├” denotes the substrate surface and “(g)” refers to a gaseous phase. The results showed that uniform and conformal films can be developed at temperature as low as 100 °C, and the GPC and crystallinity of ZrO2 thin film experienced a strong dependence on the deposition temperatures. However, the surface reactions between the precursors were not fully discussed, which are essential for a better understanding of the ALD process of ZrO2.
Stimulated by the tremendous capability for uniform and conformal coatings at low temperature and aimed at further exploring the ALD process using TDMA-Zr and H2O as precursors, we recently conducted a systematic study, featuring the utilization of an in situ quartz crystal microbalance (QCM) in a wide temperature range of 50–275 °C. The ALD process was further applied on nitrogen-doped graphene nanosheets (N-GNS) and N-CNTs for investigating film evolution with temperatures and ALD cycles. In addition, the wettability of ZrO2 films was investigated for different film thicknesses and different deposition temperatures.
Results and discussion
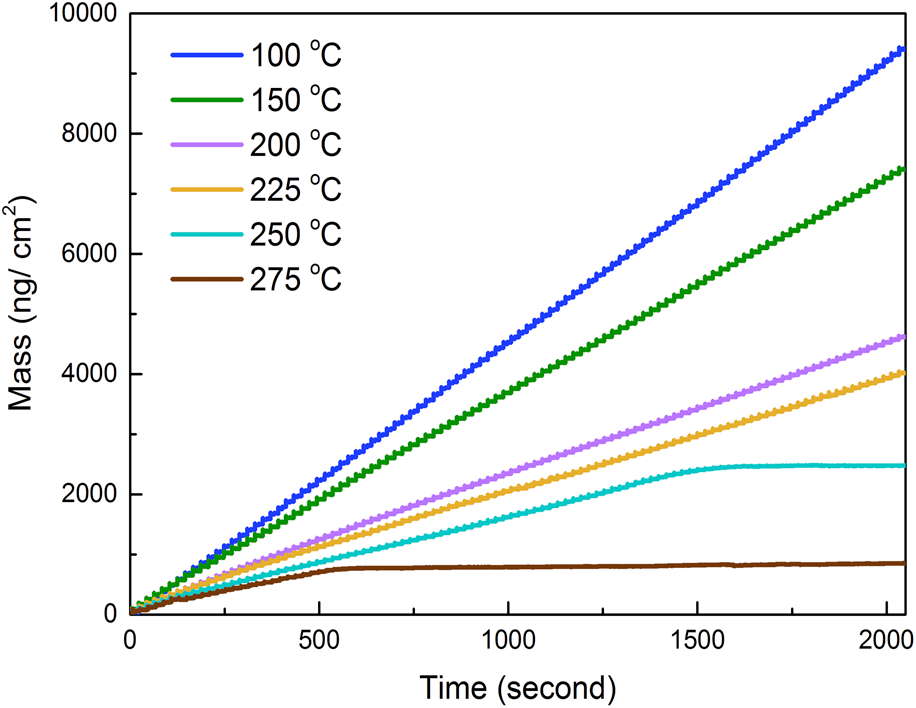
We first conducted a series of studies to optimize ALD dosing and purging parameters at 100 °C, as shown in Figs. 1(a) and 1(b). With the fixed dosing time of TDMA-Zr (0.03 s) and purging time (10 s), the dosing time of H2O was increased from 0 to 0.025 s, and it was observed that the mass gain would maintain the same value as the dosing time of H2O reached 0.005 s or longer [Fig. 1(a)], which indicated the saturation growth of ZrO2; thus, we selected a value of 0.015 s for the dosing time of H2O. Similarly, we selected the optimal dosing time of TDMA-Zr as 0.03 s [Fig. 1(b)]. In addition, in situ QCM measurements were conducted to investigate the growth of ALD-ZrO2 at various deposition temperatures. Figs. 1(c) and 1(d) illustrate the time-resolved mass changes measured by in situ QCM during 100 ALD cycles using TDMA-Zr and H2O as precursors between 50 and 275 °C. Prior to the ZrO2 ALD, an ALD Al2O3 film was deposited on the QCM crystal surface alternately using TMA and H2O as precursors with a timing sequence of 0.015–5–0.015–5 s to establish an uniform starting surface. During the deposition process, the ALD ZrO2 GPC gradually decreased and stabilized to a constant value after the first ∼20 cycles (0–400 s), and the larger GPC in the first 20 cycles were due to the effect of the predeposited Al2O3 film. In addition, the mass gain per cycle in the stable regime changes with temperatures, which decreased almost linearly from 100.28 ng/cm2 at 50 °C to 40.66 ng/cm2 at 225 °C. However, no mass gain can be observed after certain cycles at 250 and 275 °C. This might be related to the precursor decomposition of TDMA-Zr and the exactly underlying reason will be investigated in future studies.

Figure 1: Optimization of the dosing time of precursors at 100 °C: (a) the effect of dosing time of H2O on the mass gain, (b) the effect of dosing time of TDMA-Zr on the mass gain. In situ QCM measurements of ALD ZrO2 with 100 cycles: (c) using the timing sequence of 0.03–30–0.015–30 s at 50 and 75 °C, (d) using the timing sequence of 0.03–10–0.015–10 s in the range of 100–275 °C.
Fig. 2(a) demonstrates the thickness variation of ZrO2 films during 100 ALD cycles from 50 to 275 °C. Supposed that the deposited films are crystalline, having a density of 6.16 g/cm3, we then could calculate the thickness using the QCM data (ng/cm2). As shown in Fig. 2(a), the thickness of ZrO2 films increases almost as a straight line within 100 cycles at temperatures lower than 225 °C, indicating that at each temperature the GPC is constant. However, the thickness of ZrO2 films at 250 and 275 °C remains unchanged after 80 and 20 cycles, respectively, which means the growth of the films terminated. It was reported that the maximum ALD temperature of TDMA-Zr is 250 °C [Reference Hausmann, Kim, Becker and Gordon23]. Therefore, decomposition of TDMA-Zr might be responsible to the growth cessation at the high temperatures of 250 and 275 °C. The GPC of ALD-ZrO2 changes with temperature, as shown in Fig. 2(b). The GPC is calculated to be 1.81, 1.84, 1.60, 1.21, 0.67, and 0.66 Å/cycle at the deposition temperatures of 50, 75, 100, 150, 200, and 225 °C, respectively. At low temperatures (i.e., 50 and 75 °C), the GPCs are comparable and then significantly decreases with the increasing temperatures. The underlying reasons will be discussed later.

Figure 2: In situ QCM measurements of ALD ZrO2 at various temperatures using the timing sequence of 0.03–30–0.015–30 s at 50 and 75 °C, and 0.03–10–0.015–10 s in the range of 100–275 °C: (a) The thicknesses of ZrO2 film versus ALD cycle number during 100 ALD cycles and (b) the GPCs of ZrO2 films versus temperature.
Fig. 3 shows an enlarged view of consecutive ZrO2 ALD cycles in the stable growth regime. Inspired by our previous ALD studies [Reference Meng, Libera, Fister, Zhou, Hedlund, Fenter and Elam28, Reference Meng, Cao, Libera and Elam29, Reference Cai, Ma, Wejinya, Zou, Liu, Zhou and Meng30], the two half reactions can be rewritten as follow:
 $$╟{\left( {{\rm{OH}}} \right)_x} + {\rm{Zr}}{\left( {{\rm{NM}}{{\rm{e}}_{\rm{2}}}} \right)_{\rm{4}}}\left( {\rm{g}} \right) \to ╟{{\rm{O}}_x}–{\rm{Zr}}{\left( {{\rm{NM}}{{\rm{e}}_{\rm{2}}}} \right)_{{\rm{(4}} - x)}} + x{\rm{H}}\left( {{\rm{NM}}{{\rm{e}}_{\rm{2}}}} \right)\left( {\rm{g}} \right)\quad ,$$
 $$╟{{\rm{O}}_x}–{\rm{Zr}}{\left( {{\rm{NM}}{{\rm{e}}_{\rm{2}}}} \right)_{(4 - x)}} + 2{{\rm{H}}_{\rm{2}}}{\rm{O}}\left( {\rm{g}} \right) \to ╟{{\rm{O}}_2}–{\rm{Zr}}–{\left( {{\rm{OH}}} \right)_x} + \left( {4 - x} \right){\rm{H}}\left( {{\rm{NM}}{{\rm{e}}_{\rm{2}}}} \right)\left( {\rm{g}} \right)\quad ,$$
where x is between 0 and 4, indicating the number of reactive surface (–OH) groups. In Eq. (2A), TDMA-Zr reacts with x –OH while liberating x of (–NMe2) into gaseous C2H7N, and the surface mass gain can be expressed as m 1 = 267 − 45x. In Eq. (2B), H2O reacts with (4 − x) (–NMe2) surface ligands which are then replaced by x –OH groups, and the surface mass gain can be expressed as m 2 = 45x − 144. Thus, the total mass gain for one ZrO2 ALD cycle is the sum of the mass gain in the two equations, i.e., Δm = m 1 + m 2 = 123, which is exactly the molar mass of ZrO2. These equations assume that the –OH groups are the reactive species for the chemisorption of Zr precursor. Considering the mass gain m 1 in Eq. (2A) and the total mass gain Δm, we can combine them in Eq. (3):
 $$R = {{\Delta m} / {{m_1} = {{123} / {\left( {267 - 45x} \right)}}}}$$
where the ratio R reveals the number x of surface (–OH) groups reacting with each TDMA-Zr molecule. For instance, at 75 °C, R = 1.34, so that x = 3.9, implying that 3.9/4.0 (or ∼97.5%) of the (–NMe2) ligands are released as gaseous C2H7N, leaving only ∼2.5% on ZrOx surface following TDMA-Zr reaction [Eq. (2A)]. The R and x values decrease with increasing temperatures from 75 to 275 °C, which means that a greater fraction of the (–NMe2) ligands from the same TDMA-Zr were chemisorbed on the surface or, conversely, that the coverage of the surface (–OH) groups was lower at the higher temperatures, either due to the desorption of TDMA-Zr or the dehydration of –OH sites. The variation of x with deposition temperature is illustrated in Fig. 3. It can be seen that R and x values of ALD ZrO2 at 50 °C are lower than that at 75 °C (Fig. 4). The abnormal behavior may originate from the low value of m 2, i.e., the low mass gain after H2O dosing, as shown in Fig. 3(a), which may be due to the low reactivity of H2O or the physical absorption of H2O on many reactive sites at 50 °C, resulting in a lower GPC than that of 75 °C.

Figure 3: Enlarged view of consecutive ALD cycles of ZrO2 deposition in the regime of steady-state growth at (a) 50, (b) 75, (c) 100, (d) 150, (e) 200, (f) 225, (g) 250, and (h) 275 °C (m 1, m 2, and Δm are illustrated in the text).

Figure 4: The number x (0 ≤ x ≤ 4) of surface (–OH) groups reacting with TDMA-Zr at different temperatures.
To verify the GPC of ZrO2 at different temperatures, ZrO2 films were deposited on N-GNS at 75, 150, and 250 °C with various numbers of ALD cycles, and the ZrO2–N-GNS composites were characterized by scanning electron microscopy (SEM) (Fig. 5). Low-magnification SEM images were inset in Figs. 5(a)–5(i), which indicated that ZrO2 thin films were uniformly deposited onto the N-GNS. At 75 °C, the graphene wrinkles were coated by ZrO2 with 100, 200, and 300 ALD cycles [see Figs. 5(a)–5(c)]. It can be seen that the ZrO2 coatings are very conformal. After 100 ALD cycles, the thickness of the coated N-GNS is measured to be 40 ± 0.5 nm. With the increasing ALD cycles, the coatings become thicker, i.e., the thickness rises to 77 ± 0.5 nm, 115 ± 0.5 nm after 200 and 300 cycles, respectively. Furthermore, in our previous study [Reference Cai, Ma, Wejinya, Zou, Liu, Zhou and Meng30], the pristine N-GNS was measured to be ∼3 nm in thickness; therefore, the GPCs of the ALD-ZrO2 were calculated as 1.9 Å/cycle at 75 °C, which is a little bit higher but very close to that of QCM data. The calculation is based on the following equation: GPC = (wrinkle thickness of coated N-GNS—wrinkle thickness of pristine N-NGS)/(2 × cycle numbers) [Reference Meng, Geng, Liu, Li and Sun31]. The growth of ALD-ZrO2 on N-GNS with different cycles at 150 °C exhibits the similar trend as that at 75 °C, as shown in Figs. 5(d)–5(f), and the GPC is calculated as ∼1.3 Å/cycle. To confirm the terminating growth of ALD-ZrO2 after 80 cycles at 250 °C, the coating was also performed for 25, 75, and 100 cycles, as shown in Figs. 5(g)–5(i). From the thickness variation of coated N-GNS with 25 and 75 cycles, the GPC is estimated as ∼0.5 Å/cycle. Compared with that of 75 cycles, however, the coated N-GNS of 100 cycles almost maintains the same thickness. This corroborates the QCM data, indicating that the growth of ALD-ZrO2 indeed terminated after 80 cycles at 250 °C.

Figure 5: SEM images of ZrO2–N-GNS composites prepared at (a, b, c) 75 °C (d, e, f) 150 °C, and (g, h, i) 250 °C with (a, d) 100 ALD cycles (b, e) 200 ALD cycles, (c, f) 300 ALD cycles, (g) 25 ALD cycles, (h) 75 ALD cycles, and (i) 100 ALD cycles.
Atomic force microscope (AFM) images of ZrO2 coating on glass substrate are shown in Fig. 6. According to the QCM results, the GPCs are ∼1.8, 1.2, and 0.7 Å/cycle at 50, 150, and 225 °C, respectively. To facilitate the comparison of films with a similar thickness, we deposited ZrO2 films for 10 cycles at 50 °C, 15 cycles at 150 °C, and 25 cycles at 225 °C, having a similar thickness of ∼1.8 nm. We also deposited films for 300 cycles at 50 °C, 400 cycles at 150 °C, and 700 cycles at 225 °C, having a comparable thickness of ∼50 nm. It was observed that deposition temperature and film thickness have some remarkable effects on the film topography. At each temperature, high ALD cycles (e.g., ∼50 nm-thick films) resulted in more uniform films. In the cases of ∼1.8 nm-thick films, the 10-cycle film at 50 °C might not have fully covered the substrate. Interestingly, the 15-cycle film deposited at 150 °C showed many nanorod-like structures, while the 25-cycle film deposited at 250 °C showed a more uniform structure. The nanorod-like structure might be related to phase transition, i.e., the existence of sparse nanoparticles before the full formation of nanofilms, which can be observed in others’ ALD studies [Reference Liu, Meng, Banis, Cai, Li and Sun26, Reference Liu, Meng, Hu, Geng, Banis, Cai, Li and Sun27, Reference Meng, Geng, Liu, Li and Sun31, Reference Meng, Zhang, Sun, Li and Sun32, Reference Meng, Zhong, Sun, Norouzi Banis, Li and Sun33]. One can also find that at each temperature, the thicker coating generally has a higher roughness than the thin one.

Figure 6: AFM images of ALD ZrO2 films deposited on glass substrates with (a) 10 cycles at 50 °C, (b) 15 cycles at 150 °C, and (c) 25 cycles at 225 °C, (d) 300 cycles at 50 °C, (e) 400 cycles at 150 °C, and (f) 700 cycles at 225 °C. The average roughness is also presented in each figure. The scanned area is 5 × 5 µm.
We further clarified the crystallinity of ZrO2 films with deposition temperature using synchrotron-based X-ray diffraction (XRD). ZrO2 films were deposited on N-CNTs for 100 ALD cycle at 75, 100, 150, 200, and 250 °C. The XRD patterns of the pristine N-CNTs and the resultant ZrO2–N-CNTs composites are shown in Fig. 7. It can be seen that all samples at these temperatures exhibit three peaks at 30°, 50°, and 62°, which are indexed as (002), (100), and (004) planes of graphite, respectively (JCPDS PDF No. 08-0415). For the ZrO2-CNTs prepared at 150, 200, 250 °C, the peaks located at 36° correspond well to the plane (101) of tetragonal ZrO2 (JCPDS PDF No. 50-1089). This is consistent to Liu’s work [Reference Liu, Meng, Banis, Cai, Li and Sun26]. Because the deposited ZrO2 films were pretty thin, other XRD peaks of ZrO2 are not identifiable. At low deposition temperatures of 75 and 100 °C, the (101) peak becomes much broader. This implies the amorphous structure of ZrO2.

Figure 7: XRD patterns of (a) the pristine N-CNTs, and ZrO2-coated N-CNTs with 100 ALD cycles prepared at (b) 75, (c) 100, (d) 150, (e) 200, and (f) 250 °C.
The tetragonal ZrO2 typically exists at high temperature (1170–2370 °C) [Reference Luo, Liang and Li2], whereas in our study, this phase was not only prepared between 150 and 250 °C but also was stable at room temperature. The existence of tetragonal ZrO2 at low temperatures was found in previous reports [Reference Garvie34, Reference Ferrari, Dekadjevi, Spiga, Tallarida, Wiemer and Fanciulli35, Reference Pitcher, Ushakov, Navrotsky, Woodfield, Li, Boerio-Goates and Tissue36, Reference Chen, Mashimo, Omurzak, Okudera, Iwamoto and Yoshiasa37]. As pointed out in previous studies, this phenomenon may be related to the grain size. Small ZrO2 size and high specific surface area might have provided sufficient surface energy to stabilize the metastable tetragonal phase at low temperatures.
Furthermore, we investigated water contact angles of ZrO2 films, as shown in Fig. 8. As we can see, all the water contact angles of the samples are larger than 90° regardless of the thickness and deposition temperatures, indicating that the ZrO2 thin films are hydrophobic. For the same thickness of ZrO2 thin films, the water contact angles decreased with the increasing temperatures. In other words, the ZrO2 thin films are more hydrophobic at lower temperatures. At each temperature, the thicker films would result in larger water contact angles, that is, the thicker films are more hydrophobic than the thinner ones at 50, 150, and 225 °C. The surface wettability is related to surface microstructures and surface functional groups [Reference Hyde, Scarel, Spagnola, Peng, Lee, Gong, Roberts, Roth, Hanson, Devine, Stewart, Hojo, Na, Jur and Parsons38, Reference Lee, Jur, Kim and Parsons39].

Figure 8: Water contact angles of ZrO2 films deposited with various ALD cycles at different temperatures.
Conclusions
In this work, we systematically studied the growth characteristics of ALD ZrO2 using TDMA-Zr and H2O as precursors. The study confirmed that there has a phase evolution for ALD ZrO2 films with temperature, changing from an amorphous phase at temperatures lower than 100 °C to a crystalline phase at temperatures higher than 150 °C. At the same time, it was found that the GPCs of ALD ZrO2 films are dependent to deposition temperatures. The GPC could be precisely controlled at the atomic level for various growth temperatures, changing from ∼1.8 at 50 °C to 0.7 Å/cycle at 225 °C. Furthermore, it was found that the deposited ZrO2 films showed a hydrophobic nature.
Experimental section
QCM of ZrO2
In situ QCM can be used to track the mass variation of deposited ZrO2 films. The measurements were conducted at 50, 75, 100, 150, 200, 225, 250, and 275 °C using TDMA-Zr and H2O as precursors in an ALD reactor (Savannah 200, Cambridge Nanotech Inc., Cambridge, MA). 6 MHz quartz crystals (#750-1059-G10, Inficon, East Syracuse, NY) were used. Prior to the QCM measurements at each deposition temperature, 50-cycle ALD of Al2O3 was performed using trimethylaluminum (Al(CH3)3 or TMA) and H2O as precursors to maintain a consistent starting surface. Prior to ALD deposition, TDMA-Zr was heated to 75 °C for supplying sufficient precursor vapor, whereas H2O was kept at room temperature. The delivery pipelines and valve manifold were kept at 90 °C to prevent the condensation of Zr precursor, and the exhaust pipelines was heated to 150 °C for removing any excessive precursor vapors and other by-products. High purity Argon (Ar) gas was used as the carrier gas with a flow rate of 20 sccm, and the ALD reactor was kept at a low-level base pressure of 0.3–0.4 torr by a vacuum pump (Pascal 2021C2, Adixen, Jefferson Hills, PA). One ALD cycle was performed with four steps in the temperature range of 100–275 °C: (i) a 0.03-s dose of Zr(NMe2)4, (ii) a 10-s purge of Ar gas to remove excessive Zr(NMe2)4 and by-products, (iii) a 0.015 s dose of H2O, and (iv) a 10-s purge of Ar gas to remove excessive H2O and by-products. At low temperatures of 50 and 75 °C, the purging time was increased to 30 s to fully purge the ALD system while the dosing times were kept as the same.
Preparation and characterization of ZrO2 films
ZrO2 films were deposited on N-CNTs, N-GNS, and glass substrates for characterization. Synchrotron-based XRD was performed to characterize the crystallinity of the ZrO2–N-CNTs composites, prepared at 75, 100, 150, 200, and 250 °C. The XRD measurements were conducted using an X-ray wavelength of 0.4336 Å at the beamline 13 BM-C of the Advanced Photon Source (APS) at Argonne National Laboratory (ANL; Illinois). Scanning electron microscopy (SEM) (XL30, Philips FEI, Hillsboro, OR) was used to characterize the thickness changes of ZrO2-coated N-GNS with various ALD cycles at different temperatures. AFM (Dimension Icon, Bruker Nano Surfaces, Billerica, MA) was used to measure the roughness of the thin films. Water contact angle test was employed to determine the wettability of ZrO2 films on glass substrates via Contact Angle Measuring System (OCA 15, DataPhysics Instruments GmbH, Filderstadt, Germany).
Acknowledgment
Funding for this research was provided by the Center for Advanced Surface Engineering, under the National Science Foundation Grant No. OIA-1457888 and the Arkansas EPSCoR Program, ASSET III. Portions of this work were performed at GeoSoilEnviroCARS (the University of Chicago, Sector 13), APS, Argonne National Laboratory. GeoSoilEnviroCARS is supported by the National Science Foundation—Earth Sciences (EAR—1634415) and Department of Energy-GeoSciences (DE-FG02-94ER14466). This research used resources of the APS, a U.S. Department of Energy (DOE) Office of Science User Facility operated for the DOE Office of Science by Argonne National Laboratory under Contract No. DE-AC02-06CH11357. We appreciate the assistance provided by Professor Peter Eng (Research Professor, CARS and JFI, University of Chicago) at the University of Chicago.


