I. INTRODUCTION
Lithium niobate (LiNbO3) is a ferroelectric material with interesting nonlinear optical, electro-optic, and piezoelectric properties that allow for applications in holographic memory storage, fast optical switching, and waveguide writing.Reference Weis and Gaylord1–Reference Thomson, Campbell, Blewett, Kar and Reid4 Because of the interest in utilizing lithium niobate in optical devices, it has been studied extensively with traditional continuous-wave (CW) Raman spectroscopy for different crystal cut orientations and incident light polarizations.Reference Gorelik and Sverbil5–Reference Zhang, Guilbert, Bourson, Polgár and Fontana7 With the development of lasers capable of producing femtosecond pulses, suitably high electric field intensities and short pulse durations allowed for the possibility of making time-domain observations of coherent phonon oscillations in crystal lattices.Reference Ikegaya, Sakaibara, Minami, Katayama and Takeda8–Reference Gorelik, Zolotukhin, Moskaleva and Sushchinskiĭ10 The coherent phonon oscillation modes are Raman active, which lead to easy comparison with Raman spectra. Impulsive stimulated Raman scattering (ISRS) is a process in which a sufficiently high-energy pump pulse stimulates these vibrational modes, which are then observed by sending a lower-energy probe pulse into the excited sample at a controllable time delay after the pump pulse.Reference Dhar, Rogers and Nelson11 The pump-induced excitations in the sample can cause changes in the amount of probe pulse energy transmitted through the sample or small rotations to the polarization of the transmitted probe pulse.Reference Turchinovich, Uhd Jepsen, Monozon, Koch, Lahmann, Rossow and Hangleiter12 Both processes can lead to changes in the amount of detected probe energy. In general, multiple vibrational modes of different frequencies are excited simultaneously, causing a beating pattern in the time-resolved scans on the sub-picosecond timescale. By computing the Fourier transform of the temporal scan, one can reproduce a Raman spectrum for comparison with those found using traditional CW Raman spectroscopy. Unlike CW Raman spectroscopy, ISRS gives information on the decay times for the Raman modes.
The advent of ultrashort pulsed lasers has been essential to the advancement of waveguide writing in lithium niobate crystals. Due to the relatively high peak intensities of high-energy femtosecond laser pulses and the photorefractive properties of lithium niobate, it is possible to write three-dimensional waveguides.Reference Thomson, Campbell, Blewett, Kar and Reid4 Recent studies have investigated the photorefractive effect in lithium niobate using high-energy femtosecond laser pulses with fluences at or above the optical damage threshold of the material.Reference Beyer, Breunig, Kalkum and Buse13 Our study, however, deals with much lower fluences (∼20 μJ/cm2), which allows for the observation of Raman-active vibrational modes without permanent changes to the sample. Detailed measurements of the frequencies and corresponding lifetimes of these oscillations are needed to provide an understanding of the ultrafast transient behavior of lithium niobate, especially for applications involving femtosecond laser pulses.
Doping of lithium niobate with transition metals and other metals has been beneficial in creating holographically stored data within crystals which are less likely to be changed by illumination.Reference Volk, Pryalkin and Rubinina14,Reference Furukawa, Kitamura, Ji, Montemezzani, Zgonik, Medrano and Günter15 Although there have been studies which use the time-resolved ISRS technique on doped lithium niobate samples, there has not been a study which compares the Raman-active modes of multiple doping types with identical experimental conditions. Lattice defect sites occupied by dopant atoms create other oscillation modes not present in congruent lithium niobate (CLN) samples. The oscillation wave numbers should be consistent with previous CW Raman spectra of doped samples.Reference Mouras, Fontana, Bourson and Postnikov16 Since the doping of lithium niobate samples causes the intensity and decay time of the oscillations to change, detailed knowledge of these oscillations could lead to future improvements in holographic memory storage devices.Reference Buse, Adibi and Psaltis17 In this study, we discuss the differences in the measured Raman oscillation modes of lithium niobate samples that are doped with iron and magnesium (referred to as Fe:LN and Mg:LN, respectively). Also, we report on how doping affects the amplitude and decay time of each observed oscillation mode.
II. EXPERIMENT
We use a femtosecond pump–probe laser system to observe ISRS in various lithium niobate samples. The experimental setup is shown in Fig. 1 and is similar to the one used in previous ISRS work.Reference Taft, Newby, Hrebik, Onellion, George, Szentesi, Szatmari and Nanai18 Laser pulses are produced using a home-built self-mode-locked Ti:sapphire laser pumped with 4.25 W of output from a commercial, 532 nm, CW, solid-state laser. The bandwidth of the Ti:sapphire laser output is 25 nm full-width-at-half-maximum ranging from 790 to 815 nm. Although a broader bandwidth is possible from this laser, the narrower 25 nm bandwidth makes material dispersion compensation simpler and still enables sufficiently short pulse durations for this work. The average output power of the laser is 0.75 W with a repetition rate of 82 MHz corresponding to 9 nJ of pulse energy. A 50/50 beam splitter creates the separate pump and probe beams. Double-pass fused silica prism pairs compensate for the material dispersion of the optical components in the system. When optimized, pump and probe pulses with durations of approximately 50 fs, measured using a second-harmonic-generation frequency-resolved optical gating (SHG FROG) device,Reference Taft, Rundquist, Murnane, Kapteyn, DeLong, Trebino and Christov19 and nearly Gaussian temporal shape are incident on the samples.
FIG. 1. Diagram of pump–probe system.
Along the pump path, an acousto-optic modulator (AOM) modulates the pump beam with a frequency of 25 kHz and allows for simple control of the pump beam power, which typically is set at 40 mW. The probe beam power is controlled using a linear gradient filter. The probe power is maintained at 1 mW, which at only 2.5% of the pump power should have less effect on the sample. Both the pump and probe pulses overlap spatially and temporally at the surface of the sample. Probe pulses that interact with sample material excited by the pump pulses also become modulated at 25 kHz, allowing for lock-in amplification detection. To ensure that no pump pulse energy is detected, pump pulses are polarized orthogonal to probe pulses using a half-wave plate and a vertical polarizer. A horizontal polarizer located in front of a silicon photodiode detector only lets through the horizontally polarized probe pulses. This differs slightly from other ISRS setups in which the final polarizer transmission axis is oriented at a 45° angle to maximize detection of polarization rotation of the probe pulse. Since the polarizer transmission axis in our setup is oriented parallel to the linearly polarized probe pulses, polarization rotation cannot adequately explain the change in the detected probe pulse energy that we measure. As described below, our measurements suggest that the oscillations we observe are due to transient transmission changes and not polarization rotation.
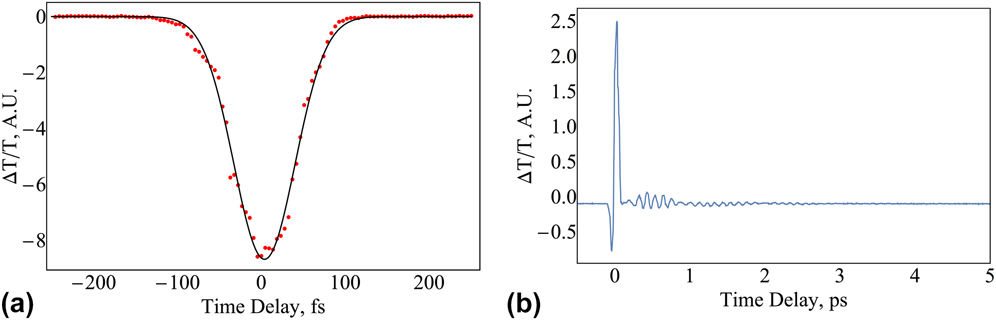
A motorized translation stage with an attached retroreflecting mirror produces a time delay between the pump and probe pulses. The motor used, a Zaber Technologies model T-LA28A (Vancouver, Canada), has a step size of 0.1 µm corresponding to a minimum time delay step size of less than 1 fs. This enables the observation of both the initial nonlinear optical excitation and the subsequent Raman oscillations in the samples. Each sample is placed on a stage composed of two orthogonal, manual, linear translation stages to control the sample’s position parallel to the optical table surface. The pump and probe pulses are incident on the sample at angles of 10° and 20°, respectively. The pump and probe beams are focused onto the sample with separate lenses (pump and probe lens focal lengths of 15 and 20 cm, respectively) with measured beam waist diameters of 60 μm and 20 μm, respectively. With this configuration, the transmitted pump beam is blocked from reaching the detector. The cross-correlation of the pump and probe pulses at the sample was measured [Fig. 2(a)] to have a full-width-at-half-maximum of 90 fs using a beta barium borate (BBO) second-harmonic-generation crystal with a thickness of 0.5 mm. This measurement was made by placing the BBO crystal at the normal sample location. The interaction between the pump and probe photons generating second harmonic light along the bisector of the two beams decreases the amount of probe light transmitted through the sample; thus, measurement of the cross-correlation shows a decrease in the transmitted probe intensity. Although the silicon photodiode detector is not sensitive to the second harmonic light, an optical filter was placed before the detector to prevent any second harmonic light from reaching the detector during the cross-correlation measurement.

FIG. 2. Experimental determination of interaction between pump and probe pulses (cross-correlation) in the sample: (a) measured cross-correlation using a second-harmonic-generation crystal and (b) full scan of transmitted probe light using a Z-cut CLN crystal showing the large nonlinear signal occurring only when the pump and probe pulses are both in the sample.
The optical-grade lithium niobate samples (both doped and undoped) purchased from MTI Corporation (Richmond, California) each have dimensions 10 × 10 × 0.5 mm. Two cut orientations (X-cut and Z-cut) of undoped lithium niobate are used in this experiment; all doped samples are Z-cut. The doping levels of the magnesium- and iron-doped samples are 5 mol% and 0.07 mol%, respectively.
In one part of this experiment, we investigate how the signal of the ISRS process is influenced by the direction of the pump pulse polarization with respect to the sample. Thus, for a Z-cut sample, measurements are taken using both X and Y polarization of the pump pulse by rotating the sample 90° about the Z-cut face. The polarizations of the pump and probe pulses always are kept orthogonal to one another to prevent the detection of any scattered pump pulse energy.
Once the sample is in place, small adjustments are made to the final mirror in the pump path to optimize the spatial overlap of the two pulses. This is aided by using a computer-interfaced camera to observe a magnified image of the scattered light from the pump and probe spots on the sample surface. Also, we make small adjustments to the spatial overlap to maximize the lock-in amplifier signal during the nonlinear excitation that occurs at zero time delay. A computer program controls the motion of the stepper motor and acquires a voltage reading from the lock-in amplifier, which receives a 25 kHz reference signal from the AOM driver (IntraAction Corp., Bellwood, Illinois). To further minimize noise, a pre-amplifier filters out signals with frequencies outside of the 10–30 kHz range.
For the measurements reported in this work, the lock-in amplifier was set to detect changes in voltage from the photodiode detector of less than 3 µV. The average signal detected from the nonlinear excitation was less than 1 µV. The measured oscillations have an average amplitude of about 0.05 µV. With the average noise of the system around 0.003 µV, the signal to noise ratio of the system is above 16 to 1. Each of the scans shown in this manuscript is the average of four sequential scans using the same sample in the same orientation. All scans have a time delay step size of 5 fs between the measured signal values. Uncertainty in the measured signal values is estimated by calculating the standard deviation of the signal values for each of the four sequential scans at each time delay.
We compute the fast Fourier transform (FFT) of the scan data to observe the coherent oscillations in the spectral domain so that we can focus on the oscillations; we exclude the first part of the scan up to a time delay of 120 fs. Before computing each FFT, the scan data with a range of 5 ps are padded with zeros for a total range of 10 ps. This decreases the FFT output spacing to 2 cm−1. Based on this and comparison of the wave numbers of the peaks in the FFTs of repeated scans, the uncertainty in the wave number of the peaks is estimated to be ±1 cm−1.
III. RESULTS
When doing a pump–probe experiment of this type, it is important to know the duration of time when the pump and probe pulses are both present in the sample simultaneously. This often is the limiting factor determining which oscillation modes are observable, since the interaction (or cross-correlation) time must be shorter than the oscillation period to produce coherent phonons in the sample. The measured cross-correlation is shown in Fig. 2(a) accompanied with a typical scan in Fig. 2(b) of the Z-cut CLN sample with X pump polarization. During the initial ∼100 fs interaction time of the pump and probe pulses in the sample, the probe light transmitted through the sample drops slightly below the equilibrium value and then increases significantly higher before returning close to the equilibrium value. With our setup, any polarization rotation of the probe beam would cause a decrease in the transmission, since the polarizer before the detector is oriented to maximize the transmission of the horizontally polarized probe light. Therefore, we rule out polarization rotation as an explanation for the increase in the transmission. Also, this initial excitation is not due to linear absorption in the lithium niobate, since the band gap energy is ∼4 eV and the pump photon energy is only ∼1.5 eV. Even two-photon absorption is unlikely for our pump pulse wavelength as shown by Byer et al.Reference Beyer, Maxein, Buse, Sturman, Hsieh and Psaltis20 Although the exact nonlinear process responsible for the initial excitation is unknown, it appears to create sufficient off-resonant excitation necessary for the ISRS technique. In our work, we focus on the oscillations in the transmitted probe light observed after the initial nonlinear excitation; therefore, the scans presented in the rest of this manuscript start ∼120 fs after the peak of the initial nonlinear excitation, enabling the oscillations to be seen more clearly.
As a verification of our experimental setup, ISRS measurements of congruent lithium tantalate (CLT) made with our system compare well with similar measurements made by Hu et al.Reference Hu, Misochko, Takahashi, Koguchi, Eda and Nakamura21 Figures 3(a) and 3(b) shows the scans and FFTs of CLT with the pump beam polarized in both the X and Y directions. Our FFT reveals Raman-active oscillation modes at wave numbers of 202, 356, 371, and 456 cm−1. Except for the large peak in the CLT FFT at 371 cm−1, the wave numbers of the peaks agree with those determined by Hu et al.Reference Hu, Misochko, Takahashi, Koguchi, Eda and Nakamura21 The 371 cm−1 peak that does not match a previously reported Raman wave number may be a polariton mode like we observed in the lithium niobate samples described below.

FIG. 3. (a) Scan data taken for Z-cut CLT with pump polarization in both the X and Y directions and (b) accompanying FFT for each of the scans.
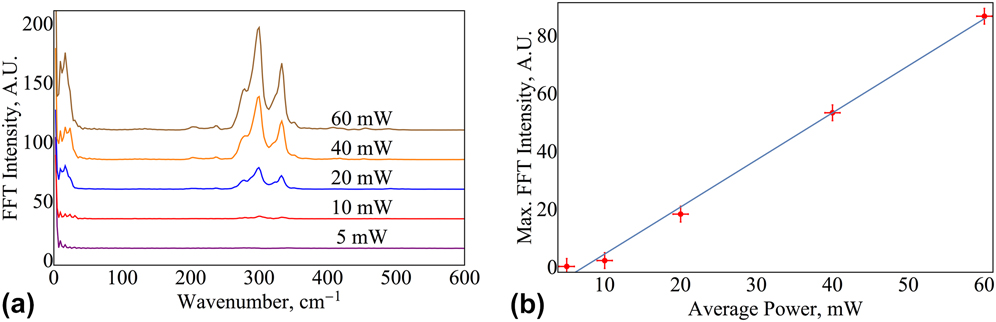
We also examined how the average power of the pump beam affects the peak intensities of the Raman-active oscillation modes. The Z-cut CLN sample was placed with the pump beam polarized in the X direction of the crystal, and the average power of the pump beam was changed between the scans. The probe power was adjusted to keep it at less than 10% of the total pump power. The results of the calculated FFTs for each scan are shown in Fig. 4(a). As expected, there is an increase in the FFT intensity with increasing average pump power. Figure 4(b) shows the maximum FFT intensity of each scan, which occurs at a wave number of ∼300 cm−1. The plot of average power versus maximum FFT intensity follows a linear relationship (fit shown in figure). In stimulated Raman scattering experiments, it is expected that the intensity of these peaks will increase linearly with respect to increasing electric field intensity.Reference Hu, Misochko, Takahashi, Koguchi, Eda and Nakamura21,Reference Sasaki, Tanaka, Okano, Minami, Kayanuma, Shikano and Nakamura22 Because our measurements confirm this linear relationship, it is likely that the observed oscillations are due to the production of coherent phonons in the lithium niobate samples and not some other phenomenon. For the remaining scans, the pump power was held constant at 40 mW.

FIG. 4. Increasing the average pump power causes a proportional change in the FFT maximum intensity. The plots show (a) FFTs of transmission scans using the Z-cut CLN with X pump polarization with varying power and (b) a linear fit of maximum FFT intensity versus average pump power.
The Z-cut CLN was rotated to determine how the pump polarization direction affects the Raman modes observed in the scans. Figure 5(a) shows the scans taken from the Z-cut CLN with 0, 45, and 90° pump polarization directions with respect to the X-axis of the sample. The accompanying FFTs of these scans are shown in Fig. 5(b). The FFTs show consistency between the 0° and 90° scans both in the intensity of the peaks and the wave numbers at which they occur. For the 45° pump polarization, however, an oscillation mode at 240 cm−1 appears that is not apparent in either of the other scans. Also, there are significant changes in the intensities of the FFT peaks. Thus, by changing the polarization direction of the pump beam relative to the crystal axes, we can excite some oscillations more than others.
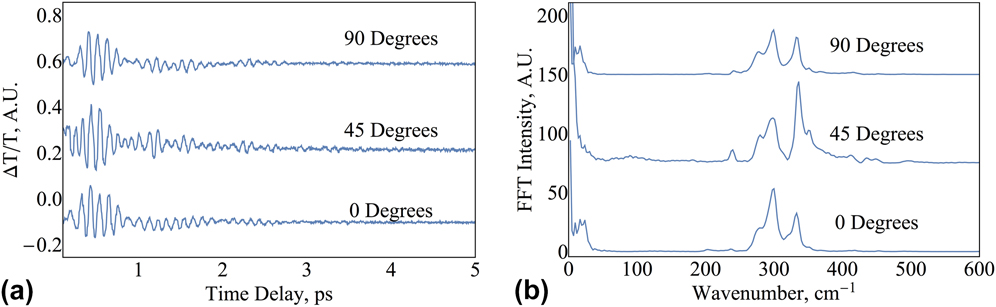
FIG. 5. Observation of how the (a) scans and (b) corresponding FFTs change when rotating the CLN sample about the Z-cut face.
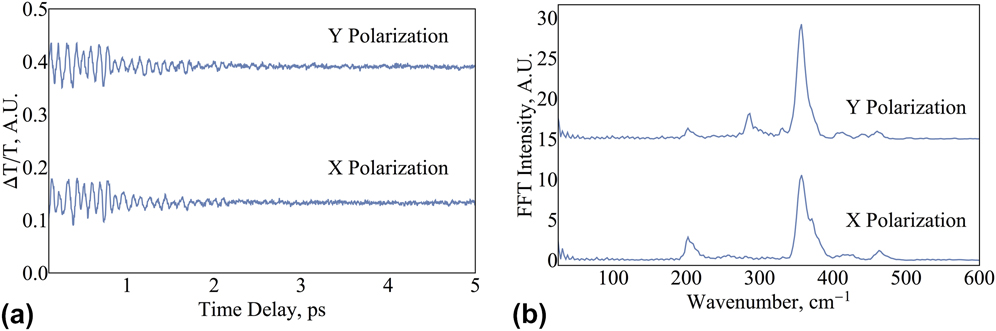
In the scans for the X-cut CLN sample [shown in Fig. 6(a)], we observe dominant oscillations with a period of approximately 2 ps. This appears in the FFTs in Fig. 6(b) as the 23 cm−1 wave number peaks that are significantly stronger than the higher wave number peaks barely visible on these figures. For Y-polarization of the pump beam, there are three other modes observable in the FFT at wave numbers of 266, 275, and 334 cm−1. Only one higher-wave-number FFT peak is visible with the pump polarized in the Z direction at 275 cm−1; however, the scaling on the Y-axis of Fig. 6(b) shows that these modes in both scans appear with amplitudes much smaller than the low-wave-number modes.
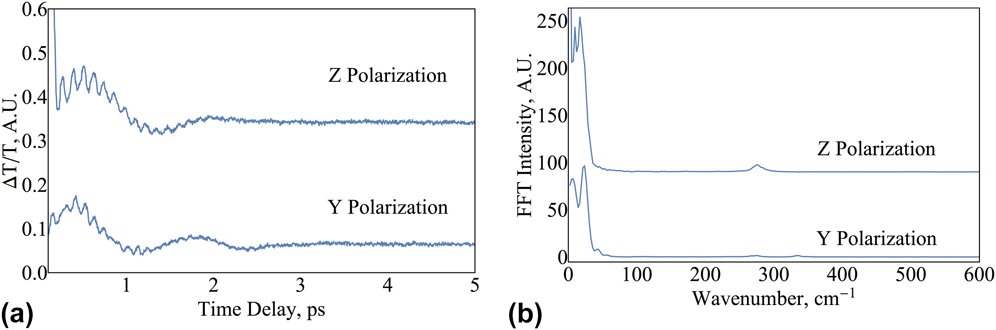
FIG. 6. (a) Transmission scans of X-cut CLN samples using both polarizations of pump pulses and (b) FFTs associated with each scan.
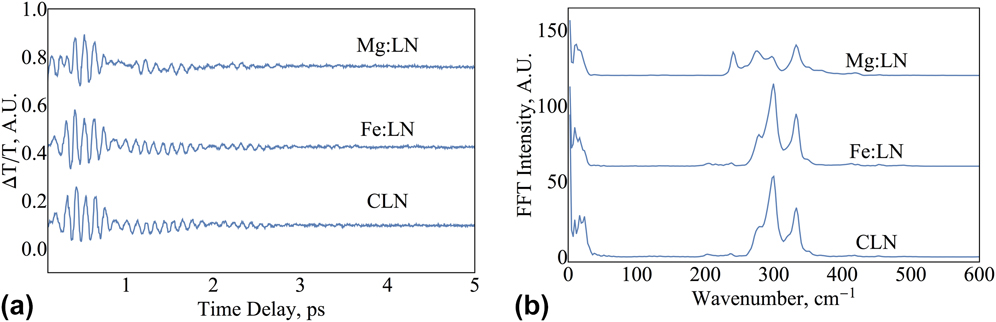
Figure 7(a) shows scans of the Z-cut lithium niobate samples that are undoped (CLN), doped with iron (Fe:LN), or doped with magnesium (Mg:LN). Each of the scans shown was taken with the pump beam polarized in the X direction. The scans of CLN and Fe:LN have a very similar oscillation pattern, and the FFTs in Fig. 7(b) reveal that the oscillation modes excited in these two samples are identical. CLN has oscillation modes with wave numbers 16, 23, 279, 300, and 333 cm−1, whereas Fe:LN has modes occurring at 17, 278, 300, and 332 cm−1 with an uncertainty of ±1 cm−1. Although there is no difference in the oscillation frequencies of these two samples, the amplitudes of these oscillations are somewhat larger for the Fe:LN sample under identical experimental conditions. The Mg:LN sample has an oscillation mode at a wave number of 240 cm−1 that is not apparent in either the Fe:LN or the CLN scan. Also, the peaks of the FFT have smaller amplitudes than those for either the Fe:LN or CLN.

FIG. 7. Observation of the effects of doping on lithium niobate samples. Each sample was Z-cut with pump polarization in the X-direction. The graphs show (a) the time-resolved transmission change for CLN and two types of doping and (b) FFTs for each of these scans.
IV. DISCUSSION
The Raman-active oscillation modes we observed through our ISRS study were compared with CW Raman spectra with the same scattering geometry.Reference Gorelik and Sverbil5,Reference Schauzele and Weber6 We observed oscillations with wave numbers of 275 and 334 cm−1 in the X-cut CLN FFTs, which match within uncertainty the wave numbers associated with the transverse optical modes identified in previous work at 274 cm−1 [2A1(TO)] and 334 cm−1 [3A1(TO)].Reference Gorelik and Sverbil5 The Z-cut CLN FFTs show similar modes at wave numbers of 276 and 332 cm−1, which are consistent with the previously identified longitudinal optical mode wave numbers 276 cm−1 [1A1(LO)] and 334 cm−1 [2A1(LO)].Reference Gorelik and Sverbil5,Reference Schauzele and Weber6 The FFTs contain another mode at 300 cm−1 which matches the wave number of the previously identified polariton wave in the crystal. This is a dispersive effect that occurs at low scattering angles.Reference Gorelik and Sverbil5 In the case of the Mg:LN sample, there is an active vibrational mode which occurs at 240 cm−1 due to stimulation of the transverse optical 2E(TO) Raman mode identified at this wave number in CW Raman measurements.Reference Gorelik and Sverbil5 Oscillations with wave numbers of less than 50 cm−1 are not attributed to Raman modes in previous research, but could be acoustic phonons excited from the initial nonlinear impulse.
The most intense peaks in the FFTs for each scan were used to develop a theoretical fitting function for the temporal scans. The function is a linear combination of the various oscillations with exponentially decaying amplitudes described mathematically as:
 $${{\Delta T} / T} = \sum\limits_{n = 1}^N {{a_n}} \exp \left[ {{{\left( {t - {t_0}} \right)} / {{\tau _n}}}} \right]\sin \left[ {2\pi c{k_n}t + {\varphi _n}} \right]\quad ,$$
where N is the number of visible oscillation modes from the FFT, a n is the oscillation amplitude, t is the time delay of the probe relative to the time, t 0, at which the nonlinear interaction peaks, τn is the decay time, k n is the wave number of the oscillation, c is the speed of light, and φn is the phase of each mode. This function successfully models the behavior of all but one of the lithium niobate scans. Only the X-cut sample with the pump polarized in the Z-direction requires the slightly modified function:
 $${{\Delta T} / T} = {a_0}\exp \left[ {{{\left( {t - {t_0}} \right)} / {{\tau _0}}}} \right] + \sum\limits_{n = 1}^N {{a_n}} \exp \left[ {{{\left( {t - {t_0}} \right)} / {{\tau _n}}}} \right]\sin \left[ {2\pi c{k_n}t + {\varphi _n}} \right]\quad ,$$
where the extra term in front of the summation represents a non-oscillating, exponentially decaying process with a decay time of 190 fs. This may indicate a relaxation from the nonlinear interaction instead of another Raman-active oscillation mode.
An example fit is shown in Fig. 8 for the Z-cut CLN scan with the pump beam polarized in the X-direction. Fit parameters for each of the Z-cut scans are shown in Table I and those for the X-cut scans in Table II. Small differences between the wave numbers of the peaks in the FFT and the fit parameters can be attributed to the uncertainty from the Fourier transforms discussed above. Fit accuracy is determined by calculating the reduced chi-squared (χ2) values as shown in Tables I and II. Some of the χ2 values are slightly larger than 1 because the fits do not account for small long-term variations in the background noise toward the end of some scans. The X-cut CLN scan with the pump polarization in the Y-direction was fit to the first of the two fitting functions using five wave numbers; however, a successful fit required three low-wave-number modes compared to the Z-cut scans that required only one or two low-wave-number modes.
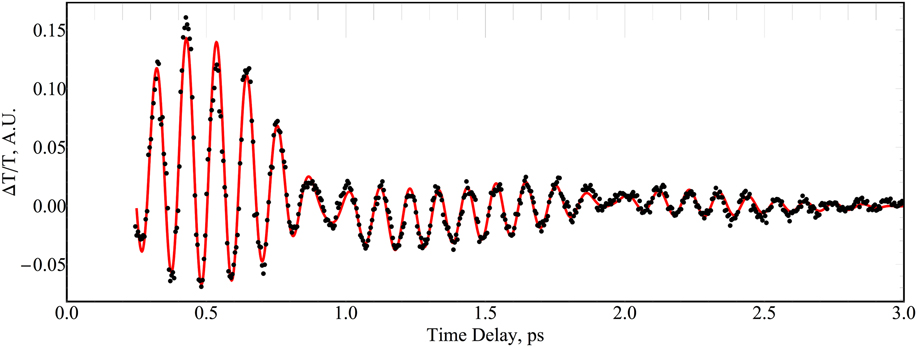
FIG. 8. Fit to the Z-cut CLN scan with pump polarization in the X-direction. The fit function is a superposition of decaying sinusoidal functions. In the case of this fit, there are four frequencies used to recreate the scan. The fit parameters for each of the Z-cut scans are shown in Table I.
TABLE I. Fit parameters used to reproduce the dynamic transmission data for all Z-cut scans using both X and Y pump polarizations.

TABLE II. Fit parameters used to reproduce the dynamic transmission data for the X-cut CLN scans using both X and Y pump polarizations.

The amplitudes of the oscillations in the fit and of the peaks in the FFTs show which modes were most excited in a certain orientation. As for the oscillation modes visible in the CLN and Fe:LN samples, the amplitudes of the modes change in a similar manner when going between the X and Y pump polarization directions. Specifically, the amplitudes a 1 and a 4 are largest for the X polarization, while a 3 and a 5 are largest for the Y polarization. The situation is different with the Mg:LN sample, which has a larger amplitude a 2 for the X polarization and larger amplitudes a 1, a 4, and a 5 for the Y polarization. The amplitude a 3 is almost the same for both polarizations. This different behavior for Mg:LN is likely due to the higher doping (5%) compared to the Fe:LN (0.07%).
Just as the oscillation amplitudes are affected by the change in polarization, the decay times of the Raman-active modes also are affected. Essentially, the decay times quantify how long it takes for each phonon to lose its energy to other undetected modes. One of the most notable changes in decay time with polarization direction is τ3, which is longest for the X pump polarization in both the CLN and Fe:LN samples. However, this change in time delay is much less pronounced in the Mg:LN sample. Another interesting aspect of this data set is the decay time τ2 for the 2E(TO) mode in Mg:LN, which is 30% larger for the Y polarization than for the X polarization. Also, it is significantly longer than any of the other decay times. Because the E-mode oscillations are doubly degenerate, we expect to see a longer decay time than the singly degenerate A modes.
V. SUMMARY
We used the ISRS technique to observe transient transmission oscillations on the sub-picosecond level due to the excitation of Raman-active coherent phonon modes in lithium niobate crystals. We observed oscillations primarily of symmetry modes 1A1(LO) and 2A1(LO) in both doped and undoped LN Z-cut samples and modes 2A1(TO) and 3A1(TO) for X-cut samples. Also, we were able to observe and identify a polariton wave oscillation mode, and low-wave-number oscillations that have not been attributed previously to specific symmetry modes. Lastly, we saw stimulation of the 2E(TO) mode in the Mg:LN Z-cut sample. Fits were applied to each Z-cut and X-cut scan using a superposition of damped sinusoidal oscillations. Amplitudes and relaxation times were determined using these fits. We made comparisons between the fit parameters of doped and undoped LN crystals to see how doping affects the observed oscillation modes, their amplitudes, and their decay times.
ACKNOWLEDGMENTS
We would like to thank Dean Langley in the Department of Physics at the College of Saint Benedict/Saint John’s University for providing much of the equipment used for this work. We also would like to recognize Robert Skibba who performed some initial transmission measurements with the system.