INTRODUCTION
In light of increasing anthropogenic impacts both globally and locally, more detailed knowledge on animal distribution, movement and habitat preference is needed to advise developments, and ensure sustainability. The threats facing cetacean populations around the world have been well described (e.g. MacLeod, Reference MacLeod2009; Stamation et al., Reference Stamation, Croft, Shaughnessy, Waples and Briggs2010; Allen et al., Reference Allen, Cagnazzi, Hodgson, Loneragan and Bejder2012). In Algoa Bay, South Africa (Figure 1), possible threats to cetaceans include increased shipping traffic from the Port of Ngqura development, associated ship strikes (collisions with vessels), entanglement in fishing gear, coastal chemical pollution (industrial and urban sources), noise pollution, a rise in recreational boating, boat-based whale watching, the destruction or alteration of coastal habitats, overfishing and climate change (e.g. Best et al., Reference Best, Peddemors, Cockcroft and Rice2001; Friedmann & Daly, Reference Friedmann and Daly2004; Meÿer et al., Reference Meÿer, Best, Anderson-Reade, Cliff, Dudley and Kirkman2011; Koper & Plön, Reference Koper and Plön2012).
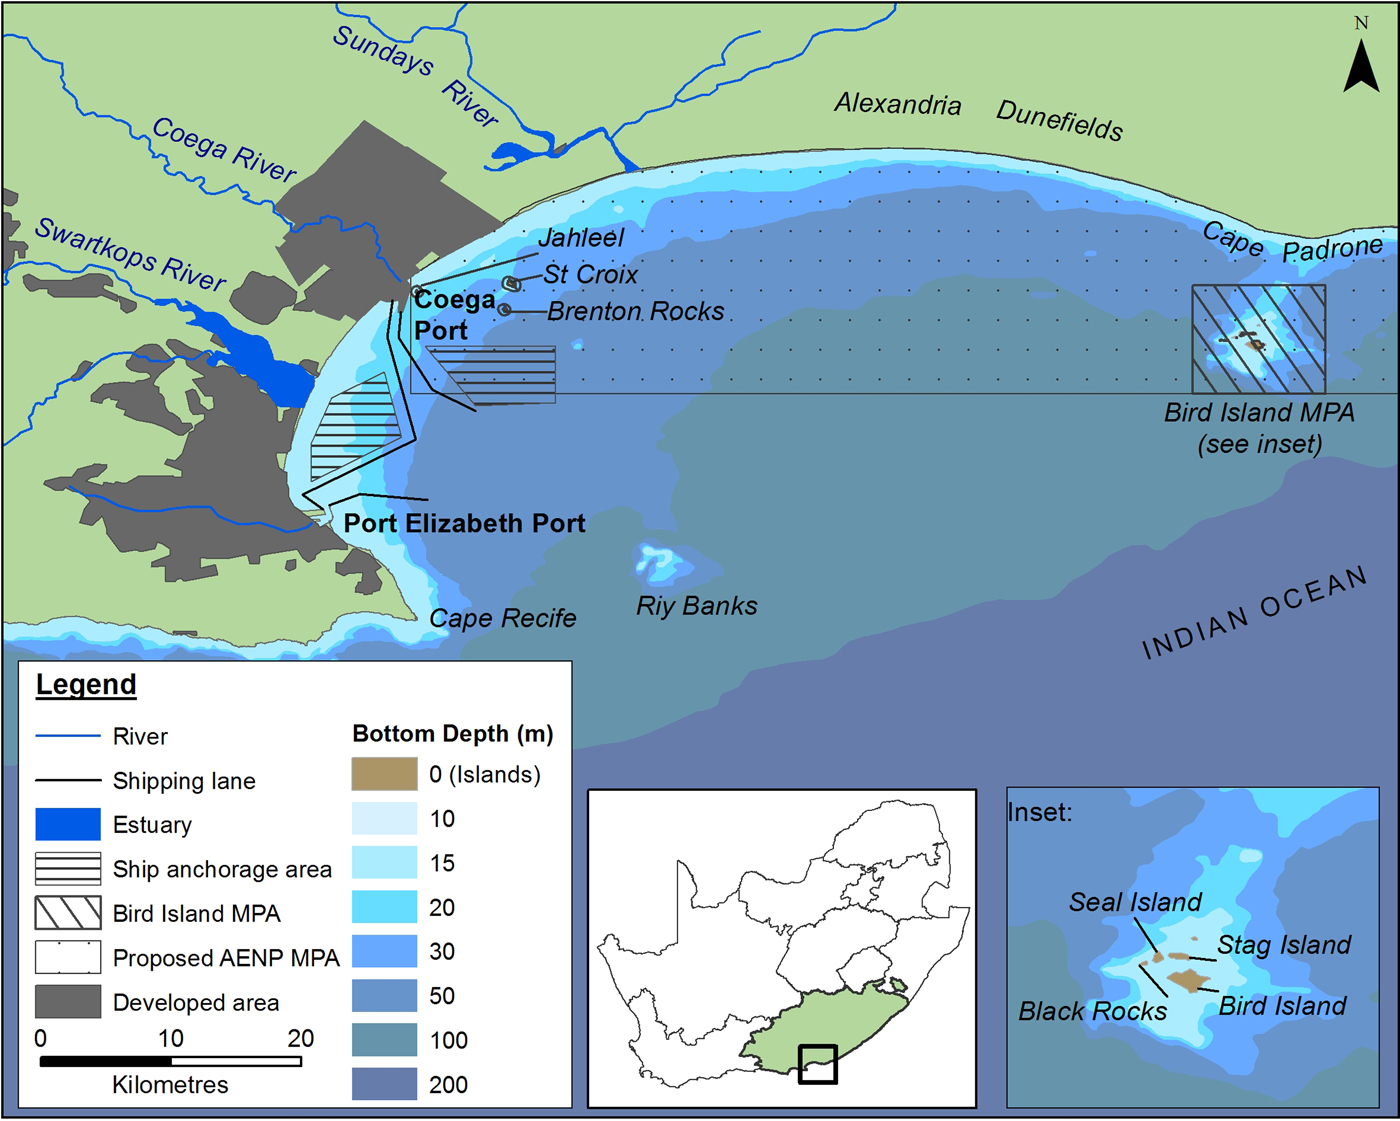
Fig. 1. Features of Algoa Bay on the south-eastern Cape coastline of South Africa (SA). AENP = Addo Elephant Park; MPA = Marine Protected Area. Shipping lanes only show port approaches.
Potentially countering some of these threats is a proposed Marine Protected Area (MPA), which is an extension of the Addo Elephant National Park (AENP) managed by South African National Parks (Chadwick et al., Reference Chadwick, Duncan and Tunley2014; South African National Parks (SANParks) Frontier Region Communications, 2014). These conservation measures would benefit from baseline information on the spatio-temporal distribution of cetacean species in the Bay, as well as their habitat preferences, to inform sustainable development without unnecessary impact on the cetaceans. Species presence can also motivate conservation measures, such as the continued existence of the MPAs.
Several authors have contributed to the understanding of the cetacean species inhabiting the broader region of the South African coastline (for example: Ross, Reference Ross1984; Ross et al., Reference Ross, Cockcroft and Butterworth1987; Cockcroft & Peddemors, Reference Cockcroft and Peddemors1990; Findlay & Best, Reference Findlay and Best1995; Karczmarski, Reference Karczmarski1999; Best, Reference Best2000, Reference Best2001; Elwen & Best, Reference Elwen and Best2004; Reisinger & Karczmarski, Reference Reisinger and Karczmarski2010). However, knowledge on cetaceans in Algoa Bay has been limited historically. No previous field studies have examined the spatio-temporal distribution and habitat preference of cetacean species in Algoa Bay, with the exception of species-specific work on Sousa sp. and Tursiops sp. in the late 1980s and early to mid-1990s (e.g. Ross et al., Reference Ross, Cockcroft and Butterworth1987; Karczmarski & Cockcroft, Reference Karczmarski and Cockcroft1998; Karczmarski et al., Reference Karczmarski, Cockcroft and McLachlan1999; Reisinger & Karczmarski, Reference Reisinger and Karczmarski2010).
Interactions between cetaceans and their habitat are complex, occurring at various spatial and temporal scales, resulting in high spatial heterogeneity (Davis et al., Reference Davis, Fargion, May, Leming, Baumgartner, Evans, Hansen and Mullin1998; Allen et al., Reference Allen, Read, Gaudet and Sayigh2001). This spatial heterogeneity is influenced by abiotic and biotic factors, such as sea surface temperature (SST), bottom depth, distance to land, currents, bottom topography, prey and predator distribution, as well as anthropogenic disturbances (Richardson et al., Reference Richardson, Green, Malme and Thomson1995; Weir et al., Reference Weir, MacLeod and Calderan2009). The spatial heterogeneity results in cetaceans favouring parts of their range, known as critical, key or preferred habitats. Preferred habitats are defined as areas of high use, or parts of an animal's range that are vital for survival and maintenance of a healthy population (Ingram & Rogan, Reference Ingram and Rogan2002; Hoyt, Reference Hoyt2005). For cetaceans, examples of preferred habitats are areas which provide protection from predation, where high concentrations of prey for foraging are encountered, and where important activities such as mating, calving, raising offspring and resting are performed (Sironi et al., Reference Sironi, López, Bubas, Carribero, García, Harris, Intrieri, Iñígues and Payne2008; O'Donoghue et al., Reference O'Donoghue, Whittington, Dyer and Peddemors2010). A good understanding of the location and timing of a preferred habitat is fundamental to managing anthropogenic impacts on cetaceans. In the North Atlantic, for example, recovery plans for North Atlantic right whales (Eubalaena glacialis) have included both reducing ship speeds and routes in the preferred habitats (NOAA Fisheries, 2016), consequently reducing the number of fatalities due to ship strikes.
The aim of this study is to determine spatio-temporal distribution patterns and habitat preferences of the cetaceans in the coastal areas of Algoa Bay, South Africa. These results will indicate areas of potential conflict with marine anthropogenic activities as well as define habitat preferences which may inform future management strategies.
MATERIALS AND METHODS
Study area
Algoa Bay is a large (3100 km2), moderately exposed bay on the south-east coast of South Africa, situated between two headlands, Cape Recife (34o02′S 25o42′E) and Cape Padrone (33o46′S 26o28′E) (Figure 1). Three major rivers, namely the Sundays, Swartkops and Coega Rivers enter the western half of the Bay (Figure 1).
The city and port of Port Elizabeth (PE) are situated on the south-west corner of Algoa Bay. The deep-water Port of Ngqura is situated 20 km to its north and has been operational since October 2009. These two ports are used extensively for both recreational and commercial purposes.
Several geographic features are associated with Algoa Bay. Riy Banks is a shallow reef of 12–15 m depth situated approximately 20 km east-southeast of PE (Bremner et al., Reference Bremner, Du Plessis, Glass and Day1991). The Bay contains two groups of islands: the Bird Island group, comprising Bird Island, Black Rocks, Seal Island and Stag Island (situated ~2 km south of Cape Padrone), and the St Croix Islands, which consist of St Croix, Jahleel and Brenton Rocks (bordering the eastern side of the Port of Ngqura). Two Marine Protected Areas (MPAs) are situated in the Bay: the Bird Island group and the proposed AENP MPA, which is situated between the Port of Ngqura and the Bird Island group and would incorporate the St Croix Islands (Figure 1).
The dominant oceanographic feature associated with Algoa Bay is the warm Agulhas Current which flows between 44 and 60 km offshore of Cape Padrone and Cape Recife, respectively (Goschen & Schumann, Reference Goschen and Schumann1988). A cooler, more nutrient-rich counter-current flows inshore of the Agulhas Current (Beckley & McLachlan, Reference Beckley and McLachlan1979; Griffiths et al., Reference Griffiths, Robinson, Lange and Mead2010). The average water temperature in Algoa Bay is ~18.1°C, but fluctuates between 10.8 and 26.5°C seasonally, or as a result of upwellings and inshore meanders of the Agulhas Current (Christensen, Reference Christensen1980).
Survey procedure
Dedicated boat-based surveys were performed between June 2008 and May 2011 on an 8.5 m semi-rigid boat, using a stratified search effort (Aragones et al., Reference Aragones, Jefferson and Marsh1997; Dawson et al., Reference Dawson, Wade, Slooten and Barlow2008). Three main tracks were covered each month, focusing on the coastal areas of the Bay (Figure 2). These were completed over four to five survey days, depending on weather conditions. Tracks were recorded using a Garmin GPSMAP 76CSx GPS.
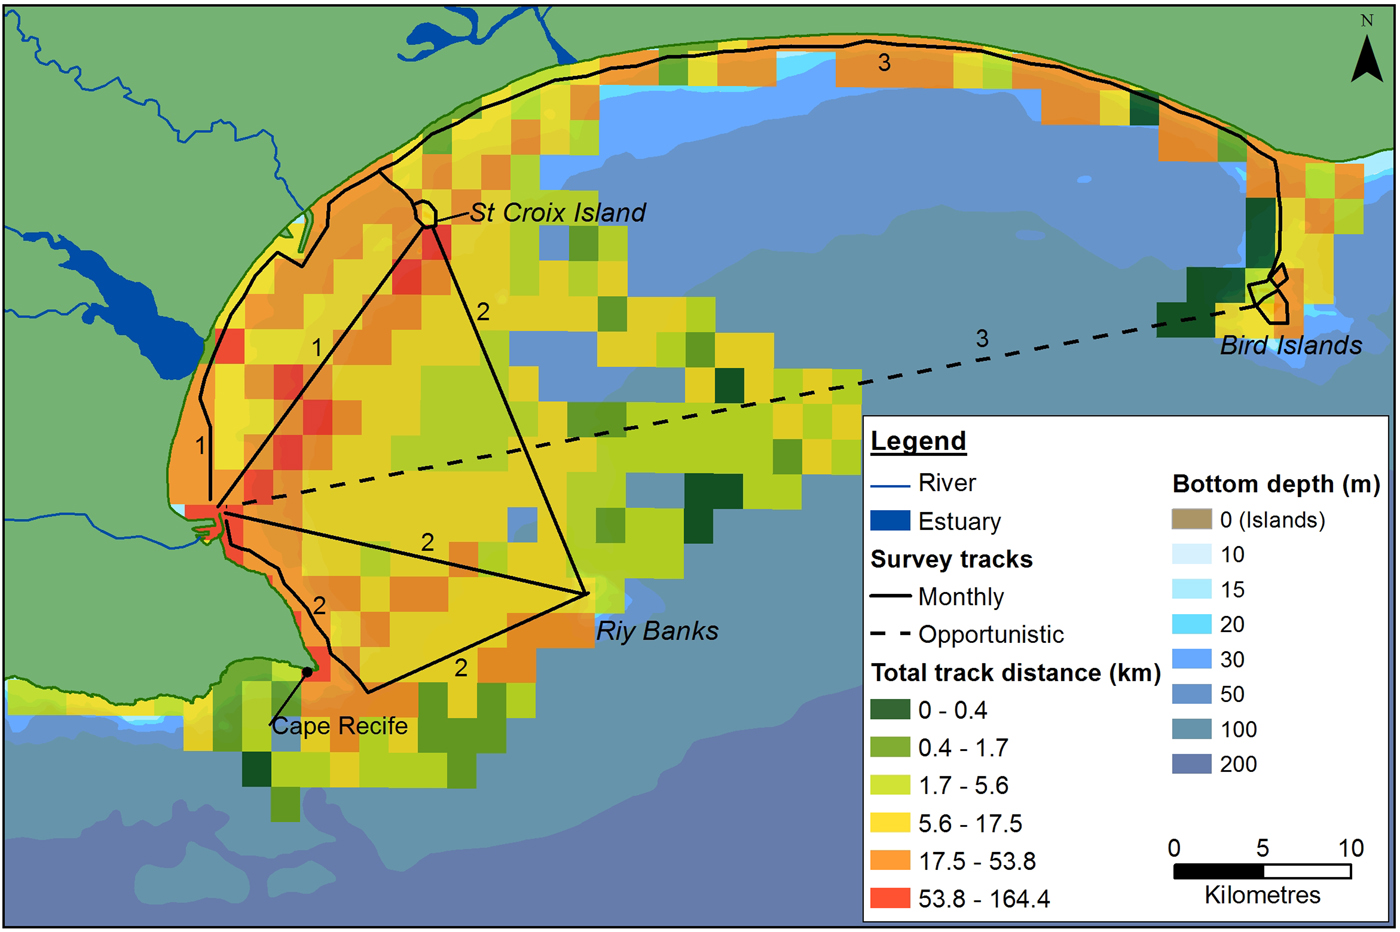
Fig. 2. Outline of the main survey tracks in Algoa Bay. The three main monthly routes are numbered accordingly. Dashed lines represent the track completed to get to the survey destination (data were counted as opportunistic). Total search effort covered within each 4 km2 cell, during the study, is also illustrated.
Search effort was standardized by conducting ‘visual’ surveys during daylight hours, in favourable weather conditions, with a minimum of four observers on board, and a survey speed of 6–9 kn (see: Selzer & Payne, Reference Selzer and Payne1988; Wilson et al., Reference Wilson, Thompson and Hammond1997; Dawson et al., Reference Dawson, Wade, Slooten and Barlow2008). For each sighting, the time, SST, and depth, as well as species, location, number of individuals, group composition and predominant behaviour were recorded. Anthropogenic variables (e.g. shipping lanes and recreational boating) potentially affecting sighting effort or the distribution and behaviour of cetaceans were also identified. A maximum of 20 min was spent at each sighting; subsequently the boat returned to the last point on the track to resume the survey. If another group was spotted during a sighting, its time and approximate location was recorded. The current sighting was ‘closed’ as soon as possible and the boat moved to the new sighting (group). Environmental data were recorded every 30 min on the transect to provide baseline data to compare with data collected at sightings. Further detail on the sampling protocol can be found in Melly (Reference Melly2011).
Predominant behaviour(s) were inferred from the observation of surface characteristics. The behavioural categories included socializing, mating, foraging, slow travel (<3 kn), travelling (>3 kn), fast travel (porpoising), milling and resting (Ballance, Reference Ballance1992; Karczmarski et al., Reference Karczmarski, Thornton and Cockcroft1997; Constantine et al., Reference Constantine, Brunton and Dennis2004; Best, Reference Best2007). The category ‘other’ was used for activities, such as breaching, fluking, tail/flipper slapping, sailing and spy hopping (for mysticetes).
Data analysis
Data from dedicated boat-based sightings (trained observers) were supplemented with opportunistic shore-based sightings (untrained and trained observers) throughout the duration of the study period to explore trends in the sighting data. All sightings were carefully checked for accuracy and inconsistencies before being included in the final dataset.
The average monthly distance surveyed (in km) was used as a measure of survey effort. The number of sightings per unit effort were measured either in terms of distance (sighting rate), or in terms of time (sighting frequency) – these are interconvertible since the speed was approximately constant. The sighting rate is the total number of sightings recorded per 100 km of survey track, over the course of the study (Barendse et al., Reference Barendse, Best, Thornton, Pomilla, Carvalho and Rosenbaum2010), while the sighting frequency is the number of sightings recorded per hour of search effort, over the course of the study.
Statistical analyses on the spatial data were conducted in R (The R project for statistical computing, 2010). Boxplots were used to investigate the relationship between each species and the SST and bottom depth, as an example of two environmental variables that potentially affect cetacean habitat preferences (Baumgartner et al., Reference Baumgartner, Mullin, May and Leming2001; Weir et al., Reference Weir, MacLeod and Calderan2009). T-tests, one-way ANOVAs and post-hoc Tukey HSD tests were used to confirm statistical significance.
Spatial analyses were done using ArcMap 10.2.2 (ESRI® Inc., 2014). The study area was overlaid by a grid comprising 4 km2 squares using the ‘Grid Index Features’ tool in ArcMap. This grid size was used since it allowed visual comparison of preferred habitats for each cetacean species. To ensure that results were comparative, a species-specific sighting rate was then calculated for each cell, over the entire study period, to illustrate high-use areas. Temporal variation was examined by comparing monthly sighting rates (averaged over the study period).
Identification of preferred habitats
Preferred habitats for each cetacean species were determined by considering a number of biological values, i.e. relative density, the most common predominant behavioural state (foraging, resting and mating) and the presence or absence of mother-calf pairs in relation to geographic variables, such as proximity to bathymetric features (reefs and islands), or river/estuarine mouths (potential feeding grounds). Each point (representing an important location and activity) was assigned a value of ‘one’. These data were then converted into a raster feature. The value of each cell was determined by the total number of key behaviours, or the number of mother-calf pairs, in each cell. These cells were then combined using the Raster Calculator in Spatial Analyst (with equal weightings). Kernel density analysis on cetacean numbers also provided further insight on high density zones for each species (Melly, Reference Melly2011); however, these are not displayed in this paper. The two kernel density layers were reclassified into six classes, with the top two classes representing areas of highest density, in order to easily visualize these areas (Melly, Reference Melly2011). As a result, the final map provided an indication of areas with a high density of sightings, as well as areas utilized for important activities, such as foraging, resting or calving.
RESULTS
Search effort and sightings
Over 5000 km were covered during 106 surveys in Algoa Bay between June 2008 and May 2011. The monthly search effort averaged 140 km (±37 km). Search effort was lower in February and September due to poorer weather conditions. Six cetacean species were recorded: Eubalaena australis (southern right whales), Megaptera novaeangliae (humpback whales), Balaenoptera brydei (Bryde's whales), Tursiops aduncus (Indo-Pacific bottlenose dolphins), Sousa plumbea (Indian Ocean humpback dolphins) and Delphinus capensis (long-beaked common dolphins).
A total of 500 confirmed sightings were recorded (Table 1). On average, there were 4.72 sightings recorded per survey, at a rate of 9.86 sightings per 100 km (Table 1). This is the equivalent of a frequency of almost one sighting per hour (0.97 S h−1). A further 200+ opportunistic sightings were recorded by various observers during the study.
Table 1. Summary of the number of cetacean sightings observed during boat-based surveys. S h−1 = sighting frequency, i.e. sightings per hour of search effort (over the entire course of the study). Numbers in parentheses indicate figures corrected for the months the migratory whales were present in the bay (see Figure 6).
The total number of sightings, the sighting frequency, and the number of individuals, provide an indication of the prevalence of each of the species (Tables 1 and 2). Tursiops aduncus were sighted most frequently with 233 sightings. A high number of sightings (113) and a high sighting rate was also recorded for M. novaeangliae during their austral wintering months (Table 1). Eubalaena australis sightings were recorded on 50 occasions during the study between June and November. Sighted less frequently, although with a year-round presence, were S. plumbea and B. brydei (Table 1). Delphinus capensis were least observed in Algoa Bay, with nine sightings over the 3-year study period (Table 1).
Table 2. Group size (range) and estimated total number of individuals observed during boat-based surveys.
A total of 217 opportunistic cetacean sightings were recorded, with the same six species observed as during dedicated surveys (Table 1); T. aduncus was the most common (108 sightings), and in general, the number of sightings for each species followed the pattern seen during dedicated surveys.
Spatial distribution of sightings and associated environmental parameters
The majority of boat-based surveys were carried out in waters ~23 m (±18 m) deep (Figure 2), that ranged from 1.9–95.0 m deep. The average SST was 18.5 ± 1.9°C, which ranged from 14.2–24.5°C. The more exposed sections of the Bay were covered less frequently, resulting in the highest concentration of tracks occurring in a sheltered section between PE harbour and the St Croix Island. Sightings were observed throughout the survey area, in waters between 1.9 and 86 m deep, with different spatial distributions for each species (Figure 3). Cetaceans were associated with key environmental features in the Bay, with a total of 100 sightings located within 2 km of river/estuarine mouths, and 46 sightings within a 2 km radius of islands and reefs in the Bay (key bathymetric features).
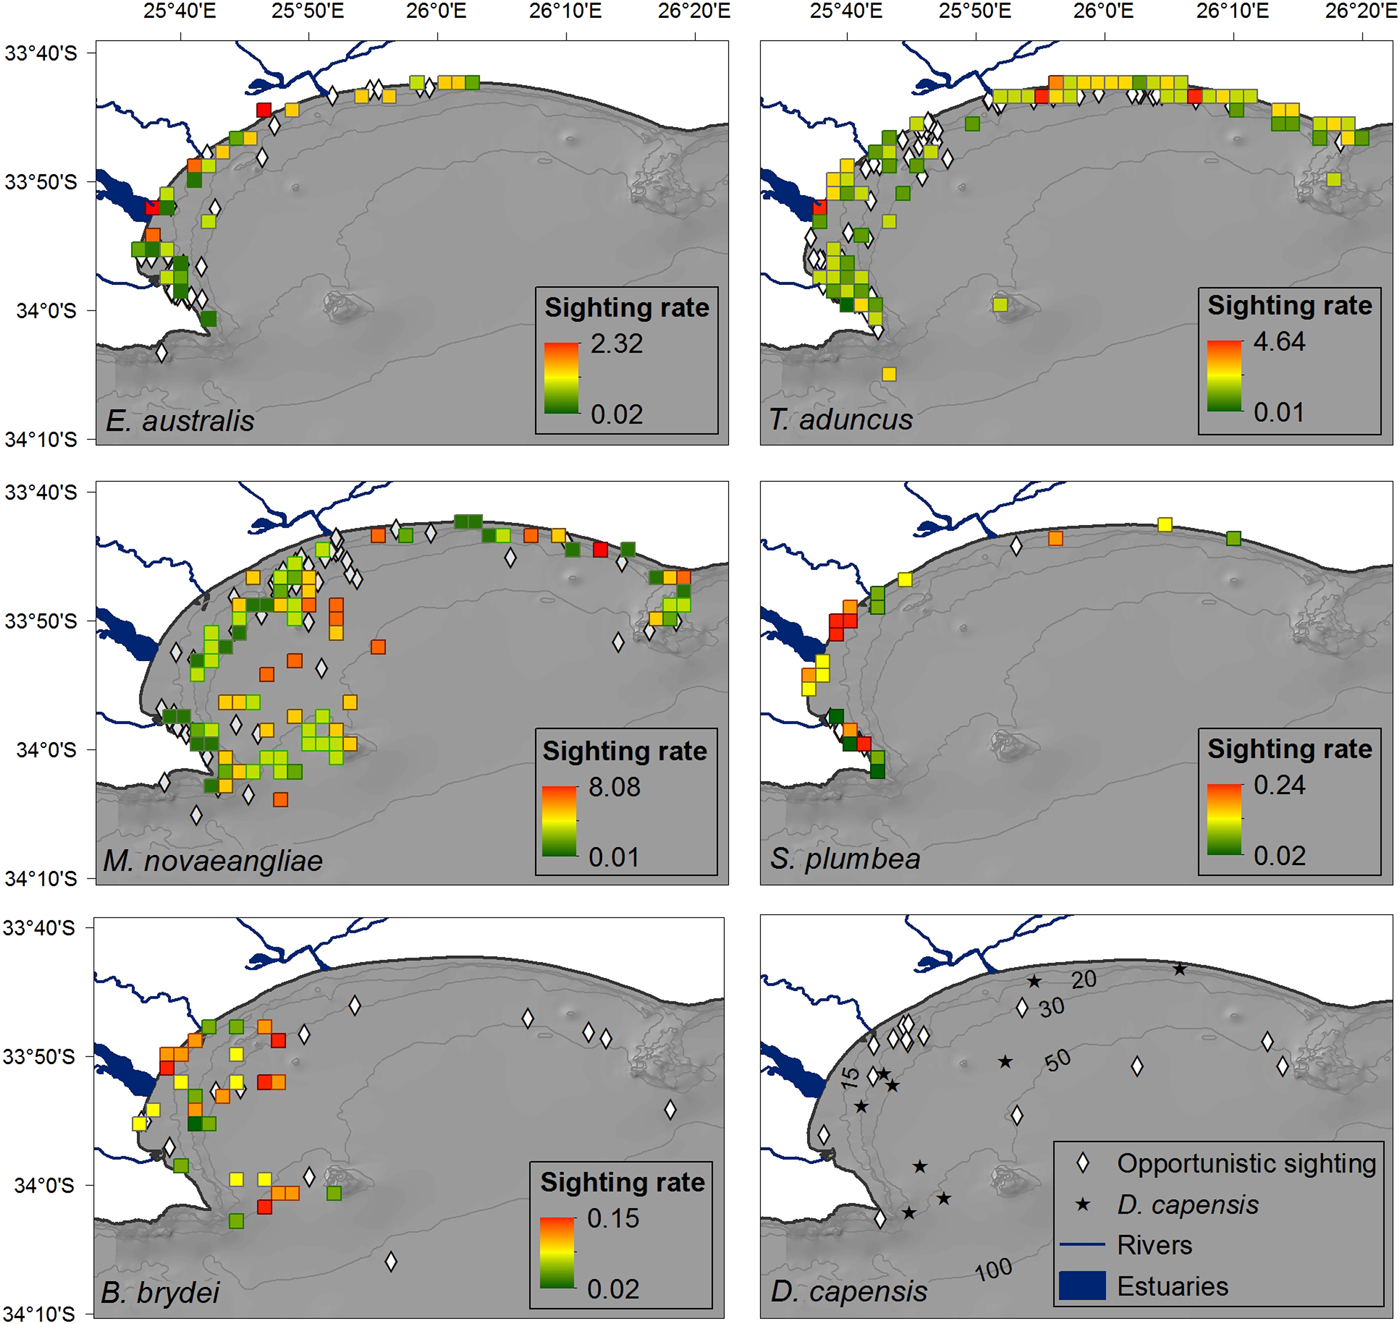
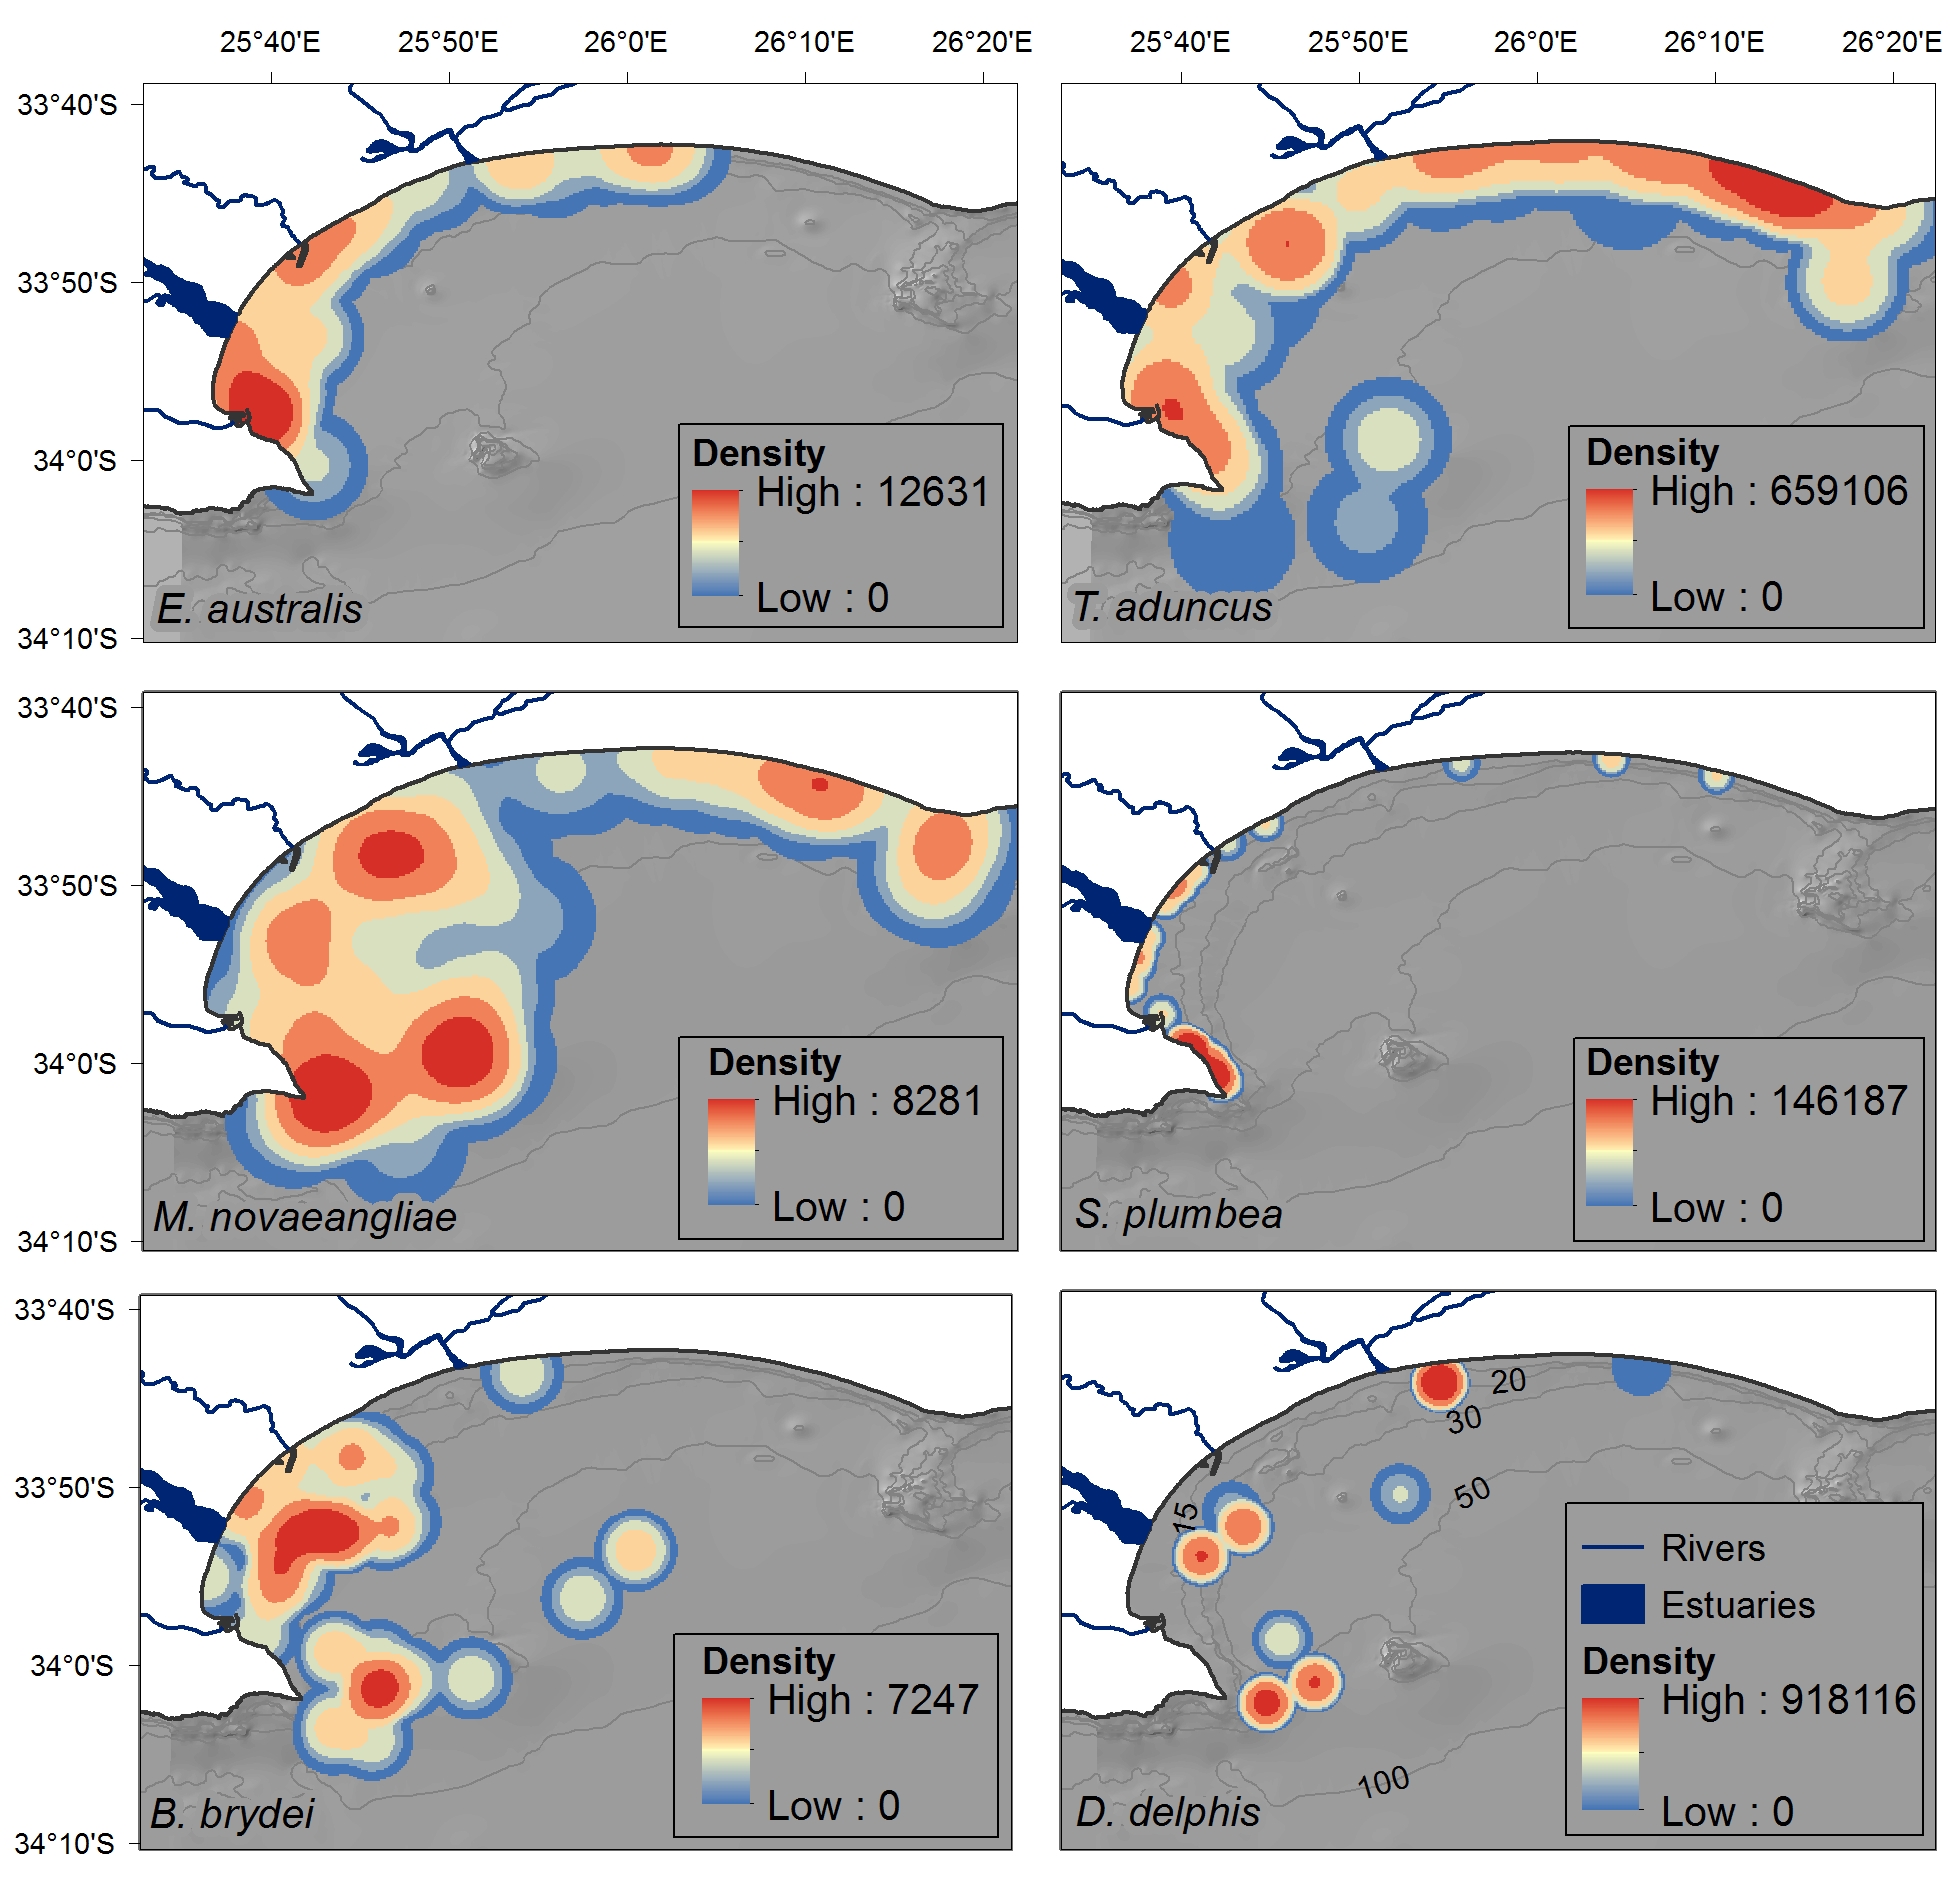
Fig. 3. Distribution of cetacean sightings for each species observed in Algoa Bay between June 2008 and May 2011, corrected for search effort within each 4 km2 cell. The nine D. capensis sightings are plotted individually as stars. Opportunistic data for all species are represented by black circles (in colour figure only). The location of mother-calf pairs for E. australis and M. novaeangliae are represented by an ‘x’. Bathymetry lines are only shown in colour figure.
Eubalaena australis was predominantly sighted in the sheltered, inshore areas of Algoa Bay between PE Port and 3.5 km east of Sundays River Mouth (Figure 3), in waters ~12 m deep (Figure 4). This was significantly shallower than areas frequented by M. novaeangliae and B. brydei, which were found in average depths of 30 m (ANOVA, F 2 = 25.28, P < 0.001; post-hoc Tukey HSD, P < 0.001) (Figure 4). Tursiops aduncus and S. plumbea were both found in significantly shallower water depths (mean = 9.5 and 6.6 m respectively) than D. capensis (mean = 32.2 m) (ANOVA, F 2 = 40.91, P < 0.001; post-hoc Tukey HSD, P < 0.001) (Figure 4).

Fig. 4. Median bottom depth and sea surface temperature (SST) for the six cetacean species observed in Algoa Bay. Whiskers represent all data within 1.5 of the interquartile range (IQR). Outliers are displayed as open circles.
Sightings were recorded in waters between 14 and 25°C (Figure 4). Overall, there was a significant difference in the average SST of the preferred habitat of the different species (ANOVA, F 5 = 3.604, P = 0.003). This was especially evident for E. australis, which was associated with significantly colder waters (mean = 17.7°C) than the other cetacean species (various post-hoc Tukey HSD, P < 0.05).
Cetacean sightings were associated with all major geographic features of the Bay, including estuaries, reefs (especially Riy Banks) and the two island groups (Figures 3 and 5). Approximately 52% of the total number of sightings were located in the proposed AENP MPA. However, a number of sightings were also found in areas of high levels of marine anthropogenic activities (shipping lanes, ship anchoring areas or close to the entrance of the ports and rivers) (Figure 5).
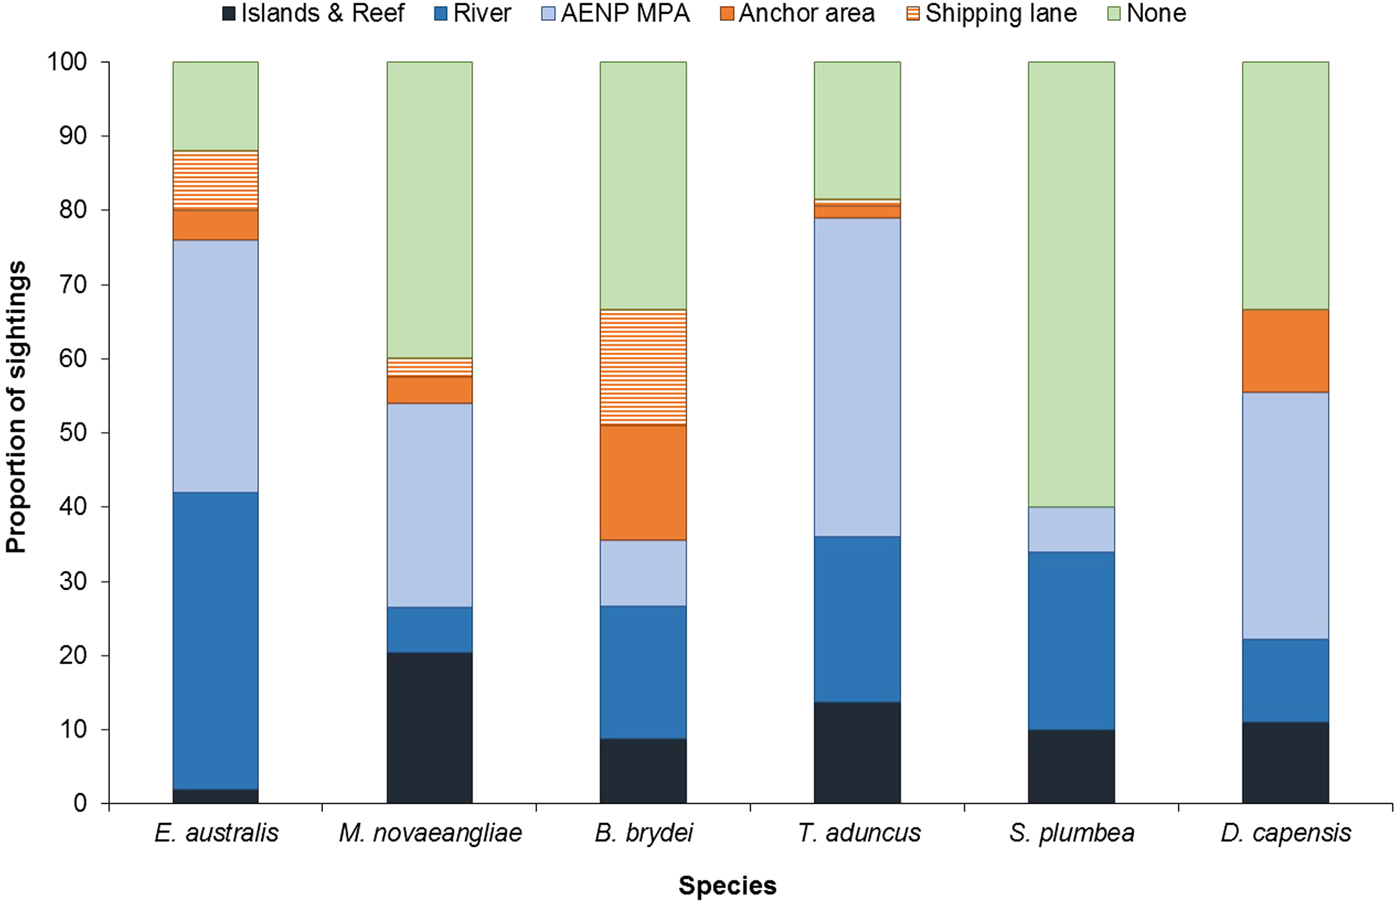
Fig. 5. Proportion of sightings found in areas associated with various geographic and anthropogenic activities. None = remaining non-designated areas of the Bay; AENP MPA = The proposed Addo Elephant National Park Marine Protected Area. Islands & Reef refer to St Croix Islands MPA, Bird Islands MPA and Riy Banks reef.
Eubalaena australis were surprisingly absent from the areas around the Swartkops and Sundays estuaries (Figure 3). The majority of sightings for this species were recorded south of the Swartkops River mouth and around PE Port, some of which were located in shipping lanes/ship anchoring areas (Figures 3 and 5). Mother-calf pairs were also observed inshore of St Croix and towards Sundays River Mouth throughout the season.
Sightings of M. novaeangliae were recorded throughout the survey area, including Riy Banks and the two island groups (Figures 3 and 5). A number of inshore sightings were observed between PE Port and Cape Recife, and in the proposed MPA (Figures 3 and 5). In contrast to E. australis, no sightings were seen in the inshore area between the two ports. Megaptera novaeangliae and B. brydei were found at similar depths, and their preferred habitats had similar mean SSTs of approximately 19°C (Figure 4).
Balaenoptera brydei were predominantly observed in the offshore areas of the western half of Algoa Bay, with opportunistic sightings also recorded in the eastern part of the Bay, offshore of the Alexandria Dunefield (Figure 3). Unlike M. novaeangliae, B. brydei were not closely associated with the island groups or shallow reefs. Several B. brydei sightings were recorded closer to shore, between the Swartkops River mouth and the Port of Ngqura. Some of these sightings were also located in designated shipping lanes and ship anchoring areas (Figure 5).
Tursiops aduncus was the most prolific species, observed extensively in the inshore areas of Algoa Bay, predominantly in waters of 8–20 m deep, with some sightings in waters up to 80 m deep (Figure 4). The majority of sightings were recorded between PE Port and Cape Recife, along the Alexandria Dunefield, and at the islands and Riy Banks reef (Figures 3 and 5).
Sousa plumbea showed a similar spatial distribution pattern to E. australis. Sightings for both species were exclusively located in the shallow, inshore waters of the Bay (Figure 3). Sousa plumbea was recorded in shallow waters between 2–13 m deep (mean = 6.61 m) (Figure 4). This species was also associated with warmer SSTs, with an average of 19.14°C. The majority of sightings were observed in the rocky shore area between PE Port and Cape Recife. Relatively few sightings were associated with designated anthropogenic areas (Figure 5).
Delphinus capensis sightings were observed in the offshore and more exposed areas of Algoa Bay, with opportunistic sightings recorded around St. Croix and in the offshore areas of the eastern half of the Bay, including the Bird Island group (Figure 3). This species was observed in significantly deeper waters than T. aduncus and S. plumbea, between 15 and 54 m deep (mean = 32 m) (ANOVA, F 2 = 27.22, P < 0.001; post-hoc Tukey HSD, P < 0.001) (Figure 4).
Seasonal variation
Patterns of seasonal variation in occurrence and distribution were evident for all six species, with the two migratory whale species showing the most distinct seasonality. Eubalaena australis occurred in Algoa Bay between June and November each year (during austral winter and spring), with an average austral winter and spring sighting rate of 2.17 per 100 km (Figure 6 and Table 1). In this species, sighting rates peaked between August and October (Figure 6).
Fig. 6. Average number of sightings per month for the six cetacean species over the study period. Austral summer months are December to February.
Megaptera novaeangliae showed a similar seasonal distribution pattern to E. australis and had an overall sighting austral winter rate of 3.44 per 100 km (Figure 6 and Table 1). They were observed in low numbers from late May to August (average sighting rate of 0.74/100 km), which increased to a sighting rate of 9.42 in November. No M. novaeangliae sightings were recorded in January (Figure 6).
Unlike the migratory whale species, B. brydei were seen year-round. However, sightings were lower between August and November (average 0.34 sightings/100 km), and higher in austral autumn (1.28 sightings/100 km) (Figure 6).
Tursiops aduncus were the only species recorded in every month of the year, with a mean rate of 4.63 sightings/100 km, with bimodal annual peaks in April/May and in October/November (Figure 6 and Table 1). Lower numbers were recorded in austral summer (3.32 sightings/100 km) compared with other seasons.
Sousa plumbea had a mean rate of 1.08 sightings/100 km (Table 1). The highest number of sightings was observed in February (3.59 sightings/100 km), with low numbers recorded in autumn (March/April), and no sightings in May or September (Figure 6).
Delphinus capensis were not frequently observed in Algoa Bay; consequently, it is difficult to infer seasonal trends. Five of the nine sightings did occur in January and February, however.
Group composition and dynamics
Group sizes varied extensively among the different species (Table 2). Mysticetes had smaller group sizes compared with the odontocetes, with M. novaeangliae and E. australis comprising two to three individuals (Table 2). Groups of two in mysticetes often represented a mother-calf pair. In general, calves were observed for all cetacean species, especially in the two migratory whale species, E. australis and M. novaeangliae.
Larger groups of up to eight E. australis were recorded during mating or surface active groups (SAGs) (Figure 7), which were largely observed around PE Port during September (beginning of austral spring). This species spent the majority of their wintering time in the Bay (June to November) milling and socializing, especially when calves were present (Figure 7).
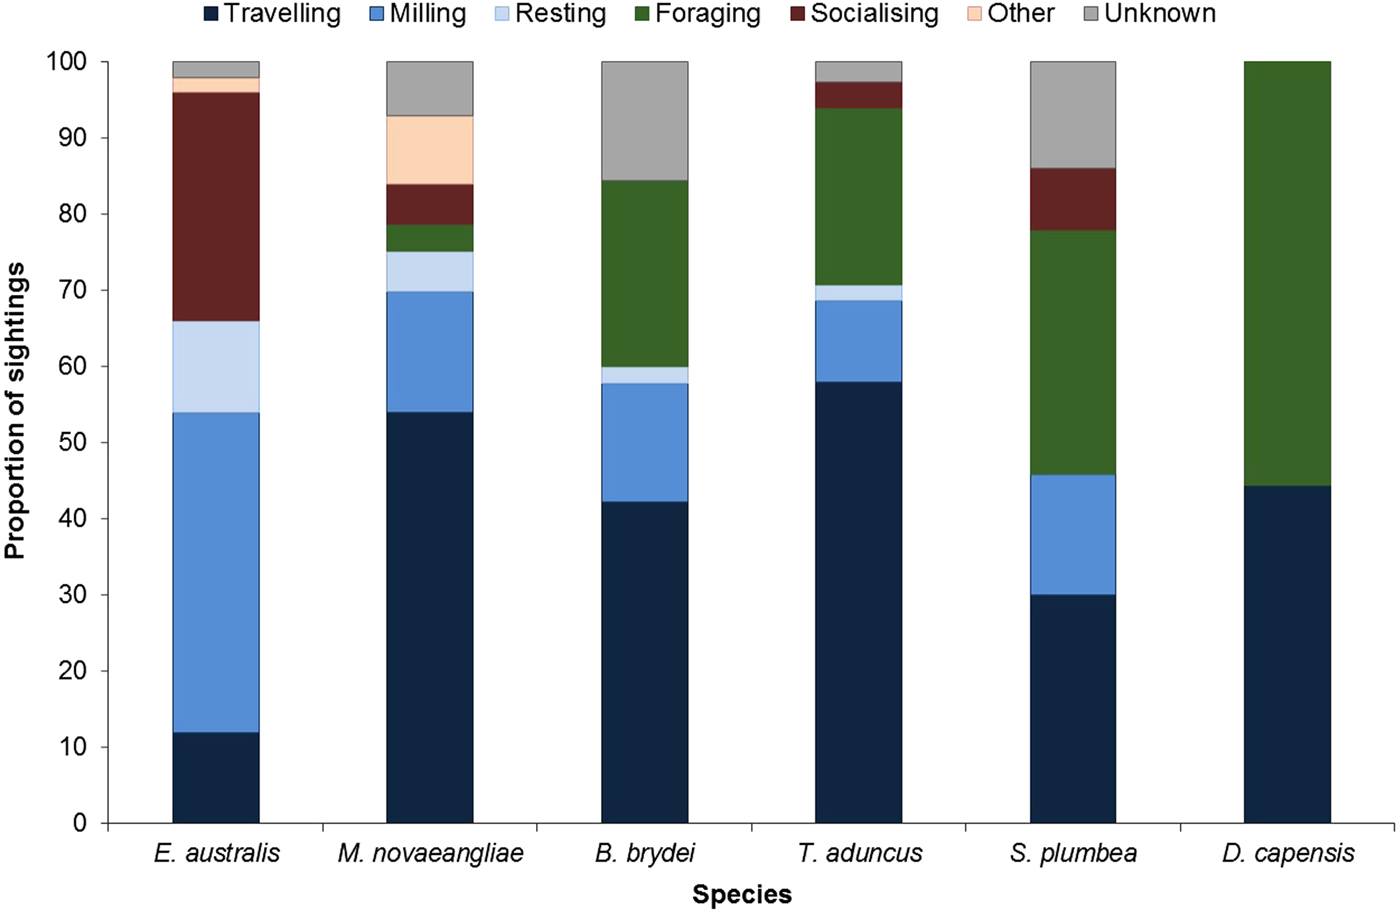
Fig. 7. Behavioural budget for each cetacean species.
In contrast, M. novaeangliae were primarily observed travelling in Algoa Bay (Figure 7). Breaching, flipper slapping and other behaviours were also frequently observed in this species, and predominantly later in the season. Megaptera novaeangliae were also observed resting in the inshore areas of the Alexandria Dunefield coastline, especially around Cape Padrone, with some opportunistic foraging occurring within the AENP MPA.
Balaenoptera brydei were observed singly or in groups of two individuals. This species was predominantly observed travelling and foraging (Figure 7), the latter of which consisted of horizontal lunges below the surface of the water. The foraging activities were mostly associated with fish aggregations (bait balls). The travelling behaviour was also attributed to boat avoidance by this species. Only one calf was spotted throughout the study.
Tursiops aduncus group sizes ranged from one and ~500 individuals (Table 2). Larger groups of more than 100 individuals were recorded in the MPA, often exhibiting different behaviours in various ‘sub-groups’. Foraging was recorded along the entire shoreline of the Bay (Figure 7), especially east of Sundays River and south of PE Port, as well as at Riy Banks reef and the island groups (Figure 3). Socializing activities were common in this species, especially in the MPA.
Sousa plumbea had the smallest group size out of the three odontocete species, ranging from one to eight individuals (Table 2). One exception was a sighting with 23 individuals in June 2010, when three calves and four juveniles were also recorded (Table 2). This species was primarily seen foraging, mainly south of PE Port and around the Swartkops River.
Delphinus capensis had the largest group sizes, ranging from ~500–800 animals (Table 2). Like B. brydei, they were often recorded as foraging on fish aggregations in association with various predators, including gannets (Morus capensis), African penguins (Spheniscus demersus), roseate terns (Sterna dougallii), Cape fur seals (Arctocephalus pusillus), as well as other cetacean species such as B. brydei and T. aduncus. These aggregations appeared to be comprised of sardines (Sardinops sagax).
DISCUSSION
Six cetacean species were observed in the surveyed area in Algoa Bay, displaying a number of different spatial and temporal distribution patterns and various group dynamics. These patterns and group dynamics were associated with several environmental features in the Bay, indicating various habitat preferences, which are discussed below.
General spatial and temporal distribution patterns
Sightings of E. australis were recorded in Algoa Bay between June and November, throughout the austral winter months (Best et al., Reference Best, Schaeff, Reeb and Palsbøll2003). Best (Reference Best2000) recorded a steady decline in E. australis sightings along the Algoa Bay coastline between 1970 and 1998, with no sightings recorded in the 1990s. This corresponded with a general increase in densities in the waters of the Western Cape of South Africa (~19–20°E). The results of this study indicate that this situation has changed over the last decade, with a greater number of E. australis recorded in Algoa Bay. This appears to be particularly the case for the more sheltered locations on the western half of Algoa Bay (e.g. behind the breakwaters of the ports and on the leeward side of St Croix Island), where a number of calves were recorded. However, at present it is unclear whether the presence of these animals in the Bay is the result of a shift in distribution away from other areas, or whether it is a result of their large population growth of 7% per annum, resulting in an expansion of their range along the coast (Best, Reference Best2000).
Megaptera novaeangliae, like E. australis, were observed in Algoa Bay during the austral winter (May to December). Megaptera novaeangliae use subtropical coastlines, such as the Eastern Cape coastline, as a migratory corridor to their breeding areas, which extend along southern Africa, from Angola to Mozambique and Madagascar (Best, Reference Best2007; Gales et al., Reference Gales, Bannister, Findlay, Zerbini and Donovan2011). In Algoa Bay, M. novaeangliae sightings were first recorded in May/June, when the animals arrive in SA waters on their migration to the breeding grounds. This results in a winter ‘peak’ of abundance in June, before they continue on their northward migration to tropical regions (Gales et al., Reference Gales, Bannister, Findlay, Zerbini and Donovan2011). The sharp increase in sightings in November and December indicates the southward movement of these animals at the end of the winter breeding season, which supports previous reports by Best et al. (Reference Best, Findlay, Sekiguchi, Peddemors, Rakotonirina, Rossouw and Gove1998) and Best (Reference Best2007). This is in contrast to research on the south-western coastline of SA where a late season peak in M. novaeangliae was not clearly observed.
The sighting frequency for M. novaeangliae recorded here was almost three times higher than the total frequency of 0.12 S h−1 recorded by Best et al. (Reference Best, Findlay, Sekiguchi, Peddemors, Rakotonirina, Rossouw and Gove1998) in surveys off the southern African coastline. Sighting frequencies of 0.16 S h−1 were recorded in Saldanha Bay, which is also lower than recorded for Algoa Bay (Barendse et al., Reference Barendse, Best, Thornton, Pomilla, Carvalho and Rosenbaum2010). This indicates that Algoa Bay is possibly an important location along the migratory route for this species. Gales et al. (Reference Gales, Bannister, Findlay, Zerbini and Donovan2011) also suggest that this species is now thought to use an expanded area along the southern African coastline during their breeding season.
Balaenoptera brydei were predominantly observed in the offshore areas between Cape Recife and Riy Banks, and the more inshore areas between the Swartkops River mouth and St. Croix Island. The peak in B. brydei sightings from March to May, followed by a decrease in sightings in August to October recorded in this study, has also been observed in Plettenberg Bay, South Africa (Penry et al., Reference Penry, Cockcroft and Hammond2011), and off the south-western coast (Vinding et al., Reference Vinding, Bester, Kirkman, Chivell and Elwen2015). This could be linked to relatively small-scale migrations along the South African coastline related to changes in prey distribution (Penry et al., Reference Penry, Cockcroft and Hammond2011). This type of movement has also been recorded off Brazil and New Zealand (O'Callaghan & Baker, Reference O'Callaghan and Baker2002; Wiseman, Reference Wiseman2008). In South Africa, the Bryde's whale migration is thought to be linked to the annual winter migration of sardines (S. sagax) from Western Cape waters to the warmer waters of the Eastern Cape and Kwa-Zulu-Natal, commonly known as the Sardine Run (Beckley & van der Lingen, Reference Beckley and van der Lingen1999; Best, Reference Best2001; O'Donoghue et al., Reference O'Donoghue, Whittington, Dyer and Peddemors2010).
Balaenoptera brydei had a lower number of sightings (45) compared with the other two mysticete species. The general lack of sightings and information on this species is noted elsewhere. For example, an average of 0.45 sightings per day has been recorded in Plettenberg Bay (Penry et al., Reference Penry, Cockcroft and Hammond2011), and only 101 sightings were recorded over 3900 trips to sea along the south-western coastline (Vinding et al., Reference Vinding, Bester, Kirkman, Chivell and Elwen2015).
Among the odontocetes, T. aduncus were the most prevalent species in Algoa Bay, both in terms of sighting frequency and relative density. Sighting frequencies fluctuated seasonally, with peaks in spring. Previous studies on this species indicate a large ‘open’ population and an extensive range along the South African coastline (Reisinger & Karczmarski, Reference Reisinger and Karczmarski2010), which would contribute to the occurrence of animals throughout the year as well as seasonal fluctuations.
Sousa plumbea were predominantly found in the inshore areas of the western half of Algoa Bay, especially south of PE Port, confirming patterns described in previous studies (see: Karczmarski et al., Reference Karczmarski, Cockcroft and McLachlan1999; Koper et al., Reference Koper, Karczmarski, du Preez and Plön2016). Sightings occurred throughout the year, with a peak in February; however, the near-absence of these dolphins from March to May is noteworthy and is in contrast to previous findings by Karczmarski et al. (Reference Karczmarski, Cockcroft and McLachlan1999), who recorded a peak in S. plumbea sightings throughout the summer months (December to March). Koper et al. (Reference Koper, Karczmarski, du Preez and Plön2016) noted that based on land-based observations this seasonal pattern of occurrence had shifted from the 1990s, with more sightings occurring in winter (June to August), and a peak in sightings between September and November. These latter findings correspond to those observed here. The sighting frequency for S. plumbea was low (0.10 S h−1) considering the survey covered most of the species’ known habitat in Algoa Bay (Karczmarski et al., Reference Karczmarski, Cockcroft and McLachlan1999). Higher sighting frequencies have been recorded in Australia (0.2 S h−1) and Richards Bay, South Africa (0.34 S h−1) (Atkins et al., Reference Atkins, Pillay and Peddemors2004; Parra et al., Reference Parra, Schick and Corkeron2006). This could be attributed to seasonal migrations in and out of the Bay, depending on prey availability (Karczmarski et al., Reference Karczmarski, Cockcroft and McLachlan1999; Keith et al., Reference Keith, Peddemors, Bester and Ferguson2002). It is currently unknown at which scale this occurs, but Karczmarski et al. (Reference Karczmarski, Cockcroft and McLachlan1999) suggested movements of between 100 and 1000 km for the species.
Delphinus capensis was the least frequently sighted cetacean species in Algoa Bay, and due to the paucity of sightings it is not possible to conclusively determine spatial and temporal distribution patterns. Although this species was generally observed offshore, several sightings occurred in the more inshore areas around Swartkops River Mouth and the Port of Ngqura. These inshore sightings were associated with foraging around fish aggregations. Thus, this species appears to follow shoals of fish to these more inshore areas when the opportunity arises (Reilly, Reference Reilly1990; Samaai et al., Reference Samaai, Best and Gibbons2005).
The peak in sightings in late summer is expected as D. capensis are found off the Eastern Cape coastline during this season, moving northward towards KwaZulu-Natal with the Sardine Run (May–June) (O'Donoghue et al., Reference O'Donoghue, Whittington, Dyer and Peddemors2010). However, aerial surveys carried out between Port Elizabeth and East London in the late 1980s detected low densities of D. capensis throughout the year, suggesting that many animals did not migrate with the rest of the population during the Sardine Run (Cockcroft & Peddemors, Reference Cockcroft and Peddemors1990).
Group dynamics
Group sizes were similar for E. australis and M. novaeangliae (~2.4 animals per sighting), and in accordance with other records for both of these species on their sub-tropical breeding grounds (Costa et al., Reference Costa, Praderi, Piedra and Franco-Fraguas2005; Barendse et al., Reference Barendse, Best, Thornton, Pomilla, Carvalho and Rosenbaum2010; Gales et al., Reference Gales, Bannister, Findlay, Zerbini and Donovan2011; Vinding et al., Reference Vinding, Bester, Kirkman, Chivell and Elwen2015).
A large portion of the E. australis sightings were mother-calf pairs, which suggests that Algoa Bay is a nursery area, especially in the sheltered and shallower parts of the Bay. Algoa Bay has, therefore, added to the number of nursery areas that have previously been identified along the south coast of South Africa (Best, Reference Best2000; Elwen & Best, Reference Elwen and Best2004). A large proportion of socializing behaviour in E. australis was a result of mating activities, often linked to ‘surface active groups’ or SAGs (Best et al., Reference Best, Schaeff, Reeb and Palsbøll2003; Patenaude, Reference Patenaude2003). Such activities were seen five times in the Bay, for larger groups with a minimum of eight individuals.
For M. novaeangliae, sighting rates and group sizes increased throughout the breeding season, towards the end of austral winter. Similar observations have been made along the west and east coasts of southern Africa (Barendse et al., Reference Barendse, Best, Thornton, Pomilla, Carvalho and Rosenbaum2010; Gales et al., Reference Gales, Bannister, Findlay, Zerbini and Donovan2011). On the east coast (Breeding Stock C, which utilizes the study area), the animals move northwards towards Mozambique (15°S) in the beginning of the austral winter to breed, and then migrate back southward during the austral spring (until November) (Gales et al., Reference Gales, Bannister, Findlay, Zerbini and Donovan2011). Algoa Bay is possibly a departure point on the South African coast, with a peak at the end of winter being experienced prior to migration towards Antarctica. This is in contrast to the south-west coastline of SA, where no late season peak in sightings occurred (Vinding et al., Reference Vinding, Bester, Kirkman, Chivell and Elwen2015). The group sizes are larger than those observed in areas located further north along the southern African coastline, where 73% of sightings consisted of mother-calf pairs (Gales et al., Reference Gales, Bannister, Findlay, Zerbini and Donovan2011). The change in group size is attributed to the order and timing in which animals migrate (Best, Reference Best2007; Barendse et al., Reference Barendse, Best, Thornton, Pomilla, Carvalho and Rosenbaum2010). Females with yearlings generally migrate from Antarctica towards the South African coast first, followed by young and mature adults, and then by pregnant females (Best, Reference Best2007). A similar sequence is thought to occur on the southward migration back towards Antarctica, where females with new calves leave SA waters later in the season (Barendse et al., Reference Barendse, Best, Thornton, Pomilla, Carvalho and Rosenbaum2010).
Putative foraging was observed for M. novaeangliae (with calves) during November, and in two incidences this was associated with larger groups of four to six individuals. The dolphins and gannets were also recorded foraging in the area at the same time. Laws (1977) suggested that opportunistic foraging occurs when appropriate food is available, and this possibly functions to store extra blubber reserves for lactation and migration. This is most likely why opportunistic foraging takes place in Algoa Bay. Observations of more extensive austral feeding areas have been recorded in Saldanha Bay and off Cape Columbine (Findlay & Best, Reference Findlay and Best1995; Barendse et al., Reference Barendse, Best, Thornton, Pomilla, Carvalho and Rosenbaum2010).
The near-absence of B. brydei calves in this study is similar to other studies along the SA coastline (Penry, Reference Penry2010). The low numbers of calves could reflect a low birth rate or, alternatively, the presence of preferred habitats outside of the survey area, which have yet to be identified (Penry, Reference Penry2010). Sightings of two or more animals were associated with foraging in fish aggregations, together with several marine bird species and, on two occasions, with T. aduncus and D. capensis. Similar observations of up to five animals have been reported from other locations off the South African coast and from New Zealand (Wiseman, Reference Wiseman2008; Penry, Reference Penry2010).
Tursiops aduncus sightings had a wide range of group sizes, ranging from one to ~500 individuals, with an average of 52 animals. Larger groups were generally associated with the MPA, where a wide variety of behaviours were observed, including socializing and foraging. Previous observations in Eastern Cape waters recorded a mean group size of 67 individuals (Cockcroft & Ross, Reference Cockcroft and Ross1990). Reisinger & Karczmarski (Reference Reisinger and Karczmarski2010) also reported groups ranging from 25 to over 500 animals. However, significantly smaller groups have been observed in other parts of the world, averaging 5–12 individuals (Möller et al., Reference Möller, Allen and Harcourt2002; Lukoschek & Chilvers, Reference Lukoschek and Chilvers2008).
The smallest odontocete groups were recorded for S. plumbea. The mean group size of three individuals was similar to that observed in Hong Kong waters (Jefferson, Reference Jefferson2000), and on the south-western coastline of SA (Vinding et al., Reference Vinding, Bester, Kirkman, Chivell and Elwen2015), and in land-based surveys carried out in Algoa Bay (Koper et al., Reference Koper, Karczmarski, du Preez and Plön2016). However, group sizes averaging seven individuals were recorded in Algoa Bay in the 1990s (Karczmarski, Reference Karczmarski1999), and up to 14 individuals per group have been recorded along the southern African coastline (Karczmarski et al., Reference Karczmarski, Cockcroft and McLachlan1999; Guissamulo & Cockcroft, Reference Guissamulo and Cockcroft2004).
Smaller group sizes might be indicative of a reduced food supply within the habitat, as smaller groups tend to reduce competition for prey where prey is distributed over smaller patches (Gowans et al., Reference Gowans, Würsig and Karczmarski2007; Koper et al., Reference Koper, Karczmarski, du Preez and Plön2016). The present study also indicates a shift in the dominant activities of this species, with foraging and travelling activities changing from 64 and 24%, respectively (Karczmarski & Cockcroft, Reference Karczmarski and Cockcroft1998), to 32 and 30% (in this study). A decrease in foraging activities was also observed by Koper et al. (Reference Koper, Karczmarski, du Preez and Plön2016), and this together with an increase in travelling time may be indicative of a reduced prey availability. It may also indicate that S. plumbea distribution has shifted to other suitable habitats along the southern African coastline, resulting in a decline in sightings in Algoa Bay. Alternatively, the decrease in group sizes and number of sightings compared with those of the early 1990s could be indicative of a decline in population size.
One calf or juvenile was observed per group in the majority of S. plumbea sightings, with the exception of three calves and four juveniles in the group of 23 individuals. Many of these calf sightings were also observed in summer, which agrees with previous and current reports of the peak calving season (Karczmarski, Reference Karczmarski1999; Karczmarski et al., Reference Karczmarski, Cockcroft and McLachlan1999; Vinding et al., Reference Vinding, Bester, Kirkman, Chivell and Elwen2015).
Delphinus capensis were observed in a wide range of group sizes in Algoa Bay, with the largest group encompassing ~800 animals. This species is known to have extremely large groups in comparison to other delphinids, with other studies recording means of 302–619 individuals (Cockcroft & Peddemors, Reference Cockcroft and Peddemors1990; Weir et al., Reference Weir, MacLeod and Calderan2009; O'Donoghue et al., Reference O'Donoghue, Whittington, Dyer and Peddemors2010). These large groups were frequently recorded foraging in bait balls, or travelling to and from areas of high prey density, an observation that has been recorded in other parts of the South African coastline (Best et al., Reference Best, Butterworth and Rickett1984; O'Donoghue et al., Reference O'Donoghue, Whittington, Dyer and Peddemors2010).
Habitat preference in relation to environmental features
Almost 150 of the 500 sightings were recorded within 2 km of rivers, reefs and islands. These environmental features provide optimal locations for local prey abundances, which could attract cetaceans to these areas in the Bay (Baumgartner et al., Reference Baumgartner, Mullin, May and Leming2001). Bait balls were recorded offshore of the Swartkops River Mouth, where B. brydei and D. capensis were recorded foraging, which would support this concept.
The majority of E. australis mother-calf pairs, which comprised a large portion of the total sightings, were associated with sheltered and shallow habitats in the Bay. This is in agreement with other studies, which also noted that this species avoided more exposed areas along the coast (e.g. Best et al., Reference Best, Peddemors, Cockcroft and Rice2001; Elwen & Best, Reference Elwen and Best2004; Vinding et al., Reference Vinding, Bester, Kirkman, Chivell and Elwen2015). Mother-calf pairs potentially utilize these shallow areas to avoid interactions with other animals of the same species, which could result in possible injury to the calf or interruption of suckling, or to avoid predators (Elwen & Best, Reference Elwen and Best2004).
Megaptera novaeangliae were sighted throughout Algoa Bay in both coastal and more offshore areas, with a preference for habitats associated with bathymetric features, such as islands and reefs. However, this preference for certain habitats within the Bay was not as clearly defined as in other studies, where only one or two preferred areas were occupied within a study area (Mignucci-Giannoni, Reference Mignucci-Giannoni1998). Unlike M. novaeangliae off Puerto Rico, which were primarily recorded in sheltered areas (Mignucci-Giannoni, Reference Mignucci-Giannoni1998), a high number of sightings in this study were observed along the relatively open Alexandria Dunefield coastline. The majority of humpback whale sightings in Algoa Bay were detected in waters greater than 20 m deep, which is similar to sightings of the species in Mozambique and on the south-western coastline of SA (Findlay et al., Reference Findlay, Best, Peddemors and Gove1994; Vinding et al., Reference Vinding, Bester, Kirkman, Chivell and Elwen2015). These results suggest that perhaps the coastal nature of this survey has only recorded a relatively small percentage of the total population that inhabit deeper waters. However, Ersts & Rosenbaum (Reference Ersts and Rosenbaum2003) also recorded mother-calf pairs in shallower waters compared with adult groups.
The inshore form of B. brydei is thought to reside on the west and southern coastlines of South Africa within the 200 m isobath (Best et al., Reference Best, Butterworth and Rickett1984; Best, Reference Best2001). In Algoa Bay, B. brydei were observed in waters of an average of 32 m, which is deeper than the habitat favoured by other cetacean species. This supports the findings by Best (Reference Best2001) and Vinding et al. (Reference Vinding, Bester, Kirkman, Chivell and Elwen2015) that this species does not have an inshore distribution, and illustrates that the coastal nature of this survey would probably only include the shallow parts of their habitat.
Balaenoptera brydei preferred two areas within Algoa Bay: between Cape Recife and Riy Banks, and offshore of the Swartkops River mouth (Figure 3). These whales forage year-round and undergo small-scale migrations to follow prey (O'Callaghan & Baker, Reference O'Callaghan and Baker2002; Penry, Reference Penry2010), and this is probably the determining factor for the choice of habitat in Algoa Bay. For example, the area east of Cape Recife consists of an underlying substrate of coral and rock, with relatively steep bottom topography, which could contribute to higher prey densities in the area (Robinson et al., Reference Robinson, Tetley and Mitchelson-Jacob2009). Several bait balls were recorded in the area offshore of the Swartkops River mouth. Both B. brydei and D. capensis are known to feed on sardines and other pelagic fish (O'Donoghue et al., Reference O'Donoghue, Whittington, Dyer and Peddemors2010; Penry et al., Reference Penry, Cockcroft and Hammond2011). Thus, the association of these two species with these bait balls suggests that these species are feeding on the same prey and will follow prey as it moves inshore.
Tursiops aduncus were commonly observed in the shallow, inshore waters of Algoa Bay, which concurs with previous findings by Ross et al. (Reference Ross, Cockcroft, Melton and Butterworth1989) (Algoa Bay), and Vinding et al. (Reference Vinding, Bester, Kirkman, Chivell and Elwen2015) (south-western Cape). The presence of T. aduncus in Algoa Bay could be described as part of a ‘coastal corridor’, with sightings occurring up to 30 m depth (Shirakihara et al., Reference Shirakihara, Shirakihara, Nishiyama, Iida and Amano2012). However, T. aduncus have also been recorded further offshore, and/or associated with bathymetric features, such as canyons and escarpments (and the associated higher prey densities) (Best, Reference Best2007; Reeves & Brownell, Reference Reeves and Brownell2009). This potentially explains the number of observations recorded at Riy Banks reef. However, more offshore surveys would be needed to confirm the presence of these animals in deeper waters in the Bay. These offshore surveys could also indicate whether there are both offshore and inshore forms of T. aduncus present in the Bay.
The highest density of T. aduncus sightings in Algoa Bay were observed along the coastline east of Sundays River mouth, past 26.17oE. Tursiops aduncus are known to utilize group size and structure to achieve maximum foraging efficiency (Campbell et al., Reference Campbell, Bilgre and Defran2002), and the coastal waters associated with the Alexandria Dunefield are considered to be areas of high productivity (Webb & Wooldridge, Reference Webb and Wooldridge1990). In some surveys, dolphins were frequently seen in groups of more than 100 animals, with groups extending over several kilometres, with no distinguishable beginning or end. Thus, the large group sizes and high relative abundance of T. aduncus observed could be due to an adequate and predictable supply of food in this region, as suggested by Ross (Reference Ross1984). These sightings were also most common in winter and spring, which is possibly due to the higher abundance of suitable prey in the Bay during these months. This would also indicate a possible shift in their range as higher numbers were observed in austral summer/autumn along the south-western coastline of SA (Vinding et al., Reference Vinding, Bester, Kirkman, Chivell and Elwen2015).
Sousa plumbea were observed at similar depths as recorded by Karczmarski et al. (Reference Karczmarski, Cockcroft and McLachlan2000). Other studies have also recorded these animals within one km of the coast in waters less than 50 m deep (Atkins et al., Reference Atkins, Pillay and Peddemors2004; Parra, Reference Parra2006; Vinding et al., Reference Vinding, Bester, Kirkman, Chivell and Elwen2015). The highest densities of sightings were found along the inshore areas of the rocky coastline between PE Port and Cape Recife. This is the same area identified previously as a key (preferred) habitat for S. plumbea in Algoa Bay (Karczmarski et al., Reference Karczmarski, Cockcroft, McLachlan and Winter1998). Whereas previously almost all of the sightings were found south of PE Port (L. Karczmarski, personal communication; Karczmarski et al., Reference Karczmarski, Cockcroft and McLachlan1999), a number of sightings in this study were also found between the two ports and along the Alexandria Dunefield. This is unusual, as this area is less sheltered from currents, and is an extensive sandy area, whereas previous literature has indicated that this species occupies rocky shores (due to prey distribution) and sheltered locations (Atkins et al., Reference Atkins, Pillay and Peddemors2004; Parra et al., Reference Parra, Schick and Corkeron2006). In contrast, Vinding et al. (Reference Vinding, Bester, Kirkman, Chivell and Elwen2015) found that S. plumbea preferred sandy areas in close proximity to estuaries, suggesting that they might feed off a variety of prey depending on availability.
Delphinus capensis were sighted further offshore in this study, at an average depth of 32 m. O'Donoghue et al. (Reference O'Donoghue, Whittington, Dyer and Peddemors2010) recorded similar depths along the east coast of South Africa; however, sightings in other locations have been in water depths of ~100–200 m (Findlay et al., Reference Findlay, Best, Ross and Cockcroft1992; Hammond et al., Reference Hammond, Bearzi, Bjørge, Forney, Karczmarski, Kasuya, Perrin, Scott, Wang, Wells and Wilson2008).
Key findings
This study contributes valuable knowledge on spatio-temporal distribution of cetaceans in Algoa Bay through dedicated research across all common species. There is now new insight on habitat use within the Bay, using GIS as a tool to examine patterns and visually display the results. Since search effort could not be evenly distributed across the study area, results were standardized per unit effort (either time or distance) to allow for a true indication of preferred habitat and area. This study also illustrated the value in collecting sighting data from different sources, as there was a large overlap in the distribution of the dedicated survey data and opportunistic sightings observed, both spatially and temporally. Key findings are outlined below.
Eubalaena australis are more prolific in the Bay than originally estimated in studies during the 1980s and 1990s, which coincides with a general population increase along the South African coastline. Eubalaena australis also use Algoa Bay as a nursery area, especially along the more protected areas on the eastern shoreline. On two occasions, M. novaeangliae were recorded foraging in bait balls, a behaviour that is not usually attributed to this migratory species on their breeding grounds. There has been a decline in S. plumbea and a shift in their seasonal occurrence patterns in Algoa Bay compared with a previous study in the 1990s, which is of concern to this species which is designated as ‘Endangered’ (Plön et al., Reference Plön, Atkins, Conry, Pistorius, Cockcroft, Child, Child, Roxburgh, Do Linh San, Raimondo and Davies-Mostert2016). Both of these species also preferred a narrow shallow stretch of water along the coastline, which places them at increased risk to being displaced or affected by anthropogenic activities. Combined with the low population numbers of the S. plumbea, this species should be protected as a matter of urgency (Karczmarski, Reference Karczmarski2000). Sightings of S. plumbea were recorded along the exposed, sandy shore areas of the Bay, which is in contrast to their known habitats and their use of this habitat should be explored further.
These results also demonstrate the value of a site-specific study, which takes into account a multitude of species. The large number of sightings in the proposed AENP MPA illustrates the value of such marine conservation zones. The prevalence of foraging T. aduncus in this ‘no fishing zone’ (as per MPA regulations) also facilitates the conservation of populations of prey species which could also play an important role in the conservation of S. plumbea. This species appears to face increasing threats regarding the availability of food within their habitat range along the coastline.
The number of sightings in the shipping areas also gives an indication of the predominant threats to cetaceans in the Bay. The number of E. australis sighted in these zones is a cause for concern as these same areas were used for important behaviours, such as mating. Balaenoptera brydei tended to avoid the research vessel, suggesting that increasing disturbance may significantly impact this species. Therefore, both of these species would be particularly susceptible to ship strikes in the study area, which would have both economic and ecological consequences. Other risks include entanglement, whale watching or harassment by vessels, and the pollution and destruction of the coastal zone.
In summary, this multi-species research approach has provided important information for conservation and management of cetaceans in view of ongoing and future developments in coastal areas, resulting in the recommendations outlined below.
Cetacean habitat preferences in Algoa Bay
Several habitat preferences have been highlighted for cetaceans in Algoa Bay based on the results of this study (Figure 8). Kernel density analyses were run to ascertain densities of cetacean numbers (using group size) (see Supplementary material). The associated effects of pollution, and commercial recreational activities in the Bay, combined with the knowledge on the spatial and temporal distribution of certain species and their proximity to rivers and bathymetric features, can be mitigated in the future, especially if these areas have been identified as important habitats for individual species. Habitat preferences for cetaceans in Algoa Bay include:
1. The proposed AENP MPA: This MPA potentially protects several preferred habitats used by cetaceans. The MPA incorporates areas where a large proportion of mother-calf pairs of E. australis and M. novaeangliae were observed, as well as opportunistic foraging by M. novaeangliae. Tursiops aduncus was also recorded in very high numbers in the MPA, where a large proportion of the foraging and socializing behaviour was exhibited by this species.
2. The Bird Islands and St Croix Islands: Tursiops aduncus was frequently sighted around these two island groups, often exhibiting foraging behaviour. The Bird and St Croix Islands are already exclusion zones for all fishing activities, and further research should be conducted to establish the density of prey using this area.
3. Riy Banks reef: Cetaceans were frequently sighted at this shallow, offshore reef. It is one of the harder areas to monitor due to the reef's position on the edge of the Bay, where it is more exposed to oceanic winds and currents. Reefs are often associated with high prey densities (Baumgartner et al., Reference Baumgartner, Mullin, May and Leming2001). In Algoa Bay, commercial fishing activities associated with the reef will potentially have a negative effect on the cetaceans using the area as a foraging site. Some mysticetes (e.g. M. novaeangliae) possibly use the reef as a landmark for navigation when travelling along the edge of the escarpment, between the two headlands (Melly, Reference Melly2011).
4. South-western part of Algoa Bay: The south-western area of the Bay is a preferred habitat for both mysticetes and odontocetes. Eubalaena australis were commonly seen around PE Port, where a large proportion of mating behaviour was observed. Another habitat preference lies south of PE Port, for both T. aduncus and S. plumbea.
In conclusion, this study contributes to several important findings for spatio-temporal patterns of cetacean habitat use. The proposed AENP MPA and the Bird Island MPA play an important role in conserving cetaceans in Algoa Bay, with a large proportion of preferred habitats falling within the protected areas. The area offshore of Swartkops River mouth and Riy Banks should also be examined in more detail to determine the degree of importance of these two areas. The habitat preferences provide insight into future research areas on which species are under increasing threat from coastal pollution and an increase in shipping traffic.
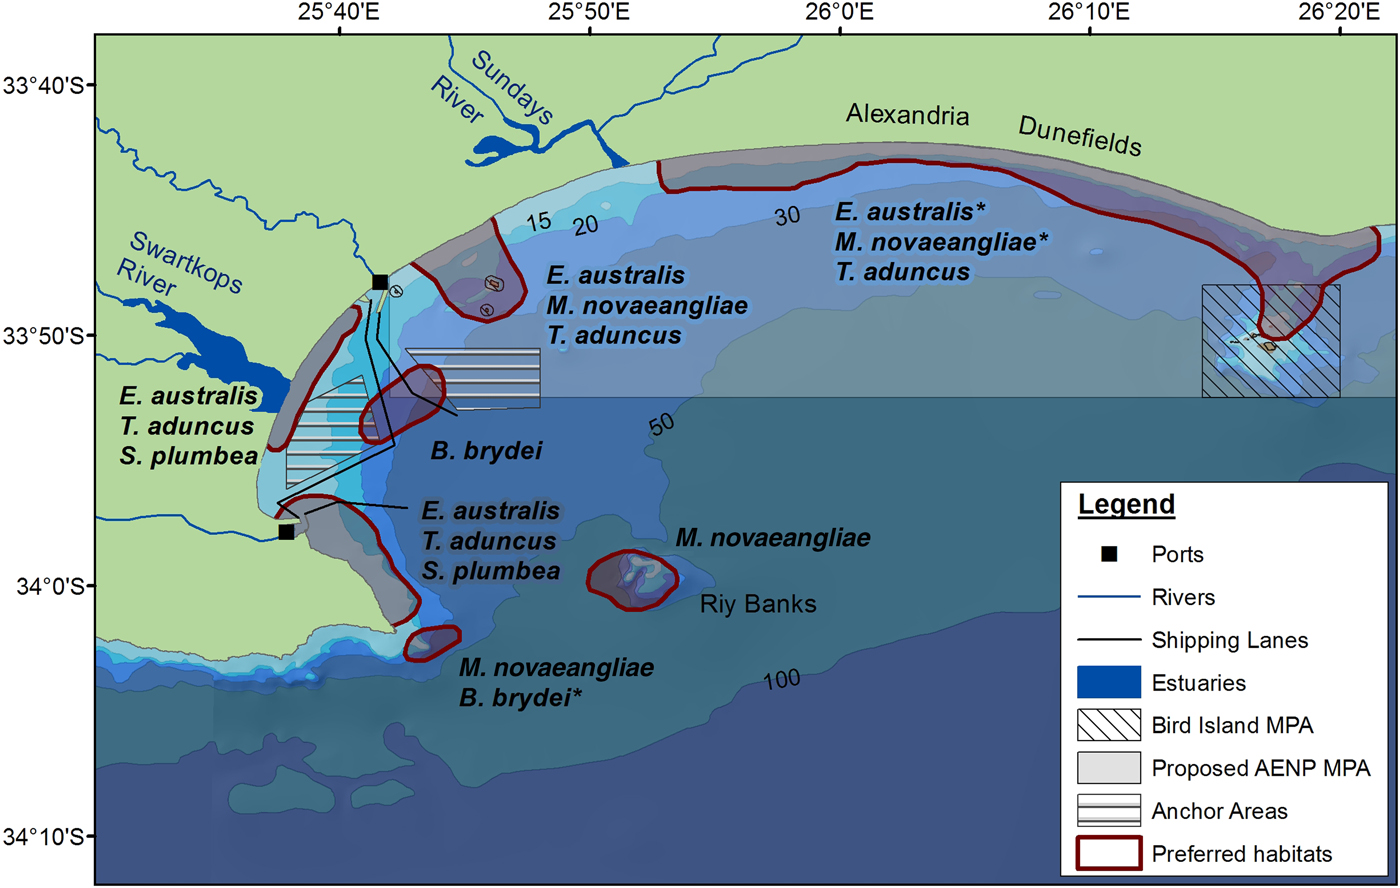
Fig. 8. Locations of habitat preferences for the cetaceans in Algoa Bay. An asterisk indicates that the area(s) are habitats that are potentially preferred for a particular species.
SUPPLEMENTARY MATERIAL
The supplementary material for this article can be found at https://doi.org/10.1017/S0025315417000340
ACKNOWLEDGEMENTS
We would like to thank the South African National Hydrographic Office (SANHO), the South African Weather Service (SAWS) and SANParks for access to data. Thank you to the many volunteers who helped with the surveys and Morven Maclean for skippering the research vessel when needed. Special thanks to a number of colleagues who helped with various stages of the study: Meredith Thornton, Katja Vinding Petersen, Tess Gridley, Michelle Bradshaw, Tony Martin and Tony Booth.
FINANCIAL SUPPORT
Funding for this study was provided by the Marine Living Resources Fund (MLRF) from Marine and Coastal Management (now the Department of Environmental Affairs: Oceans and Coasts) and South African National Parks (SANParks) through grants to S. Plön (Grant number: MCM2008082800003). Funding for B. Melly was received from the National Research Foundation (NRF), the Andrew Mellon Scholarship and the South African Environmental Observation Network (SAEON).