


We would like to thank Lanna & Riesgo (Reference Lanna and Riesgo2019) for their commentary on our recent publication on larval nutritional mode and swimming behaviour in ciliated marine larvae. They raised interesting points regarding the specificities of sponge larval behaviour, and we appreciated their addition of new records to the dataset. However, we wish to reiterate that the main objective of our original paper (Montgomery et al., Reference Montgomery, Hamel and Mercier2019) was to highlight general patterns of larval swimming capacity among a broad suite of taxa exhibiting different nutritional modes and adult motility levels. Some simplifications and generalizations were required to identify these broad patterns. For instance, rather than studying whether the larvae of different species swam on a continuous basis or not, we focused on their swimming capacity, i.e. maximum achievable speeds. We agree that specific larval behaviours (including but not limited to intermittent vs steady swimming) are pertinent to dispersal studies, not only for sponges but for all taxa (Robins et al., Reference Robins, Neill, Giménez, Jenkins and Malham2013; Nanninga & Berumen, Reference Nanninga and Berumen2014). Our own body of work has been adding to this line of inquiry, including ontogenetic behavioural shifts (Montgomery et al., Reference Montgomery, Hamel and Mercier2017, Reference Montgomery, Hamel and Mercier2018), predation rates on propagules (Mercier et al., Reference Mercier, Doncaster and Hamel2013) and settlement preferences of competent larvae (Mercier et al., Reference Mercier, Battaglene and Hamel2000; Mercier & Hamel, Reference Mercier and Hamel2009; Sun et al., Reference Sun, Hamel and Mercier2010). However, the analyses in Montgomery et al. (Reference Montgomery, Hamel and Mercier2019) were centred on the mechanistic aspects of swimming in ciliated larvae and aimed to dispel long-standing assumptions about capacities in planktotrophs vs lecithotrophs (which was made clear in the title).
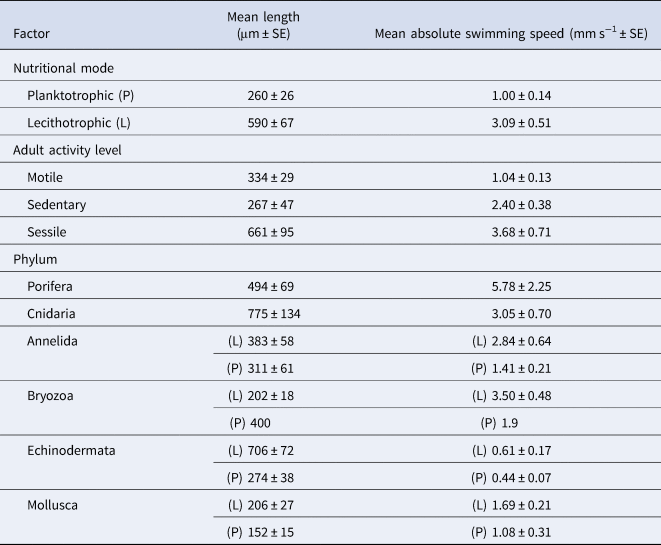
We have taken this opportunity to re-examine the original dataset in light of the conversion errors identified by Lanna & Riesgo (Reference Lanna and Riesgo2019), in addition to recalculating the relevant statistics using the new records they provided (Table 1). A total of six conversion errors were identified and corrected (out of the 161 records), two duplicate records were removed, and references were also updated in the supplementary file (S1). The main findings of our original paper remain unchanged with these corrections and adjusted statistics (Figures 1–4). Overall, lecithotrophic propagules swim faster than planktotrophic propagules (ANOVA P = 0.003); two clusters are identified from the hierarchical cluster analyses (FAMD, HCPC P < 0.001); species with sessile or sedentary adults have larvae that swim faster than larvae from motile adults (ANOVA, P < 0.001); and lecithotrophic larvae demonstrate a greater capacity for faster swimming speeds at a given size than planktotrophic larvae (ANCOVA P < 0.001). Moreover, Porifera larvae still display the fastest mean swimming speed (5.78 mm s−1; Figure 1), although they are now statistically in a similar range as Bryozoa (3.30 mm s−1) and Cnidaria (3.05 mm s−1) and significantly faster than Annelida, Mollusca and Echinodermata larvae based on the adjusted values (Table 1, Tukey HSD P = 0.8 (Bryozoa), 0.2 (Cnidaria) and <0.01 (all others)).

Fig. 1. Mean propagule swimming speed (mm s−1 ± SE) varies among phyla and larval nutritional modes. Phylum Cnidaria and Porifera only have one bar as these taxa only have one larval nutritional mode. Error bars are present where more than one record per phylum and category were available. See Table S1 for raw data.
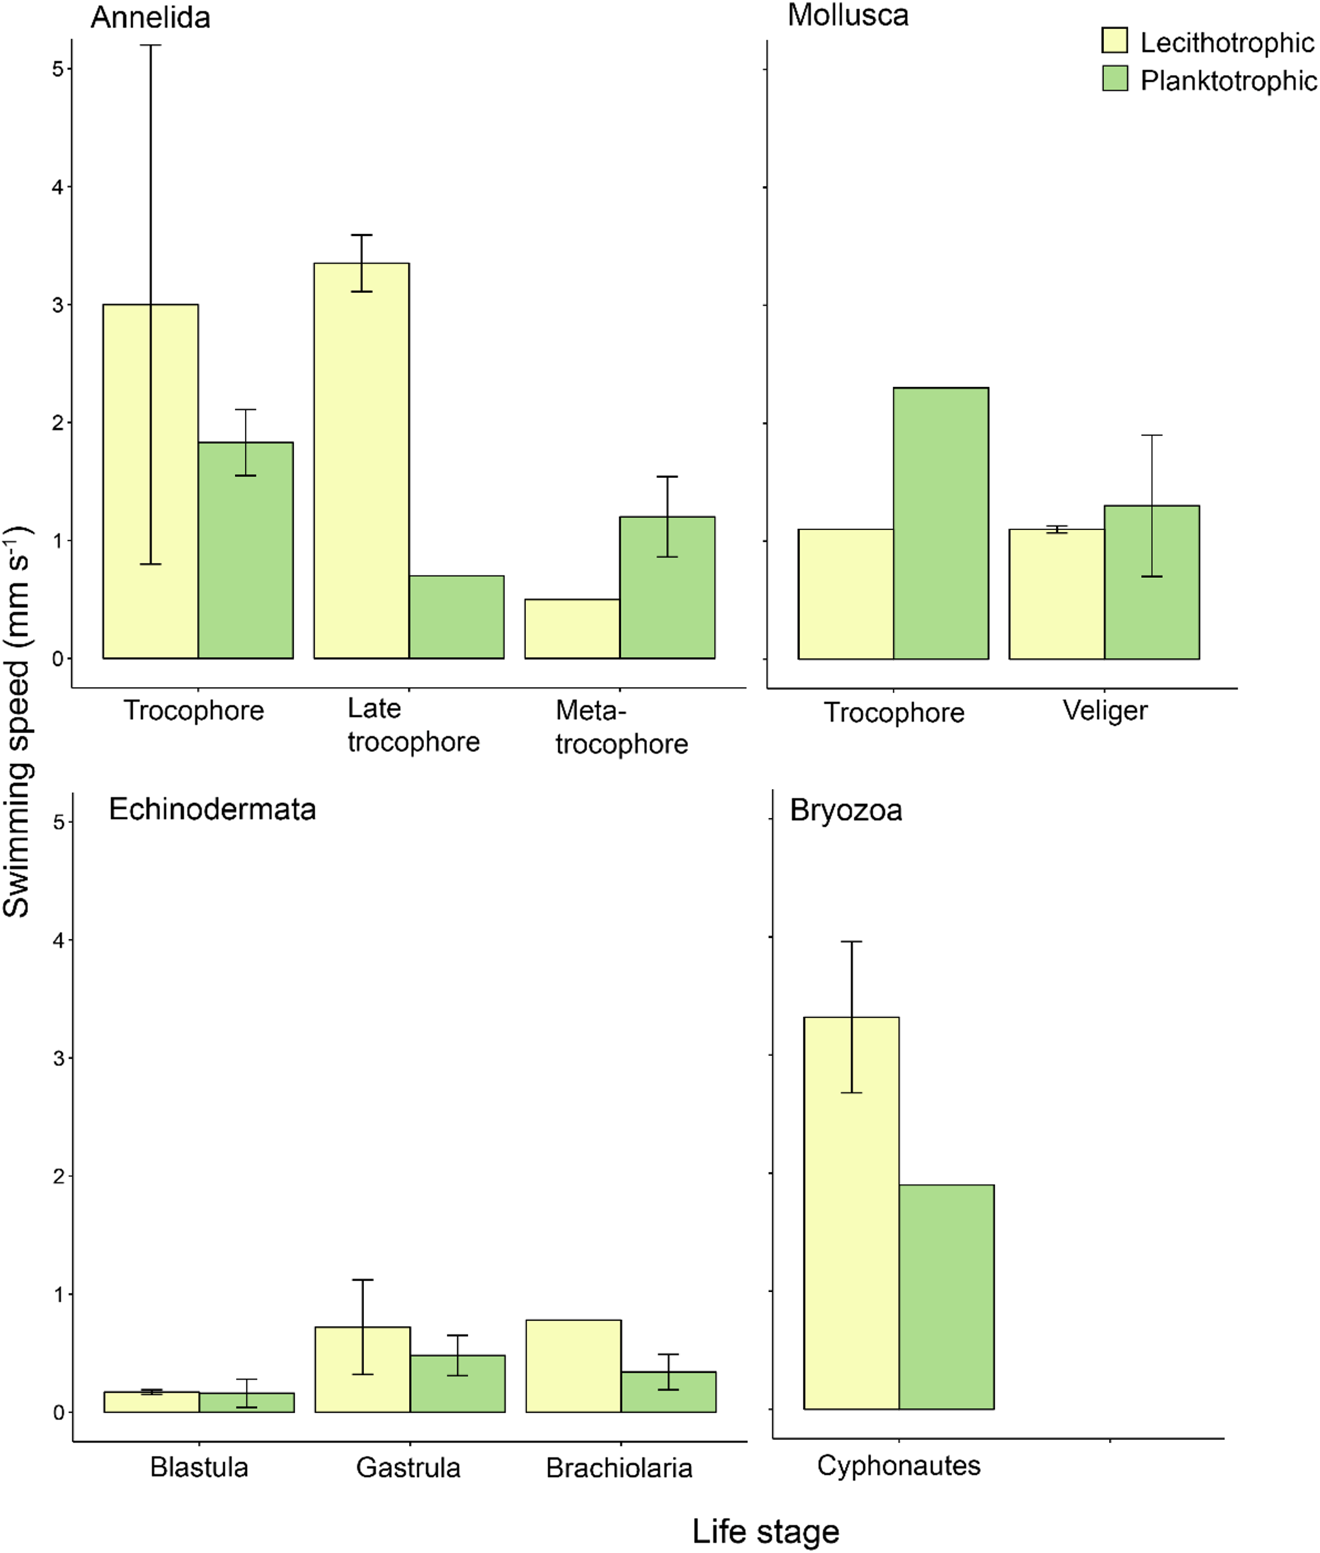
Fig. 2. Mean propagule swimming speed (mm s−1 ± SE) of specific life stages varies with nutritional mode. Taxa and life stages presented here had both planktotrophic and lecithotrophic representatives in the dataset. Error bars are present where more than one record per phylum and category were available. See Table S1 for raw data.
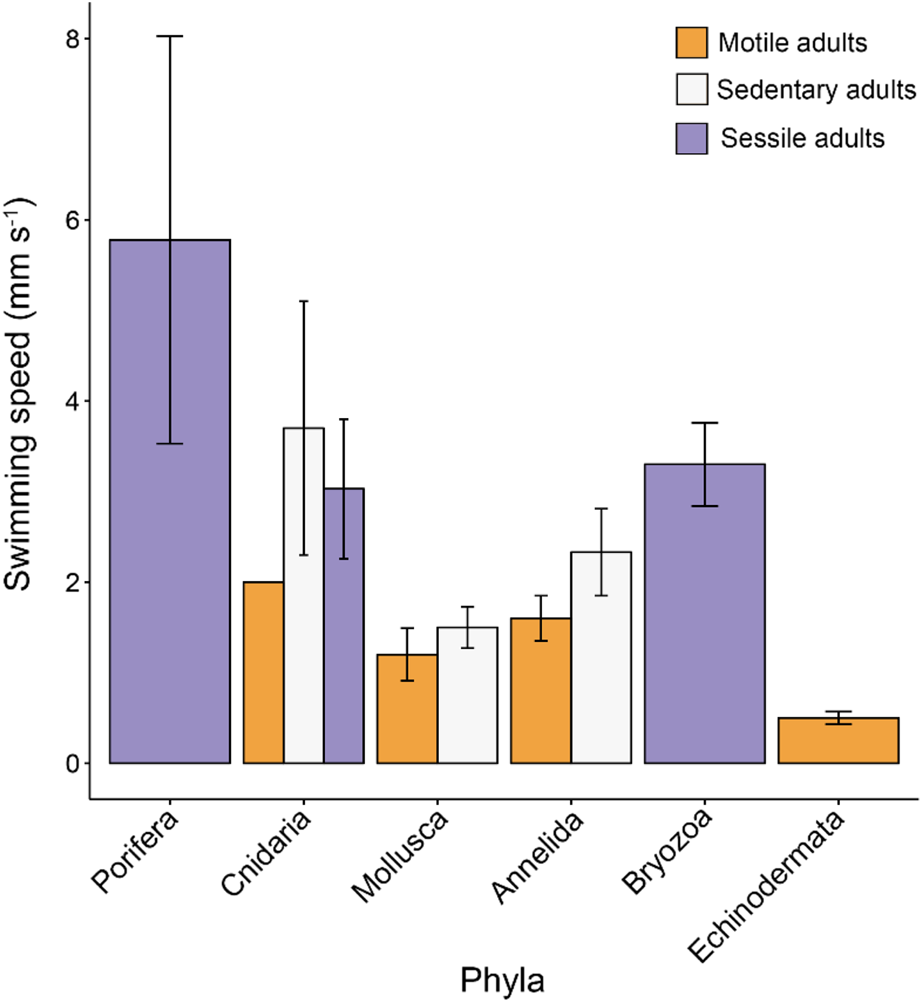
Fig. 3. Mean propagule swimming speed (mm s−1 ± SE) varies with taxa and level of adult mobility. Sessile adults are incapable of movement, sedentary adults have the capacity to move but do so rarely and motile adults move readily and often. Error bars are present where more than one record per category were available. See Table S1 for raw data.
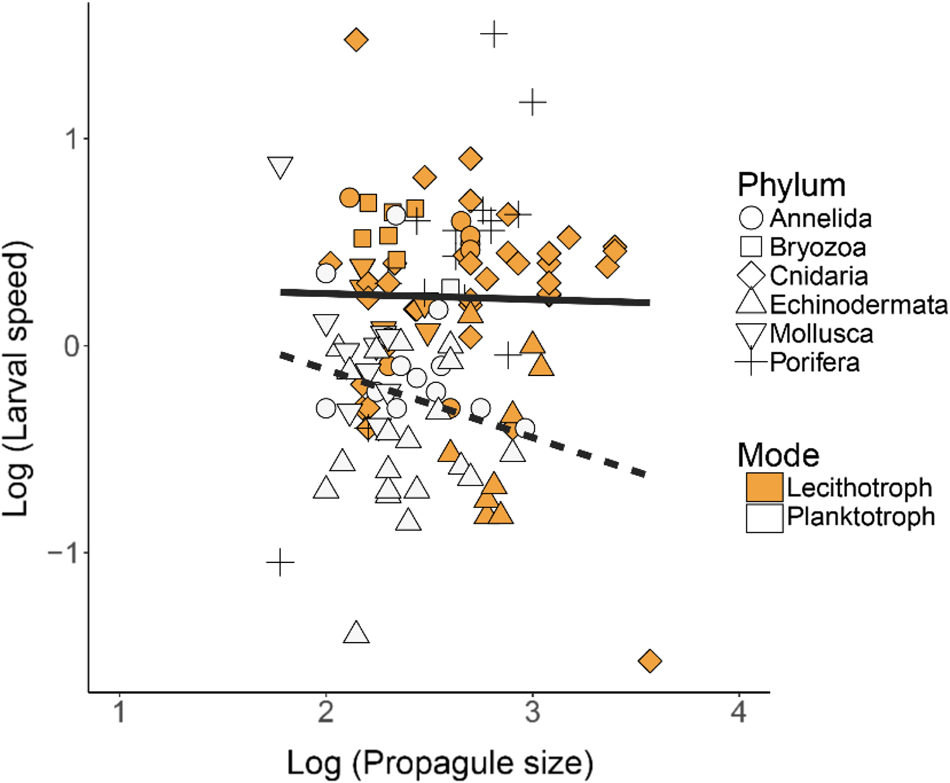
Fig. 4. Larval swimming speed (mm s−1) vs propagule body size (μm) in lecithotrophic and planktotrophic larvae of various phyla (Porifera, Cnidaria, Mollusca, Annelida, Echinodermata, Bryozoa) on log10 scales. Log scales were used to examine scaling relationships across a wide range of propagule sizes and speeds. Points represent mean values for individual species. Symbols depicting the various phyla are either solid/open to indicate the lecithotrophic/planktotrophic larval feeding mode (except for Porifera, which is fully lecithotrophic and identified with +). N = 125 total records. The solid lines show regression results. Planktotrophs: y = −0.33x + 0.54, R 2 = 0.04; Lecithotrophs: y = − 0.03x + 0.31, R 2 = <0.01.
Table 1. Updated mean length and swimming speed summarized across the two larval nutritional modes and six phyla featured in the dataset (Supplementary material S1)
Supplementary material
The supplementary material for this article can be found at https://doi.org/10.1017/S0025315419001139.


