


Introduction
For over a decade aberration-corrected scanning transmission electron microscopy (AC-STEM) has proven essential in the study of nanomaterials [Reference Varela1]. Nanomaterials are essentially assemblies of atoms arranged in such a way that they can serve important new applications. Considering their small size, it would not be surprising that subtle changes in the atomic structure can significantly impact functionality. For such systems, spherical AC-STEM employing a field-emission electron source is an essential tool for probing atomic-level structural modifications in nanomaterials.
The manner in which a collection of atoms assembles into a designed architecture is a critical topic. Equally important, however, is ensuring the generated structures fall within the nano-regime [Reference Schmid2], a range of dimensional confinement in which materials exhibit non-bulk-like properties. There are two approaches to achieving this goal: top-down and bottom-up. The former generally requires the removal of material to the point where it is finely dispersed, relying heavily on physical alteration of the host material. Techniques toward this end are laser ablation, sputtering, and lithography, to name a few [Reference Siegel3]. Challenges to this approach are the inability to finely control the formed structures, leading to polydispersity. Equally as important is the fact that not all nanomaterials are made of a single element so compositional control at atomic-length scales becomes important. Barring use of homogeneous multicomponent bulk systems for a desired product, compositional control poses a significant challenge for the top-down approach. Lastly, a major hurdle in this approach is finding the technologies necessary for commercial-scale production.
The bottom-up approach begins with a series of dispersed atoms and amasses them to form a desired architecture. This approach relies more on chemically driven responses toward nanoscale assemblies. Environmental factors, such as temperature, pressure, oxidizing or reducing conditions, and reagent concentration, can all be used to drive the modification of atomic structure [Reference Schmid2]. There are several advantages to this approach, the first of which is the versatility in terms of the products that can be made. Particles of a certain composition, at an appropriate temperature and pressure, can reach a metastable nanostructural state. Employing thermodynamic concepts, one can encourage specific changes by modifying key environmental factors. By imposition of chemical factors (presence of O2, acids, etc.), one can further assemble a structure for a specific purpose. From an industrial standpoint such a result is highly desirable since it offers the possibility of customer-specific products and is more compatible with large-scale production of materials.
Current efforts aim to track functional nanostructure formation starting from dispersed atomic states. In this article we present a few case studies documenting how a modified atomic structure can impact functionality. The first case considers Pt/γ-Al2O3, a widely used industrial catalyst, and examines the H2 reduction process by which the material is activated. Next this study is extended to a bimetallic system (Pt-Re/γ-Al2O3) and evaluates the use of less pure H2 during the reduction process. Then transition metal sulfide nanostructures (WS2) are analyzed to evaluate their development as atoms self-assemble to form ordered sheet-like nanostructures. Lastly, we impose a post-treatment on these sheets to modify their edge-structure.
Materials and Methods
Sample preparation
Samples were prepared by grinding to a powder as-received commercial catalyst pills (Pt/γ-Al2O3 and Pt-Re/γ-Al2O3, separately). Powders were deposited directly on 200 mesh holey carbon Nylon grids (Pacific Grid Tech) for imaging and elemental analyses. The transition metal oxide/sulfide system (WOx → WS2) was received in the form of a powder, which was embedded into an Epon epoxy matrix. After curing, the epoxy pellets were microtomed to 70–90 nm thin-sections and loaded onto holey carbon Nylon grids.
Methodology
Pt/γ-Al2O3 in its inactive form (oxide) was loaded onto a Protochips Aduro thermal e-chip in situ specimen holder. The specimen holder was heated (via thermal e-chip) in an ex situ reactor to 500°C where the reactor supplied the flowing H2 for several time intervals (5, 15, 30, 60, and 90 minutes). After each reduction period the sample in its holder was removed from the reactor and inserted into a microscope for analysis. After STEM analysis, the sample was re-inserted into the reactor for further reduction (Figure 1). Images and analyses were acquired from the same locations after each reduction step.
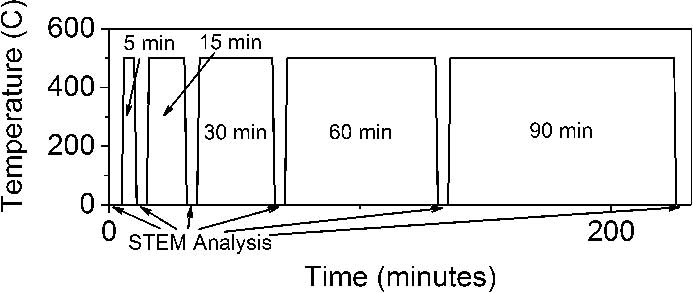
Figure 1 Temperature profile outlining reduction scheme used for the Pt/γ-Al2O3 sample.
For the metal oxide/sulfide, the initial oxide powder was divided into four parts. One part was left as an oxide, and the other three were inserted into a sulfiding apparatus and sulfided up to different temperatures (200°C, 310°C, and 413°C). After the sulfidation treatment the samples were embedded, microtomed to thin-sections, and loaded into the microscope.
Electron microscopy
With the exception of the Pt/γ-Al2O3 sample, which was examined in a Cs-corrected JEOL 2200FS at 200 keV in STEM mode, all samples were examined in a Cs-corrected Titan 80−300 electron microscope equipped with ChemiSTEMTM (FEI Company) technology. Imaging was conducted at 200 keV in STEM mode using a Fischione model 3000 high-angle annular dark-field (HAADF) detector with inner and outer cutoff angles of 40 and 200 mrad, respectively. The electron probe was focused to 0.8 Å, and the beam dosage at the specimen was 50 e/Å2 ·s. Nanoparticle diameters were determined taking the average of every possible diameter that traverses the center of a particle between two tangent points. Atom, dimer, trimer, and particle counting was done manually for a series of images collected at the same magnification. Perimeter to area (P/A) ratio measurements for metal sulfide nanostructures were obtained by measuring the boundary lengths of individual nanostructures and integrating the area that was bound within.
The ChemiSTEM package comprises a high-brightness field-emission source (X-FEG Schottky) for enhanced beam current and four 30 mm2 silicon drift detectors (SDDs) (Bruker Corp.) integrated into the objective lens for a total collection solid angle of 0.7 sr. Elemental analyses of individual nanoparticles was done by point analysis using a defocused electron probe to minimize beam damage. Collection times were no longer than 20 s to avoid beam damage. Both the Lα and Lβ X-ray lines were used for Pt and Re quantitative analysis.
Results and Discussion
Pt/γ-Al2O3
Many nanomaterials contain a precious metal (Au, Ag, Pt, Pd, etc.) in their formulation. The drawback associated with the use of Pt is the expense associated with it. Maximizing the dispersion of the metal (fraction of Pt atoms on the particle surface) then becomes important in order to offset its cost. The Pt/γ-Al2O3 catalyst, used in the production of petrochemicals and transportation fuels, is a widely studied system. In its inactive state, the Pt is in the form of oxidized, dispersed, single Pt atoms bound by O atoms. The source of this O is from both air and the O atoms on the γ-Al2O3 support forming Pt-O bonds. Activation of the material is achieved by subjection to H2, which helps break the Pt-O interaction and reduces the Pt+x species to Pt0 [Reference Mayers4].
To understand the reduction process, we used an ex situ approach: The fraction of Pt in the form of atoms (rather than clusters) was used to monitor completeness of reduction. Figures 2a and 2b show the changes in the numbers of single atoms (small circles), dimers (squares), trimers (triangles), and clusters (large circles) over the course of reduction. These results were quantified manually from 20 images per sample. Figure 2c shows that the number of single atoms decreases and stabilizes after approximately 30 min; whereas, the numbers of dimers and trimers remain unchanged. Figure 2d shows that the average number of particles stabilized, as does the average particle size (inset), after the same amount of time. From these data it appears that a large fraction of the single atoms are responsible for forming the larger reduced Pt particles. This is important because it indicates that perhaps a way can be found to use less Pt in these formulations. Alternatively, these findings could be used to devise a method to maximize the effectiveness of the Pt present.
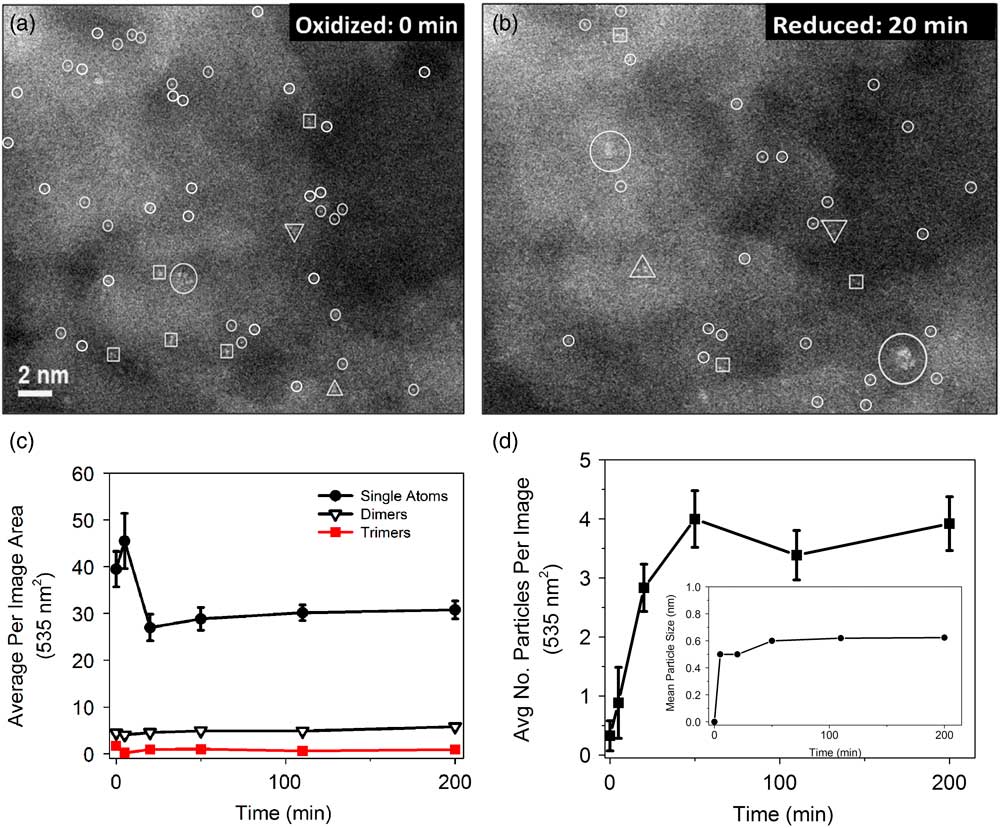
Figure 2 Atomic-resolution HAADF STEM images of Pt/γ-Al2O3 in the (a) oxidized and (b) reduced (20 min) state. Small circles, to help guide the eye, indicate single atoms. (c) Abundance of single atoms, dimers, and trimers as a function of reduction time. The mean particle size monitored as a function time is shown in (d). Inset in (d) is the average number of particles per image relative to the reduction time. Scale bar in (a) is applicable to (b).
Pt-Re/γ-Al2O3
We extend these findings to a bimetallic Pt-Re system where the addition of the secondary metal yields synergistic effects—these being either electronic via charge-transfer, the generation of moieties by the dilution of Pt by secondary metal, or the presence of the second metal effectively imposing its chemistry [Reference Sachtler and Somorjai5, Reference Doolin6]. As with Pt/γ-Al2O3, activation of this material can be achieved via reduction in H2. Several costs have to be factored into the preparation of a catalyst, of which one is the use of high-purity H2(g). A cost-saving technique practiced by some refiners utilizes Net Gas (a mixture of H2 and light hydrocarbon gases such as CH4, C2H6, CO, etc.) instead of high-purity H2 [Reference Doolin6]. The effect of Net Gas reduction on reforming catalysts is not known, although changes to catalytic behavior have been observed [Reference Doolin6].
Figure 3 shows a comparison of size distributions for the same batch of Pt-Re/γ-Al2O3 catalyst: one reduced by the standard method using H2 and the other using Net Gas. With Net Gas reduction, the most obvious difference was the presence of larger particles dispersed throughout the sample. This observation was reflected in the size-distribution histograms presented in Figure 3c. These results were reinforced at atomic resolution where the fraction of individual atoms of Pt and Re was higher for H2 reduction compared to Net Gas reduction (not shown). Compositional analysis of the metal sites, on the other hand, did not reveal significant differences between the two samples. Figure 3d shows broad distribution of compositions for individual particles in both samples with no obvious difference between them. The results indicate that the amount of Pt-Re interaction is equivalent regardless of the gas stream used during reduction. These data show a lower metal dispersion for the Net Gas treated sample without altering the composition of the metal particles. This would in all likelihood result in changes to catalytic performance. From a broader perspective this result stimulates interest as it opens doors toward performance-based customization of materials.

Figure 3 HAADF STEM images of Pt-Re/γ-Al2O3 reduced via (a) H2 and (b) Net Gas. (c) and (d) show distribution histograms comparing (c) nanoparticle size and (d) composition based on the reduction treatments.
Metal sulfides (WS2)
Transition metal sulfides are used as lubricants, electrocatalysts, and as catalysts in oil and gas refining. Functionality as a lubricant comes from the graphene-like sheet structures these metal sulfides adopt, which can intercalate amongst each other [Reference Xu7]. As catalysts, the edges of these sheet-like structures provide under-coordinated environments that are widely regarded as reactive centers that promote chemical reactions [Reference Bricker8, Reference Girleanu9].
Given the minute changes that can give rise to significant differences in catalytic performance, it is instructive to understand the structural development of these metal sulfides. Figure 4 shows the growth of WS2 nanostructures as they form from WOx (room-temperature oxide), sulfided in H2S/H2 a gas stream at 413°C, to become well-ordered, graphite-like sheets of WS2. Figure 4 shows the final product to be 2-dimensional sheets of WS2, where only W atoms are imaged under these conditions. The sheets appear to be terminated by faceted edges forming geometric-like shapes.

Figure 4 Atomic-resolution HAADF STEM images sampling WS2 nanostructure development during the ex situ sulfidation process at various temperatures. Arrows within images indicate locations of WS2 sheet-like structures.
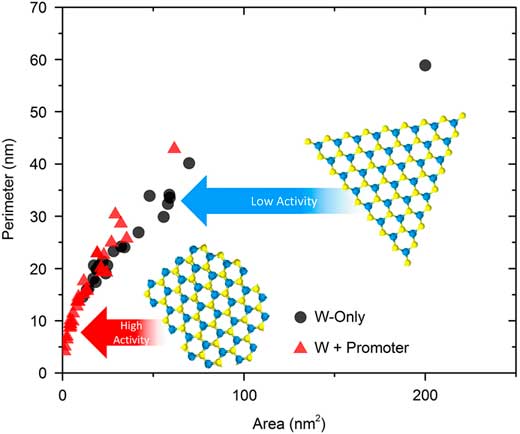
Since the edges of the sheets are considered to be the active sites [Reference Bricker8, Reference Girleanu9], it would make sense to maximize their frequency to advance performance. In the refining industry this WS2 phase is generally coupled with promoter species such as Ni (or Co) to improve activity [Reference Bricker8–Reference Kelly10]. Figure 5a is an atomic-resolution HAADF-STEM image of a WS2-only sample where the W atoms are seen in a triangular morphology. Figure 5b presents a Ni-promoted WS2 nanostructure where edge-sites have become populated with more discontinuities, consistent with literature reports [Reference Bricker8, Reference Girleanu9]. It has been proposed that edge-site modification stems from incorporation of the promoter atoms into the edge-structure. This observation is consistent with electron energy loss spectrometry (EELS) work done by others [Reference Zhu11] and can serve as indirect confirmation that the promoter species also modifies the sheet edge-structure, which in turn gives rise to enhanced catalytic behavior.
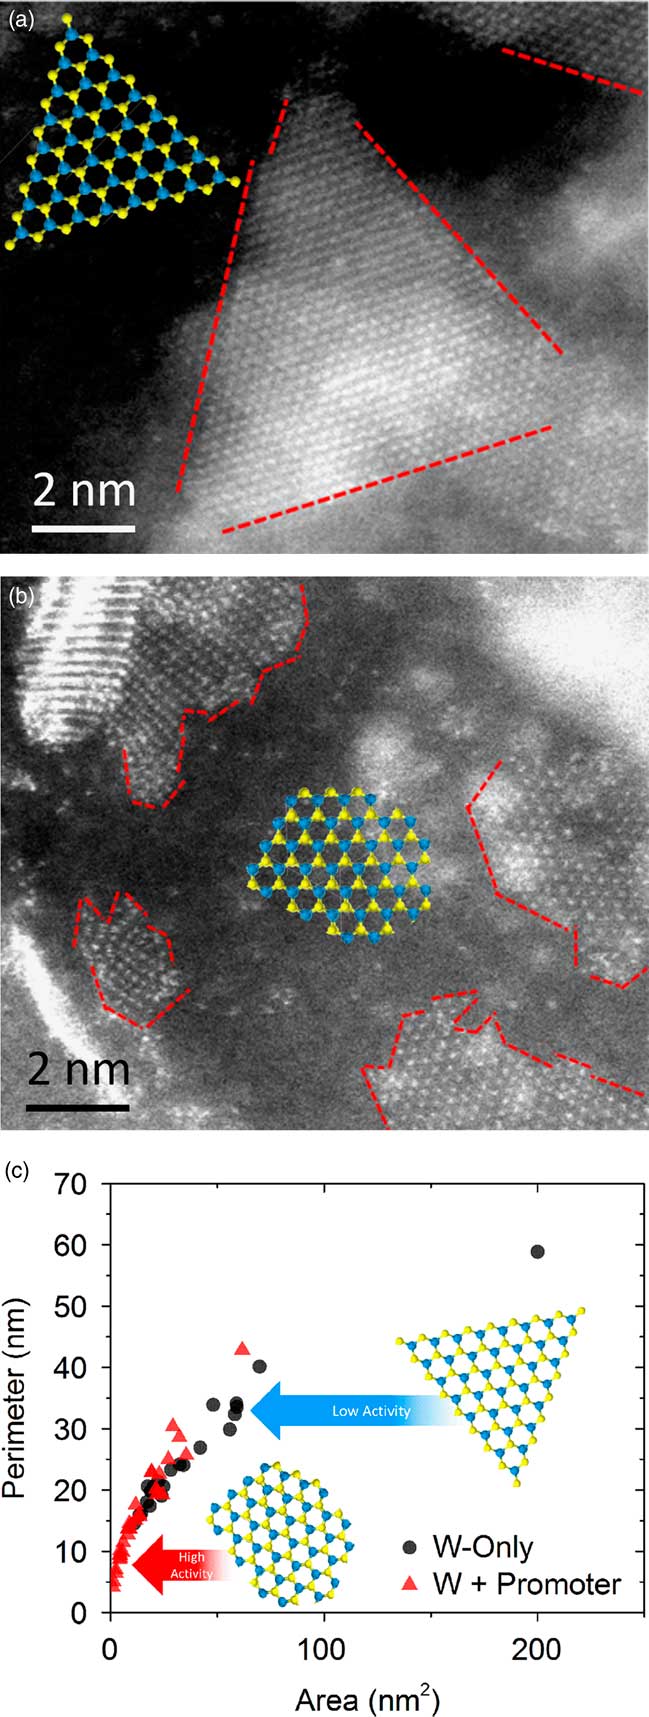
Figure 5 Atomic-resolution HAADF STEM images of (a) WS2 and (b) Ni-promoted WS2 nanostructures. Contrast is from W atoms only. Red dashed lines guide the eye to the edges of the sheet-like structures. (c) Plots of P/A ratios for the two samples. Blue and yellow DFT models of the metal sulphide structures indicate differences in edge-structure.
To quantitatively understand the change in dispersion, the perimeter (P) and area (A) were measured for a series of individual WS2 sheets. Presumably, if edge-sites are the active component of these nanomaterials [Reference Bricker8, Reference Girleanu9], then it follows that an increased dispersion (a higher P/A ratio) would be beneficial to performance. Figure 5 shows that the Ni-promoted sample has a higher P/A ratio indicative of more edge-sites. Literature reports observing the same structural phenomena [Reference Bricker8, Reference Girleanu9], coupled with internal testing results for these two catalysts, show clear improvements in yield and activity with promoter addition.
The next question is whether the performance benefits are chemical (associated more with the presence of a different elemental species) or physical (related to the structural modification) in nature. Toward this end, an attempt was made to understand whether a W-only sample with comparable P/A ratios to the W-Ni system could achieve similar performance. The idea would be that oxidation of the existing nanostructures would commence at the edge-sites, where bonding is most fragile, and gradually work inward. Oxidation using a O2 plasma treatment (PT) was employed. Figure 6 shows a side-by-side comparison of the sample (a) sulfided at 413°C and the same sample then (b) oxidized with a plasma treatment. Examination of the two images suggests that in Figure 6a the WS2 edge-structures formed facets with well-defined edges; whereas, in Figure 6b the subsequent plasma treatment resulted in several discontinuities in the edge-structure. Figure 6c shows a quantitative account of these findings, where P is plotted versus A for the two samples. Based on the different trajectories of the scatter, it can be surmised that the PT was effective at creating more under-coordinated edge-sites. This result supports the assumption that subjecting metal sulfides to PT, resulting in edge modifications similar to the Ni-promoted samples, could lead to performance gains similar to that of the promoted catalyst.
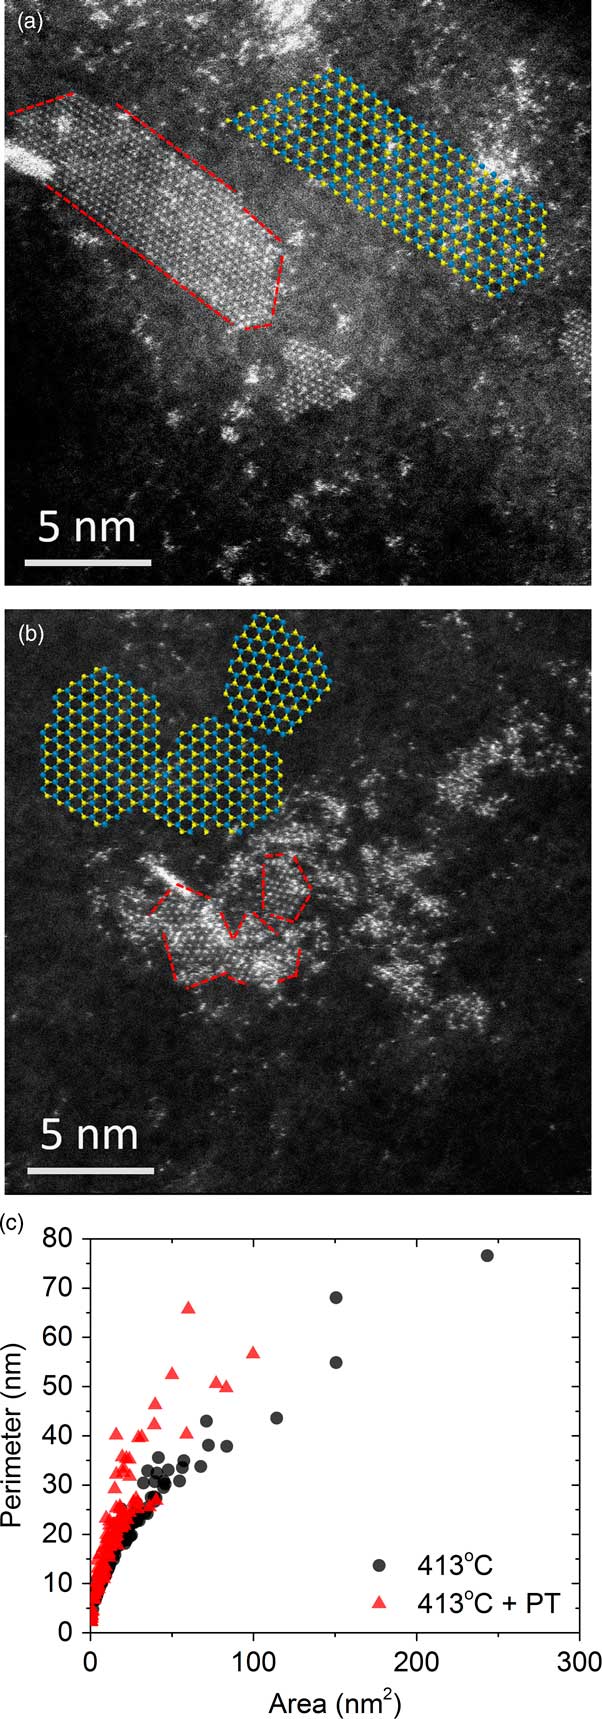
Figure 6 Atomic-resolution HAADF STEM images of WS2 nanostructures (a) sulfided at 413°C and (b) sulfided at 413°C + O2 plasma treatment. Contrast is from W atoms only. Red dashed lines guide the eye to the edges of the sheet-like structures. (c) Plots of P/A ratios for the two samples. Blue and yellow insets are DFT models of the metal sulfide, which indicate differences in edge-structure.
Conclusions
The findings in this article demonstrate important advances in nanomaterial processing and characterization. Multiple methods were shown to produce quantifiable modifications of nanomaterials at atomic-length scales. Documentation of these subtleties mandates that analyses be carried out with a probe-corrected field-emission STEM at a minimum. Collectively the data show how previously unperceivable, atomic-scale changes can lead to dramatic large-scale changes in catalyst performance. Furthermore we show several examples of nanostructure modifications that previously would have been unobserved and undocumented if not for advances in electron microscopy.
Acknowlegments
Research was supported in part by Oak Ridge National Laboratory’s Center for Nanophase Materials Sciences, which is sponsored by the Scientific User Facilities Division, Office of Basic Energy Sciences, U.S. Department of Energy.


