


Introduction
Cryo-electron tomography (cryo-ET) is an extremely powerful technique that allows studies of the cellular landscape at high resolution in a near-native state [Reference Grange1]. In cryo-ET, a vitrified cellular sample is imaged in a transmission electron microscope (TEM) as it is tilted from approximately -60⁰ to +60⁰. This results in a series of 2D images that can be combined to reconstruct a 3D volume referred to as a tomogram. This technique is powerful enough to resolve 3D structures of intracellular organelles and protein complexes within their cellular environment with sub-nanometer resolution [Reference Mahamid2,Reference Schur3]. Resolving structures in their cellular context at this level of detail is a groundbreaking advancement for structural and cellular biology. The combined knowledge of the location, interactions, and structure of a biomolecule is crucial to the understanding of its cellular function.
Cryo-FIB milling
In order to acquire cryo-ET data, samples should be thin enough to let electrons pass through without excessive scattering, as this can result in a drop in signal-to-noise ratio and, consequently, image blurring [Reference Marko4]. Sample thickness should ideally be between 100 and 300 nm, therefore, most cellular samples for in situ studies need to be thinned down. To do so, the use of a cryogenic focused ion beam with a scanning electron microscope (cryo-FIB/SEM) has become the gold standard. The FIB is used to mill away the surrounding material and create a thin cryo-lamella [Reference Wagner5,Reference Villa6].
Cryo-CLEM
When studying a specific cellular structure, identifying the region of interest (ROI) is a crucial step to mill a final lamella, which contains the structure of interest. To achieve this, cryo-fluorescence light microscopy (cryo-FLM) is often used to precisely localize the ROI and avoid off-target milling [Reference Mahamid2,Reference Rigort7,Reference Arnold8]. Using fiducial beads or cellular features as markers, the fluorescence signal can then be correlated to the FIB/SEM or TEM images in an approach commonly known as cryo-correlative light and electron microscopy (cryo-CLEM). The cryo-CLEM workflow, however, brings about numerous challenges. One of these challenges is sample transfer. The sample is usually imaged by cryo-FLM before FIB milling and can be inspected again with the cryo-FLM after milling to check for the presence of the ROI [Reference Klein9]. Both steps require sample transfer to and from the fluorescence microscope, increasing the risk of ice contamination and damage to the sample, as well as adding days of work to the already laborious process of cryo-ET sample preparation. Moreover, the process of correlative FIB milling is not an easy task. First, it requires markers for navigating to the correct spot on the sample and, even then, the correlation of the fluorescence and SEM images may not always be accurate enough, and the ROI could be missed. Second, sample movement and lamella bending can occur during FIB milling, which can result in the initial correlation no longer holding true and, in turn, the production of lamellae lacking the ROI despite a correct initial correlation.
Integrated cryo-CLEM
To overcome these challenges, in recent years, fluorescence imaging systems that can be directly integrated in the FIB/SEM chamber have been developed [Reference Gorelick10]. Here we present METEOR, a commercially available widefield FLM designed to be integrated directly into the FIB/SEM chamber. Having an FLM inside the cryo-FIB/SEM greatly reduces the amount of handling steps required, resulting in less contamination, less damage, and a more streamlined cryo-ET workflow. Furthermore, it allows for the easy inspection of the sample with FLM after the milling process, thereby improving the yield of the samples containing the ROI that end up in the cryo-TEM.
Application example: phase-separated compartments
Biochemical processes inside of the cell take place in a highly crowded and complex environment. For these processes to be executed correctly, cells need compartments and organelles to organize biological matter. Many compartments are separated from the cellular environment by membranes. There are also many membrane-less compartments that are known to form via protein phase separation. Recent work has revealed that phase separation plays a key role in a variety of other cellular processes and diseases like cancer and neurodegeneration [Reference Alberti and Dormann11–Reference Boeynaems13].
Wilfling et al. reported a selective autophagy pathway for phase-separated endocytic protein deposits in yeast [Reference Wilfling14]. In this pathway Ede1 acts as a selective autophagy receptor and mediates the phase separation of Ede1-dependent endocytic proteins into condensates (END condensates). By employing correlative cryo-ET they were able get a high-resolution understanding of the END condensates.
Materials and Methods
METEOR platform
METEOR is a top-down widefield FLM that can be integrated directly into a cryo-FIB/SEM. The objective lens of the FLM is placed parallel to the FIB column, allowing for easy switching between FIB milling and FLM imaging.
To allow fluorescence imaging inside the FIB/SEM chamber, the excitation and emission lights need to be guided in and out of the vacuum chamber. In Figure 1, the basic light path and the most important optical components that allow for in-vacuum imaging are depicted. The excitation beam from a LED light source is first guided to a dichroic mirror. The dichroic mirror reflects the excitation beam to a vacuum window. The vacuum window allows light to pass through the vacuum-to-air interface and is designed to fit on one of the existing ports of the FIB/SEM. METEOR can, therefore, be installed on a FIB/SEM without making permanent changes to the chamber. Inside the vacuum, the excitation beam passes through the objective, which is attached to an objective stage that is used for focusing of the objective on the sample and acquiring z-stacks. The travel range of the stage is 31 mm, so the objective can be retracted to above the pole piece when the user has finished using METEOR to allow for full FIB/SEM stage movement. The emitted light from the sample is guided back through the vacuum window to the dichroic mirror. The emission beam passes through the dichroic mirror, and an emission filter in the filter wheel blocks unwanted wavelengths from reaching the detector. The remaining light beam passes through to the camera, forming an image. The filter wheel contains four slots, and the filters are customizable according to fluorescence labels of choice.

Figure 1: A) Illustration of METEOR (in black) installed on a FIB/SEM (in blue). B) Schematic representation of the light path of METEOR. The excitation light (blue) is guided from the light source to the dichroic, through the objective and to the sample. The emission light is guided back from the sample through the objective, then the vacuum window, and through the filter wheel to finally reach the camera and form an image.
Software
To improve the user-friendliness of the system we also developed dedicated software named ODEMIS for METEOR. This intuitive, open-source software allows the user to control all the FLM settings as well as the FIB/SEM sample stage. The user can easily navigate the sample, while maintaining focus, and effortlessly switch between SEM, FIB, and FLM imaging modes.
Integrated workflow
METEOR is a flexible system that can be used in a variety of workflows. For example, it can be used to guide on-the-grid lamella milling of a plunge-frozen sample (Figure 2). In this workflow, the user loads the sample in the cryo-FIB/SEM equipped with METEOR. The microscope stage is moved to the METEOR position, and a stitched overview image is acquired to find ROIs and determine the milling sites. Z-stacks are acquired at these positions for the purpose of correlation. The sample stage is then moved to the FIB/SEM position to capture a SEM image. The images are correlated to determine the precise milling location, and the user can start FIB milling a lamella. During and after lamella milling, the stage can be moved to the FLM position to check if the fluorescence from the ROI is still present in the lamella.
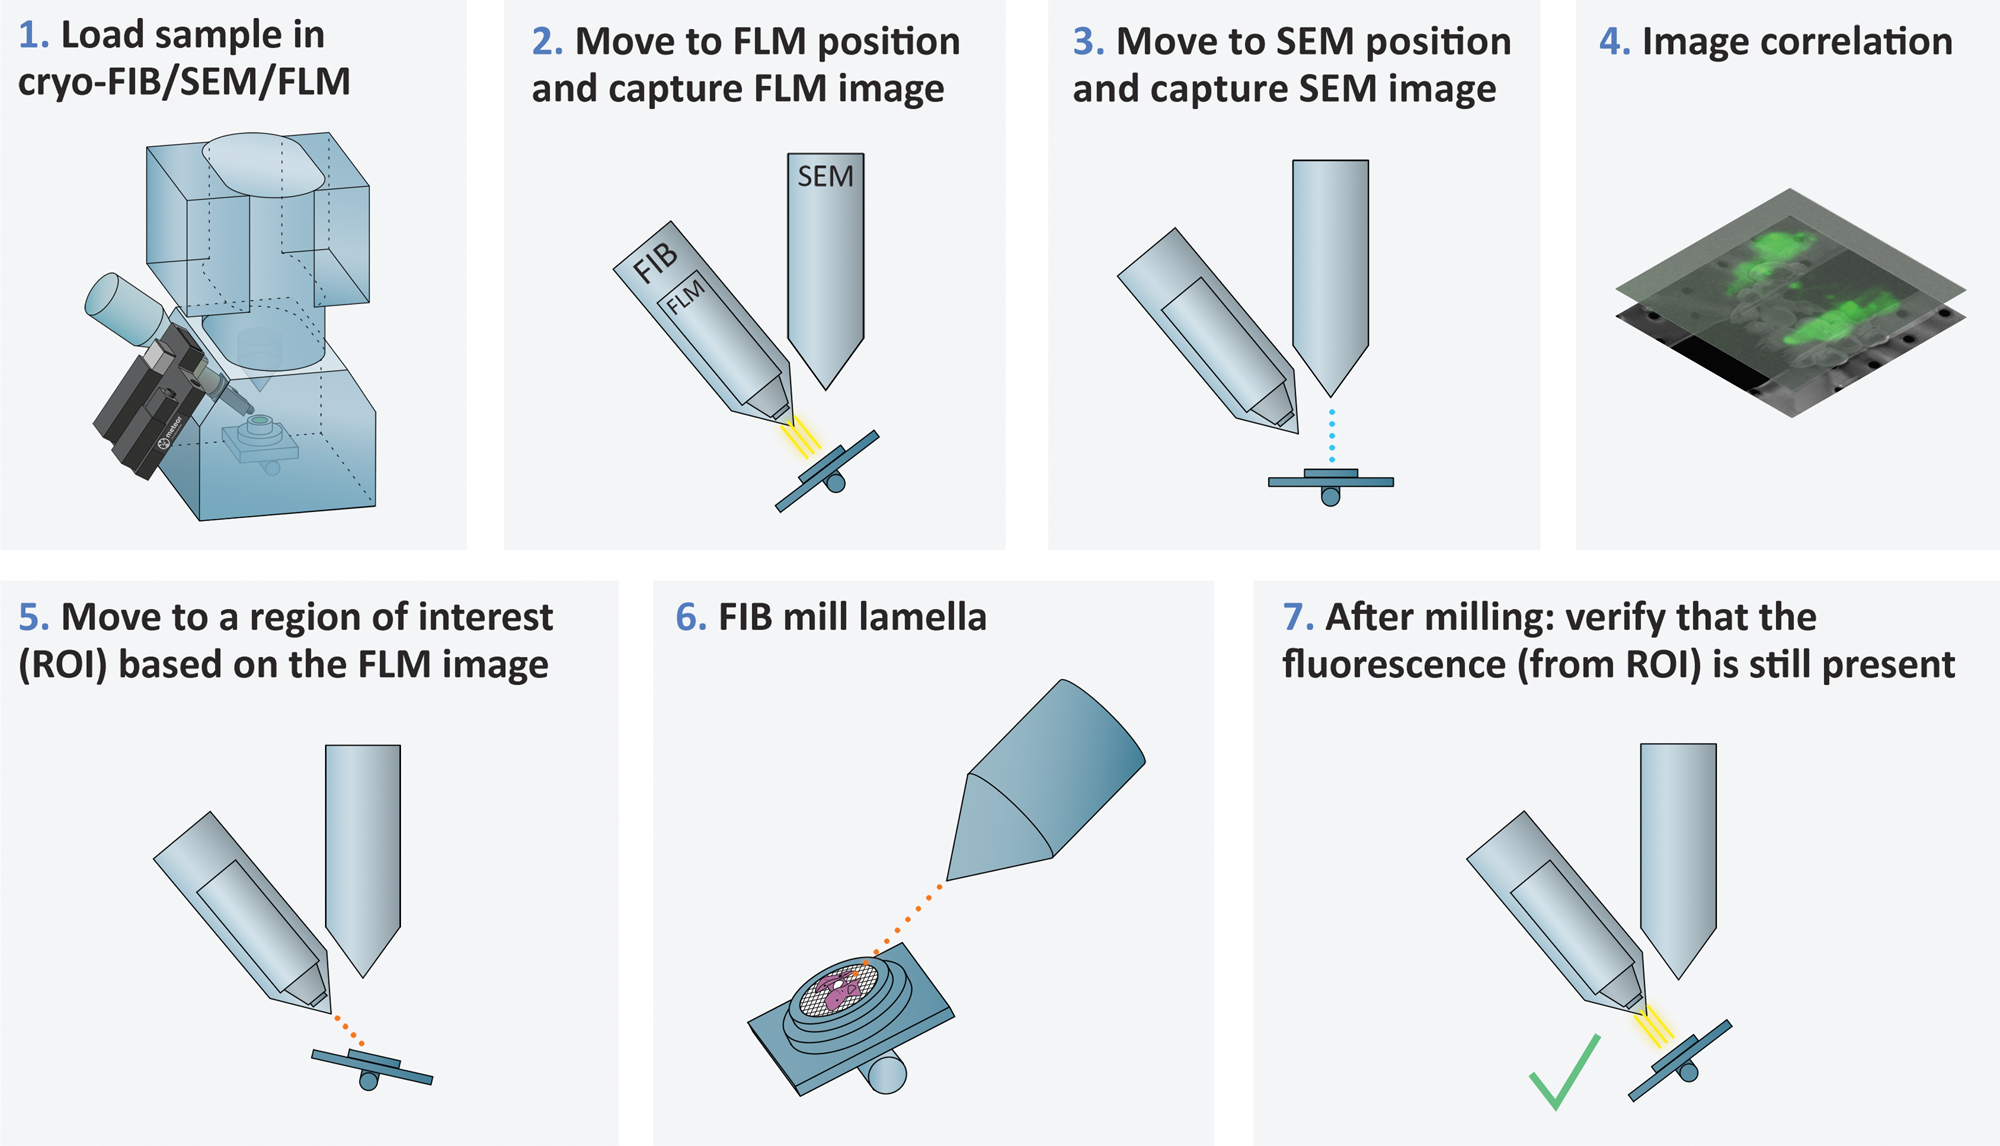
Figure 2: An example of a workflow where METEOR is used to guide on-the-grid lamella milling of a plunge-frozen sample.
To demonstrate this integrated workflow, we prepared targeted cryo-lamellae from Saccharomyces cerevisiae (yeast).
Sample preparation
We used a yeast strain where eGFP-tagged Ede1 was overexpressed to enable targeted lamella milling. To enhance correlation efficiency between FLM and FIB/SEM imaging, we supplemented the cell suspension with fiducial markers (Dynabeads™). The cells were then applied to a TEM grid and plunge-frozen.
Correlative cryo-FIB milling
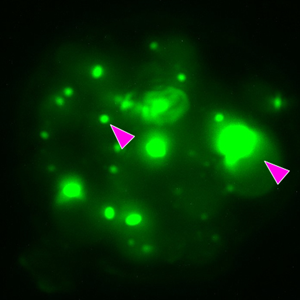
To obtain an electron-transparent cell section containing the ROI, correlative cryo-FIB milling was used. The grids were transferred to a Scios FIB/SEM equipped with a cryo-stage (Thermo Fisher Scientific). To protect the samples during the milling process, the samples were first coated with an organometallic platinum layer using a gas injection system needle. Next, clusters of yeast cells suitable for FIB milling and containing END condensates were identified using METEOR. The END condensates appear as bright green puncta (Figure 3). Fluorescent image z-stacks of promising regions were acquired and correlated with SEM images. Lamellae were cut at correlated sites as described in published protocols [Reference Wagner5,Reference Schaffer15]. During milling, lamellae were inspected using METEOR to check if the END condensates were still present. After the final polishing step, the lamellae were inspected using METEOR to confirm the presence of END condensates before transferring the sample to the cryo-TEM.

Figure 3: Three different steps of correlative cryo-FIB milling workflow using integrated FLM. The sample was imaged before milling at 2.2 μm and at 250 nm lamella thickness using different imaging modalities (FLM, ion beam, and electron beam). (A–C) Maximum intensity projections of FLM z-stacks (objective: Olympus LMPLFLN 50X/0.5, LED excitation of 484 nm, and a 525/30 nm emission filter). Pink arrows indicate the two ROIs. (D–F) Electron beam images (HV: 5 kV, current: 13 pA, det: ETD). (G–I) Ion beam images (HV: 30 kV current: (G) 10 pA, (H) 0.1 nA, (I) 50 pA, t: 1 μs, det: ETD). Scale bar, 5 μm.
TEM imaging
Tomograms were recorded on a Titan Krios 2 cryo-TEM (FEG 300 kV, Thermo Fisher Scientific) with a post-column energy filter (20 eV slit, BioQuantum™, Gatan), and a direct detector camera (K2 Summit®, Gatan) operated in dose fractionation mode. The TEM images of milled grid squares were overlaid on the maximum intensity projection (MIP) of the FLM stacks acquired on the final lamellae using the Landmark Correspondences plug-in in Fiji [Reference Saalfeld16]. The correlation was used to determine locations for tomogram acquisition. Tilt series were acquired with a dose-symmetric tilt scheme (2° steps, between -50° and 70° to compensate for lamella pre-tilt (11°)). Total dose was ~120 e- / Å2) at a pixel size of 3.52 Å using SerialEM [Reference Mastronarde17]. The data were processed with TOMOMAN [Reference Wan18] using MotionCor2 for frame alignment [Reference Zheng19]. Tilt series alignment and tomogram reconstruction were performed in IMOD [Reference Kremer20], and tomograms were denoised using CryoCARE [Reference Buchholz21].
Results
Guided lamella milling
METEOR was used to guide lamella milling from the yeast strain overexpressing eGFP-Ede1 previously characterized by Wilfling et al. [Reference Wilfling14]. Since we used an integrated FLM we were able to monitor the fluorescence level of the ROI throughout the milling process. In Figure 3 we show electron beam, ion beam, and FLM images at different stages of lamella milling, starting with the identification of the ROI (Figure 3A, 3D, 3G), a control during milling (Figure 3B, 3E, 3H), and the final image after polishing (Figure 3C, 3F, 3I). The pink arrows indicate that the fluorescent signal is maintained during milling, indicating that the ROI is present in the final lamella. We were thus able to confirm that the END condensates were present, and the lamella was good enough to transfer to the cryo-TEM.
Guided tomography
The grid was transferred to the cryo-TEM, and the lamella was found using a low-magnification EM setting. To determine the region of tomogram acquisition, a FLM/TEM overlay was performed (Figure 4A). Based on this overlay the region of tomogram acquisition was chosen. The ROIs were vitreous, proving that in situ FLM imaging, even after fine milling, did not devitrify the lamella. The tomograms also revealed several structural properties of the END condensates and their surroundings, allowing for a better understanding of their structural organization. The condensates form a distinct assembly with a teardrop-like shape close to the plasma membrane. There is a striking exclusion of ribosomes, and the endoplasmic reticulum (ER) surrounds the END condensate (Figure 4B). For further reading on the END condensates and the role of Ede1, we refer to the study of Wilfling et al. [Reference Wilfling14].

Figure 4: Correlative cryo-ET. A) TEM lamella overview image overlaid with a maximum intensity projection of the FLM z-stack. The image shows the two bright puncta corresponding to eGFP-Ede1 signal present in the lamella. B) A 2D section of the denoised tomogram taken at the highlighted region in A, showing the END condensate at the plasma membrane surrounded by the ER and close to a lipid droplet (LD). Scale bar, A) 5 μm, B) 200 nm.
Discussion
We have shown how an integrated FLM can be used to guide on-the-grid lamella milling. Since METEOR is a flexible system, we expect that it can be applied to a wide range of other workflows and applications.
Automated lamella milling
In recent years, several methods have been developed to automate lamella milling [Reference Zachs22–Reference Tacke24]. These methods significantly decrease the user interaction time and increase the throughput of the microscope. It would be advantageous if in this process the ROIs could be selected automatically based on FLM images. This would allow automatic creation of lamellae that include rare events that can only be captured using FLM. An integrated FLM provides this opportunity since the images are captured using the same sample stage. Moreover, it provides the opportunity to include an automatic check after milling to confirm the ROI is present in the lamella and it is worthwhile to image in the cryo-TEM.
High-pressure frozen samples
We have shown how an integrated cryo-CLEM system can streamline the on-the-grid lamella workflow. This workflow is limited to small cells, while studying the biomolecular interaction in tissue and multi-cellular organisms can give even more physiologically relevant information. To process these thick samples, additional steps are required such as lifting out a chunk of material [Reference Schaffer25–Reference Parmenter27]. These workflows are more error prone, and finding the ROI is even harder [Reference Parmenter and Nizamudeen28]. Therefore, the application of an integrated FLM to streamline this process will be very beneficial.
Super resolution
Currently METEOR provides FLM imaging at diffraction-limited resolutions using a LED light source and widefield illumination. Breaking the diffraction limit barrier can improve the lamella targeting accuracy, as well as bridge the resolution gaps between the FLM and TEM data. Several cryo-super-resolution FLM methods have already been described in the literature and demonstrated various resolution-enhancing factors [Reference Tuijtel29–Reference Phillips31]. The next challenge will be to develop an integrated cryo-super-resolution system.
Conclusion
We have shown how an integrated FLM system such as METEOR can be used effectively to study biological processes with correlative FIB-milling and cryo-ET. We have demonstrated that METEOR can be used to accurately target ROIs for lamella milling. Moreover, it is easy to reinspect the sample with FLM after the milling process, confirming the ROI is present in the lamella and thereby improving the sample yield. We also showed that imaging a thin lamella with an integrated FLM does not cause devitrification or damage to the structure of interest.
Acknowledgements
The yeast strain was provided by Florian Wilfling (Max Planck Institute for Biophysics, Frankfurt, Germany). Anna Bieber was supported by a Boehringer Ingelheim Fonds PhD fellowship. The METEOR development work is supported by the European SME2 grant number 879673 – Cryo-SECOM Workflow.


