Introduction
Fluorescence microscopy has been prevalent for more than a century [Reference Renz1] and the introduction of fluorescent probes has allowed for highly selective targets to be labeled and imaged with high sensitivity. The major advantage of fluorescence microscopy has been the ability to visualize these selective targets against a dark background, which has revolutionized the field of cell biology [Reference Lichtman and Conchello2]. As such, it is not surprising that modern fluorescence microscopy is a foundational tool in most research laboratories. The discovery of green fluorescent protein (GFP) [Reference Shimomura3], the use of GFP as a genetic beacon [Reference Chalfie4], and the development of fluorescent proteins with an array of colors [Reference Shaner5–Reference Wiedenmann8] have allowed researchers to use microscopy to observe fluorescently tagged proteins functioning in situ in living systems [Reference Galdeen and North9–Reference Wang19].
During the fluorescence process, secondary photo-physical processes can lead to the generation of reactive oxygen species (ROS), which can cause fluorophores to photo-bleach and can be photo-toxic to living systems. The basic fluorescence process itself is inefficient in that a considerable dose of light must be imposed on the system to achieve a significant emission of fluorescence light from the fluorophores [Reference Magidson and Khodjakov20]. In many cases the light dose delivered to living samples can be quite damaging and can create abnormalities in biological processes and cellular physiology [Reference Magidson and Khodjakov20]. Additionally, a cell can be more susceptible to photo-toxicity if that cell is already exposed to stress factors such as transfections, knockdowns of key proteins, or even changes in the pH of the cell culture medium [Reference Magidson and Khodjakov20].
Light photo-toxicity can manifest in several forms. Photons in the UV range, for example, are widely known mutagens that are implicated in a number of toxic effects, most notably in DNA damage [Reference Pattison and Davies21]. Infrared light may also cause damage because of the potential for highly localized heat when focusing the incident light on the sample. These problems can be minimized by using fluorophores in the visible light region of the spectrum and by using modern solid state or light emitting diode (LED) light sources that do not emit energy in the UV or IR range. However, photo-toxicity can still arise with visible light wavelengths in the generation of ROS, which can react with proteins, lipids, and other cellular components that can be oxidized [Reference Hoebe22]. These light-induced chemical reactions are photo-toxic and can cause chemical disruptions, changes in the cell cycle, or even cell death [Reference Hoebe22]. This is even more concerning when considering that certain types of photo-damage can be difficult to detect or may manifest only after a prolonged period of time. Changes to mammalian cell division, for instance, may only be detected if the imaging session is long enough to include a division cycle. As such, the uncertainty of how much photo-damage was inflicted on a sample can cloud the interpretation of an experimental outcome [Reference Hoebe22]. In many cases researchers are observing biological processes for the first time and therefore have no frame of reference or control from which to determine if these processes are transpiring as they “normally” would. Unfortunately, while the harmful effects of fluorescence microscopy are well known to microscopists, many researchers pay little attention to potential artifacts in their experimental interpretations [Reference Evanko23].
The extent or absence of photo-toxicity is often determined by verifying routine cell cycle processes. Published methods to measure photo-toxicity range from measurements of yeast cell division under relatively low incident light power [Reference Carlton24] to measurements of the development of C. elegans embryos [Reference Tinevez25]. In our live cell work, we have observed that Chinese hamster ovary (CHO-K1) cells are very sensitive to light and move at a significantly decreased velocity under high light doses. In addition the protrusion rates of the lamellipodia reduce and the retraction rates increase when cells are exposed to moderate light levels. A recent study of ours demonstrates a sensitive assay that uses changes in cell protrusion rates as a reliable indicator for photo-toxicity on confocal laser scanning microscopes [Reference Boudreau26]. We will extend this protrusion assay to wide-field fluorescence microscopy in this article.
Measurements of photo-bleaching rates are a good metric to determine photo-toxic potential because they are directly related to the generation of oxidative species. During the fluorescence process, some excited molecules can enter the triplet state where ROS can be generated. When these triplet state molecules absorb light energy, the result is the photo-destruction of the fluorophore. Therefore, the extent of photo-bleaching in fixed samples can be a valuable indicator of the degree of photo-toxicity endured by living samples under the same fluorescence imaging conditions. In our case, the wide-field microscope fluorescence incident light intensity was manipulated, and the rate of photo-bleaching of a paxillin-enhanced green fluorescent protein (EGFP) fusion was measured in fixed cells. These same conditions were then used to study cell migration speeds and cell protrusion rates. Experiments conducted with transmitted light techniques were used to calculate the rates for cell migration speed and cell protrusion speed in the absence of fluorescence-induced photo-toxicity.
This article describes how exposing live samples to lower intensity light for a longer period of time drastically improves cell health while maintaining image quality. Overall, microscopists must balance their desire for high-quality images with the necessity to minimize photo-toxicity and maintain cells in a healthy state during microscopy experiments [Reference Magidson and Khodjakov20]. While counterintuitive, imposing less incident light on a sample results in more fluorescent light emission because fluorescent molecules can repeatedly be excited to emit fluorescence as long as they are not photo-damaged. The results indicate that careful consideration must be made when designing how the incident fluorescence excitation light is delivered to the live sample in both space and time to achieve high signal-to-noise images and longer live imaging experiments.
Materials and Methods
Sample Preparation
Fibronectin (Sigma, F-0895) coating of 35 mm cover glass bottom dishes (World Precision Instruments, FD-35) was conducted by diluting a 10 μL aliquot of 1 mg/mL stock solution with phosphate buffered saline (PBS) and placing 2 mL of 2 μg/ml solution on 35 mm dishes for 1 hour at 37oC. Dishes were then gently washed three times with PBS. Coated dishes were used immediately or stored at 4oC in PBS solution for up to two weeks. Wild-type Chinese hamster ovary K1 (WT-CHO-K1) cells or the same cells stably expressing paxillin-EGFP were used for all of the studies. Cells were grown in low-glucose Dulbecco’s Modified Eagle Medium (DMEM) (ThermoFisher Scientific, Grand Island, NY, 11885-084) supplemented with non-essential amino acids (ThermoFisher Scientific, 11140-050), 1% penicillin-streptomysin (ThermoFisher Scientific, 10378-016), 10% fetal bovine serum (ThermoFisher Scientific, 10082-147), and 25 mM 4-(2-hydroxyethyl)-1-piperazineethanesulfonic acid (HEPES) (ThermoFisher Scientific, 15630-080). For the paxillin-EGFP expressing cells, the media also contained 0.5 mg/mL of geneticin for maintenance of selection of paxillin-EGFP expressing cells (ThermoFisher Scientific, 11811-031).
Fluorescence microscope
All experiments were performed on a fully automated Carl Zeiss inverted Axio Observer microscope (Carl Zeiss, Jena, Germany). Cell migration and protrusion assays were performed with a Plan-Apochromat 20×/0.8 NA objective lens and photo-bleaching experiments with a PlanApo 63×/1.4 NA oil immersion objective lens. Fluorescence incident light intensity was measured at the beginning of each experiment with a Plan-Neofluar 10×/0.3 NA Ph1 objective using a Coherent FieldMaxII-TO laser power meter (Coherent Inc., Santa Clara, CA). All experiments were performed in triplicate.
Photo-bleaching experiments
For fixed cell experiments, cells were grown in 35 mm glass bottom petri dishes, washed twice with PBS and fixed in a solution of 4% paraformaldehyde (PFA) for 15 minutes at room temperature, and stored in PBS at 4oC and used over a period of 4–6 weeks with no visible signs of deterioration. To get a proper measure of photo-bleaching, no anti-fade or anti-bleaching agents were added to the PBS. A solution of 16% paraformaldehyde (PFA) (Polysciences, Warrington, PA, 50-00-0) was diluted to 4% with PBS and used immediately or frozen at -20oC for later use. The PFA solution should not be stored at room temperature because it breaks down rapidly leaving highly fluorescent by-products. Photo-bleaching experiments were performed using the microscope shutter to control the exposure time. The incident light power was varied and the exposure time was changed to serially decrease the light density as the light power was decreased (Table 1). Images were collected until the fluorescence intensity reached a plateau and the bleaching rate was essentially zero. The fluorescence intensity was measured within 100 × 100 pixel regions over the image stack, and the data for each region was fit to a single exponential decay using Origin(Pro) 9.3 software (OriginLab Corporation, MA). Each light dose experiment was done in triplicate, with each trial focusing on 3 cells, from which 7 regions of interest (ROI) were selected. Thus, 9 cells and 21 regions of interest were measured per setting. Experiments were conducted with the following conditions: (1) 4.6 mW/s (1.6 mW, 0.350 s exposure); (2) 95 mW/s (6.68 mW, 0.070 s exposure); (3) 340 mW/s (12 mW, 0.035 s exposure); and (4) 1260 mW/s (22 mW, 0.0175 s exposure).
Table 1 Light intensity, exposure time, and the corresponding temporal light dose in the experimental settings. The light powers were measured from a Plan-Neofluar 10×/0.3 NA Ph1 objective. The exposure times were reduced to maintain a similar total light dose as the power was increased.

Cellular Dynamics
For live cell experiments, cells were maintained in exponential growth conditions, lifted with trypsin (ThermoFisher Scientific, 25200-056), plated on 35 mm fibronectin coated cover glass bottom petri dishes, and left to grow overnight before experimentation. The cell migration and protrusion assays were performed with an automated Zeiss inverted Axio Observer Z1 microscope on live WT-CHO-K1 or paxillin-EGFP expressing CHO-K1 cells. Cells were imaged with a Hamamatsu Orca ER camera every 2 minutes for 6 hours for the cell migration assay and every 20 seconds for 30 minutes for the cell protrusion assay. The average migration velocity or speed was determined using semi-automated cell tracking, and protrusion rates were measured using the kymograph feature in MetaXpress 5.0 software (Molecular Devices, Sunnyvale, CA). For cell tracking and protrusion baseline measurements, cells were imaged with transmitted light (brightfield-BF) with no fluorescence filter cube in the light path. For fluorescence illumination, a Carl Zeiss Filter Set 10 for green fluorescence emission was used in combination with the X-Cite 120LED lamp (Excelitas Technologies, Waltham, MA). Data were collected at different incident light powers and exposure times to modulate the temporal light dose. Images were collected with transmitted light, a high temporal light dose (340 mW/s, 12 mW for 0.035 s), or a low temporal light dose (4.6 mW/s, 1.6 mW for 0.350 s).
Results
Photo-bleaching
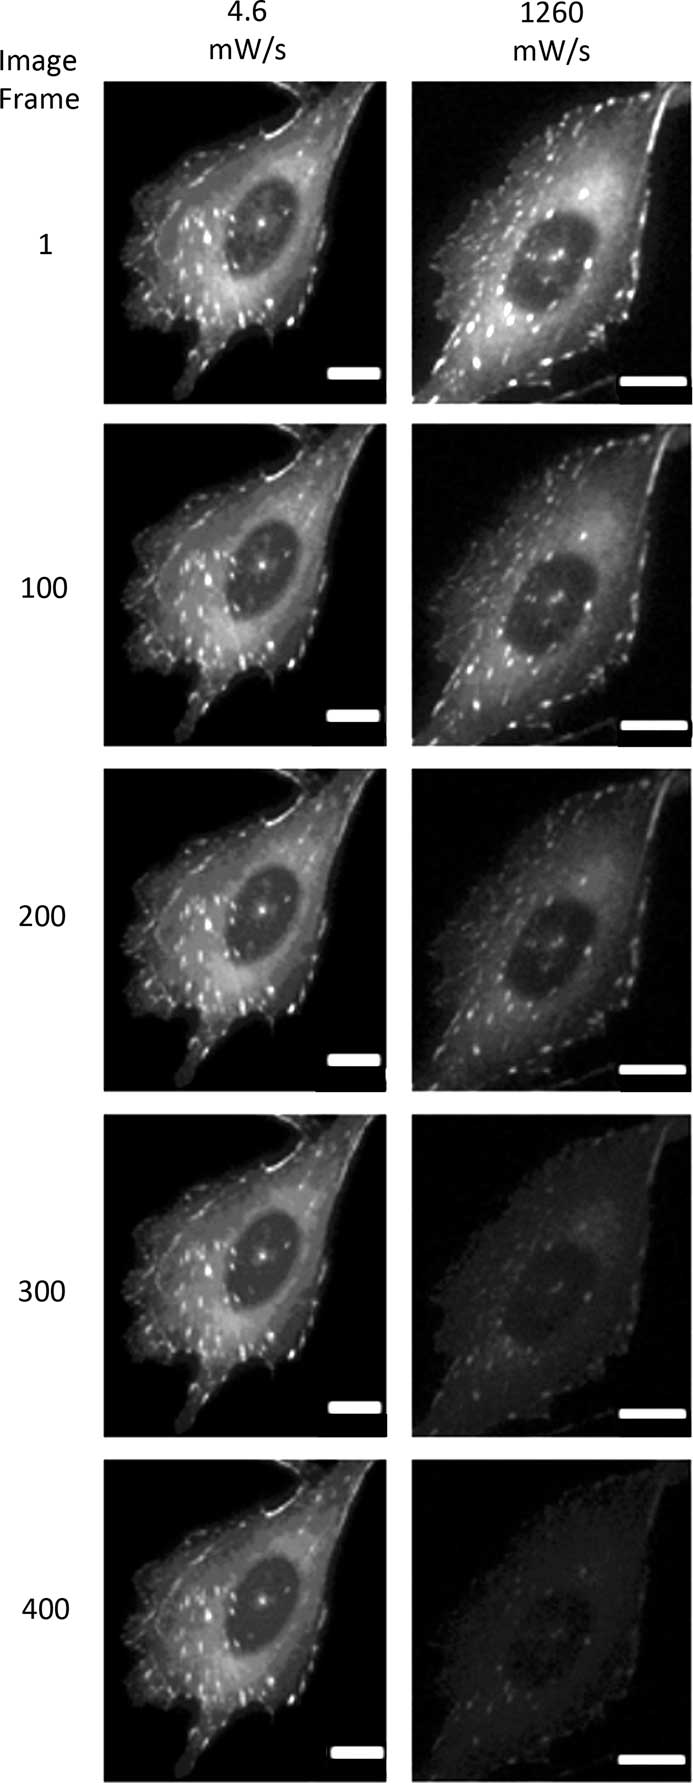
Photo-bleaching is a straightforward process to measure with different fluorophores. It is also a simplified method of measuring the potential ROS generated with any given fluorescence imaging condition. Therefore, photo-bleaching is a direct way to measure and compare the photo-toxic potential of different imaging conditions. Photo-bleaching experiments were conducted with variable incident light intensities and exposure times on fixed cells expressing paxillin-EGFP. Low light levels used a long exposure time (1% lamp, 350 ms, 4.6 mW/s) and high light levels used a short exposure time (20% lamp, 17.5 ms, 1260 mW/s). Actual incident light powers were measured with a 10×/0.3 NA objective lens, and the incident light exposures were expressed in terms of a temporal light dose or power per second (mW/s, Table 1). The EGFP fluorescence was bleached over time, and the intensity at regions of interest in the image time series stacks were measured. Decay rates were expressed in terms of images-1 since exposure times varied, but the total light exposure to the sample was similar for each image. The photo-bleaching decay curves were fit to a single exponential decay curve, and the rate for the low temporal light dose (1% lamp, 350 ms, 4.6 mW/s) was very low at 3.8 × 10⁻⁴ image-1 (Figure 1), which corresponded to a half-time of photo-bleaching of more than 2,800 images (Figure 2). In contrast, with a high temporal light dose (20% lamp, 17.5 ms, 1260 mW/s) the decay rate was almost 14-fold faster at 5.1 × 10⁻³ image-1 (Figure 1), and most of the fluorescence signal was photo-bleached after ~800 images (Figure 2). The rapid intensity decay for the high relative to the low temporal light dose is readily apparent after just 200 images from the image time series data (Figure 3).
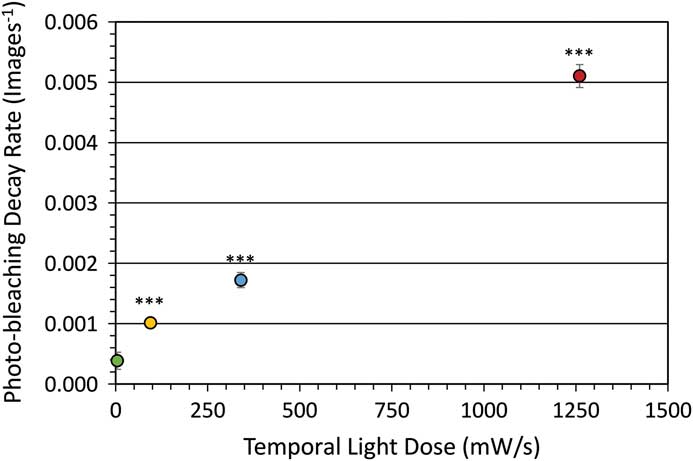
Figure 1 Photo-bleaching rates for fixed cells. Decay rate for photo-bleaching of paxillin-EGFP under different temporal light doses. Excitation was from an x-Cite 120LED light source using a FITC filter cube. Error bars are standard deviation. *** represents P<0.001 based on a two-tailed, t-test significance relative to the low 4.6 mW/s light dose.
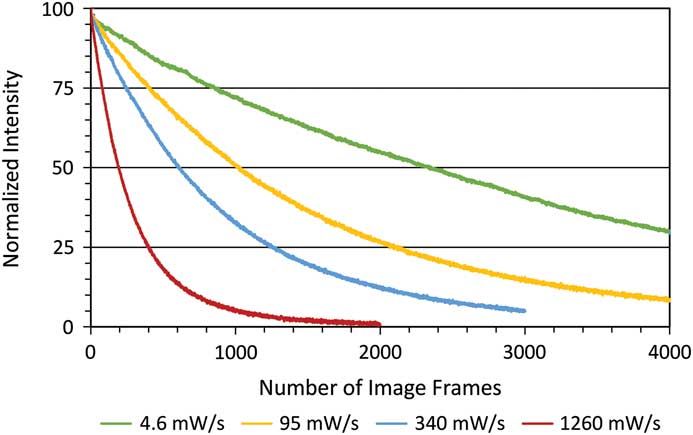
Figure 2 Photo-bleaching decay curves of fixed cells. Images were collected as in Figure 1. Normalized fluorescence intensity decay curves for different temporal light doses.

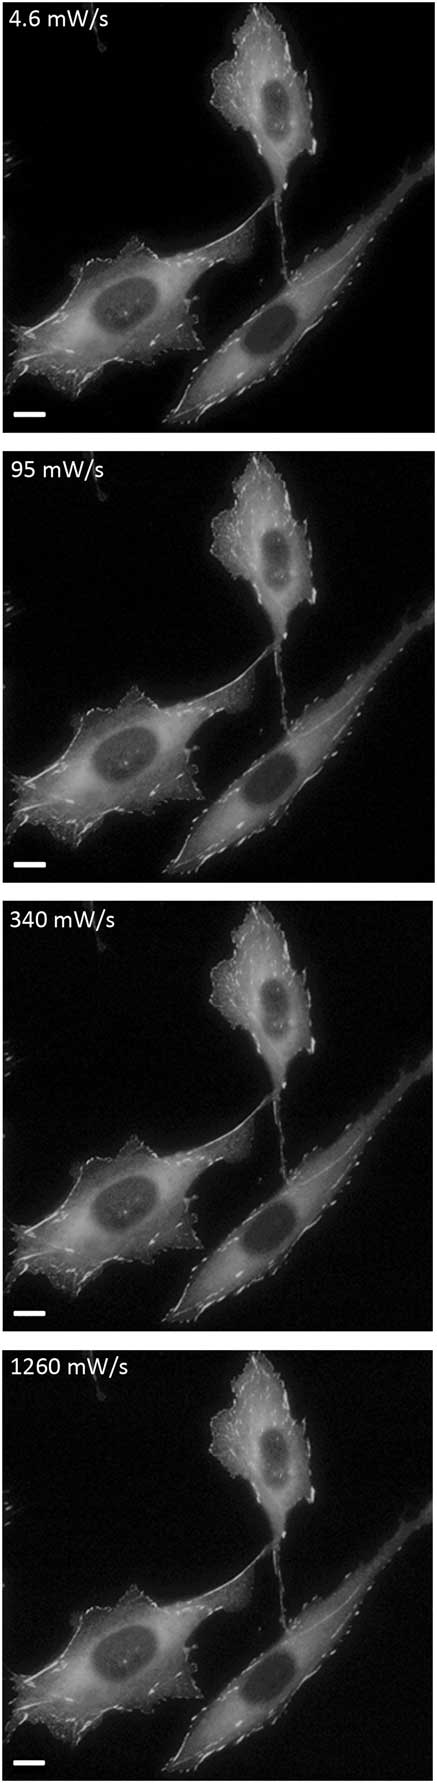
Figure 3 Photo-bleaching image montage of fixed cells. Images of cells at the lowest and highest temporal light dose showing photo-bleaching of paxillin-EGFP over 400 image frames. Scale bar = 10 μm.
Photo-toxicity
It is likely that photo-bleaching measured on fixed samples directly translates to photo-toxicity in living samples. However, the photo-physics of EGFP photo-bleaching in living cells is likely altered because of environmental factors. To specifically test for photo-toxicity, two live cell assays were conducted: cell migration and cell protrusion. These assays are both very sensitive to high light levels. Our previous studies show that with higher fluorescence excitation light levels, CHO-K1 cells slow down, tend not to protrude, and often retract [Reference Boudreau26].
Cell migration assay
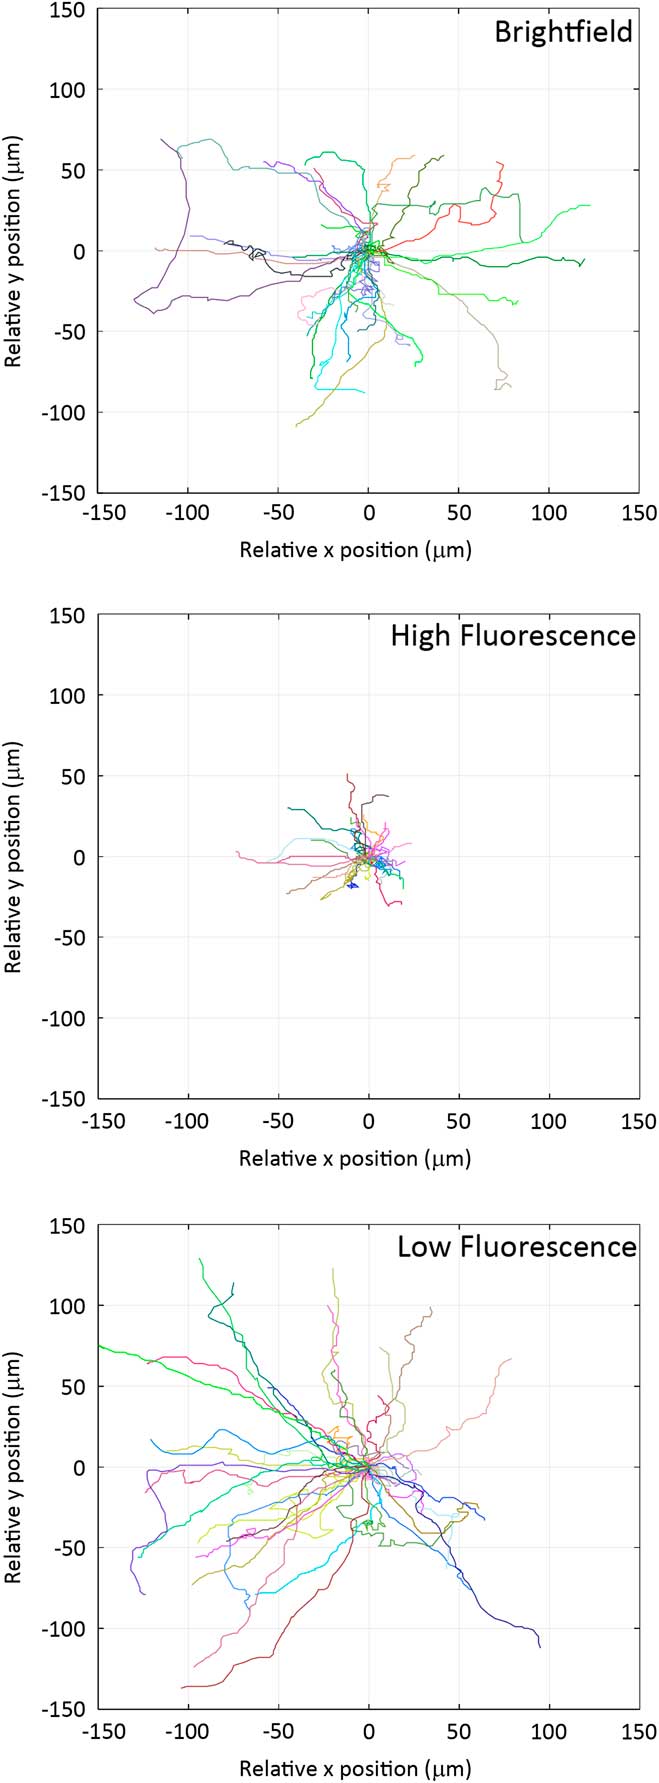
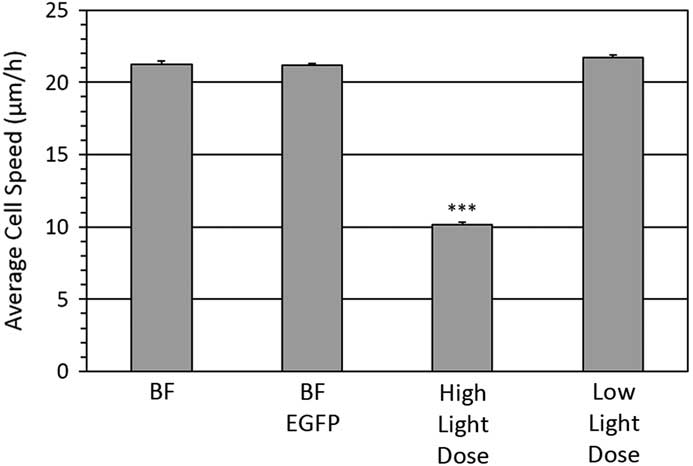
Individual cells were imaged from which Rose plots were calculated and show individual cell tracks over 6 hours (Figure 4). Based on bright-field imaging the average cell speed was calculated at 21.3 ± 0.2 μm/hour (Figure 5), and this speed matched with our previously published work [Reference Boudreau26]. The cell migration speed was not affected by the over expression of the paxillin-EGFP fusion protein (Figure 5). However, if cells expressing paxillin-EGFP were imaged with a high fluorescence temporal light dose (340 mW/s) they moved much less (Figure 4), and the average cell speed drastically slowed down to only 10.2 ± 0.2 μm/hour (Figure 5). Importantly, if the temporal light dose was low (4.6 mW/s), both the cell tracks (Figure 4) and the cell migration speeds (Figure 5) were similar to cells imaged with bright-field illumination. Interestingly, cells that were not expressing paxillin-EGFP but were exposed to high fluorescence blue illumination light (340 mW/s) also showed reduced cell speeds at 16.0 ± 0.5 μm/hour.

Figure 4 Rose plots of cell migration tracks. Cell migration tracks are shown from bright-field, high-fluorescence, and low-fluorescence temporal light doses. Each line represents the track of an individual cell over 6 hours. Track positions were normalized so that each track starts at the (0,0) co-ordinate.

Figure 5 Cell migration speeds. Average cell speed of control cells or cells stably expressing a paxillin-EGFP fusion protein. Bright-field transmitted light imaging was done on control cells (BF) or cells stably expressing paxillin-EGFP (BF-EGFP). Fluorescence imaging was done on cells expressing paxillin-EGFP using high light dose (340 mW/s) or low light dose (4.6 mW/s) fluorescence imaging. A total of ~30 cells were tracked from three experiments for each condition. Error bars are standard error of the mean. *** is defined in the caption for Figure 1 and is relative to the bright-field control.
Cell protrusion assay
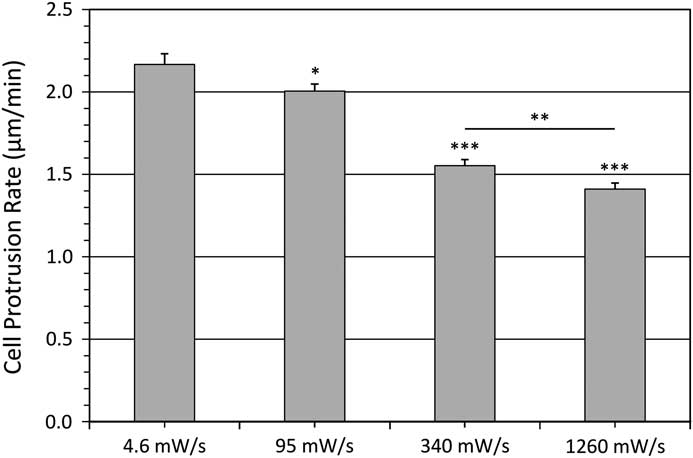
The cell protrusion assay is a very rapid and convenient way to measure photo-toxicity as cells retract in response to high light exposure [Reference Boudreau26]. Cells were imaged every 20 seconds for 30 minutes with different temporal light doses. Protrusive areas were identified, and the protrusion rates were measured using the kymograph feature in MetaXpress 5.0 software [Reference Boudreau26] (Figure 6). As a control, the protrusive rate of the cell measured from bright-field images was 1.99 ± 0.07 μm/min. This corresponds well with previous data collected with fluorescence confocal laser scanning microscopy conducted under very mild imaging conditions [Reference Boudreau26]. When imaging with a low fluorescence temporal light dose the protrusion rate matched well with bright-field controls at 2.17 ± 0.40 μm/min (Figure 7). However, protrusion rates readily decreased to only 1.41 ± 0.22 μm/min with higher fluorescence temporal light doses (Figure 7).
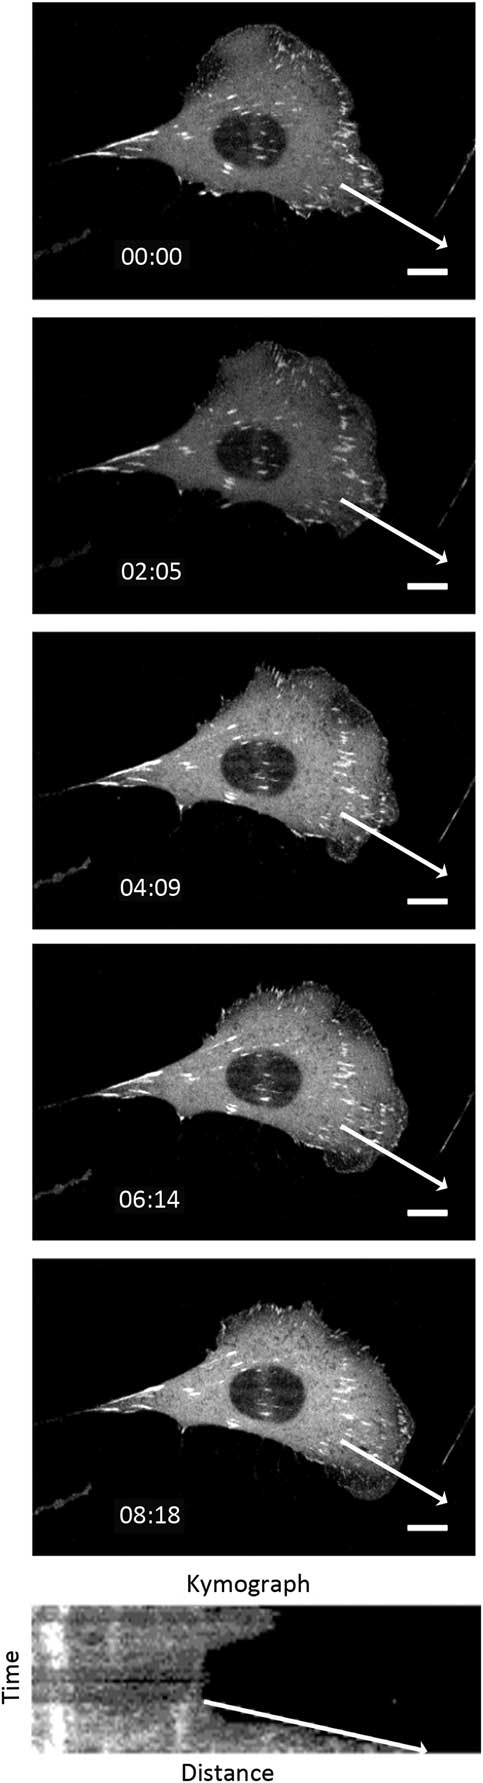
Figure 6 Montage of cell protrusion. The cell was imaged every 20 seconds, and the montage shows selected images over 8 minutes. The white arrow shows the line that the kymograph was generated from. The slope of the arrow on the kymograph image was used to calculate the protrusion rate. Scale bar = 10 μm.

Figure 7 Average cell protrusion speeds. Protrusion speed of ~38 cells from three experiments for each condition with various temporal light doses. Error bars are the standard error of the mean. Significance is relative to 4.6 mW/s where * represents P<0.05, ** represents P<0.01, and *** represents P<0.001 as defined in Figure 1. The last significance is comparing the 340 and 1260 mW/s data sets.
Discussion
Wide-field fluorescence microscopy is a core technology used extensively in many scientific disciplines. Application of lower excitation light intensity combined with a longer camera exposure time results in significantly reduced photo-bleaching of EGFP (Figures 1–3). Since the total light exposure to the sample stays essentially the same, the image quality is not compromised (Figure 8). Our results show a direct correlation between reduced photo-bleaching rates of EGFP on fixed samples and reduced photo-toxicity in living samples. The six-hour cell migration assay and the 30-minute cell protrusion assay are straightforward to implement. To our surprise, even apparently “mild” imaging conditions resulted in reduced cell migration speeds. More specifically, exposure of cells to 10% incident light from a blue LED light source for 35 ms (340 mW/s), taking images every 2 minutes for a total of 6 hours (total of 180 images), caused a 50% reduction in cell migration speed (Figures 4 and 5). Simply reducing the incident light power from 10% to 1% and increasing the exposure time from 35 ms to 350 ms (4.6 mW/s) resulted in restoration of cell migration speeds to control levels (Figures 4 and 5). This reduction in cell speed was not simply due to the over expression of an EGFP fusion protein. It should be noted that cell speed was somewhat reduced when high fluorescence conditions were applied even in cells that did not express EGFP protein. This is likely due to the absorption of blue light by auto-fluorescent molecules in the cell or in the cell culture media. Cell protrusion experiments involved imaging cells every 20 seconds for 30 minutes (total of 90 images), and imaging with a high temporal light dose reduced protrusion rates by 35% (Figure 7). Reducing incident light to 4.6 mW/s restored protrusion rates to control levels. These results support the fact that minimal light intensity should always be used when imaging living samples.

Figure 8 Images of fixed cells. Cells were imaged with variable temporal light doses and are displayed with the same intensity scaling. Scale bar = 10 μm.
By simply reducing incident light power and increasing camera exposure time, thus decreasing the temporal light dose, photo-bleaching can be reduced and cell migration and protrusion speeds can in turn recover to match control values. Since these photo-toxic effects are likely due to the triplet state generation of ROS, it is likely that similar damage and toxicity is present with the use of other fluorophores. For fixed or live imaging, it is recommended that incident light be reduced and exposure times be increased. Under these conditions, longer sample imaging can be achieved, more accurate fluorescent intensity measurements can be made (even in fixed samples), and longer live cell imaging can be performed. However, scenarios such as calcium imaging or high-throughput imaging of hundreds of samples may not allow for low temporal light dose parameters given the high-speed requirements of the experimental design.
Cell migration and protrusion assays with CHO cells are relatively easy to implement for any lab and can be used as a metric to ensure limited photo-toxicity and maximal cell health. In principle, these assays could be extended to other migratory and protrusive cell types. It is possible that even the mild conditions used here (4.6 mW/s) may still result in photo-toxic effects that may not affect cell migration or cell protrusion. In that case, an even more sensitive assay may need to be developed. Overall, our results suggest that the light intensity to which a sample is exposed is more important in defining the damage that will be inflicted rather than the total time period of exposure. In general, fluorescence incident light intensities must be minimized as much as possible in all live cell applications.
Conclusion
Researchers should take great care when conducting live cell fluorescence imaging experiments. Photo-toxic effects need to be minimized with wide-field imaging by reducing incident light intensity and increasing camera exposure time. Even light levels that “appear” gentle can have a drastic effect on cellular migration and protrusion, and experimental data obtained may be susceptible to aberrant physiological effects induced by photo-toxic oxygen radical production [Reference Carlton24]. Cell health needs to be carefully controlled on the microscope by adjusting conditions to maintain temperature, humidity, osmolarity, and pH while also minimizing light doses. If experiments are not under time pressure, simply increasing camera exposure times can retain image quality while significantly reducing photo-toxicity. These considerations are critical for long-term time-lapse imaging of living samples and with light-dose-intensive super-resolution techniques. Using longer wavelengths (lower energy) of light is effective [Reference Waldchen27], but careful consideration of how the light is delivered to the sample in space and time is critical in order to obtain accurate live cell information. Fortunately, discussions of the photo-toxicity of fluorescence microscopes to live samples are becoming more common and researchers are adding new ideas and protocols to lessen the problem [28].
Acknowledgements
Imaging for this project was conducted at the McGill University Life Sciences Complex Advanced BioImaging Facility (ABIF). This project was funded by NSERC Canada. Thank you to Rebecca Deagle for critical reading of the manuscript.