


Introduction
Theoretically, transmission electron microscopy (TEM) is compatible with three different types of phase plate: thin-film, electrostatic, and magnetic. However, designing functional phase plates has been an arduous process that has suffered from unavoidable technical obstacles such as phase-plate charging and difficulties associated with micro-fabrication of electrostatic and magnetic phase plates. This review discusses phase-contrast schemes that allow visualization of transparent objects with high contrast. Next it deals with recent studies on biological applications ranging from proteins and viruses to whole cells. Finally, future prospects for overcoming the problem of phase-plate charging and for designing the next generation of phase-plates to solve the problem of electron loss inherent in thin-film phase plates are discussed.
Phase-Contrast Techniques
The first phase visualization technique in optics was introduced at the end of the nineteenth century as Schlieren optics using a Foucault knife-edge that covers half of the back focal plane of the objective lens as shown in Figure 1c [Reference Danev and Nagayama1]. The Zernike phase contrast (ZPC) method (Figure 1b) and the Smith/Nomarski differential interference contrast (DIC) method followed. In electron microscopy, instead, defocus phase contrast (DPC) was devised and developed by Scherzer, which is now a standard in materials science electron microscopy [Reference Scherzer2] (Figure 1a). The extension of ZPC to electron microscopy has been attempted for more than 50 years after the Boersch suggestion [Reference Boersch3], but only recently one scheme, using thin-film phase-plates made of amorphous carbon, has been successfully reported [Reference Danev and Nagayama4]. This same group has also demonstrated a phase-plate version of DIC (Figure 1d) [Reference Danev and Nagayama5], which by chance has the same geometry as the Foucault knife-edge but has been replaced with a π phase-shift plate. This setup was termed Hilbert differential contrast (HDC) [Reference Danev and Nagayama6].

Figure 1: Various phase schemes in microscopy. (a) Defocus phase contrast (DPC) by objective lens defocusing and without phase plates. (b) Zernike phase contrast (ZPC) with a Zernike phase plate. (c) Schlieren optics (SO) or singlesideband imaging (SSI) with a Foucaut knife-edge. (d) Hilbert differential contrast (HDC) with a Hilbert phase plate [Reference Danev and Nagayama1].
TEM Phase Contrast in Biology
In this review, biological applications using three phase-contrast schemes (DPC, ZPC, and HDC) are compared. One key technology that has a perfect matching with the phase-plate approach in biological TEM is cryogenic specimen handling. For example, rapidly frozen, ice-embedded specimens are considered to preserve close-to-life structures down to the sub-nanometer scale because artifacts common to conventional sample preparation are absent: the destructive features from fixation, dehydration, resin-embedding, and staining. Most issues inherent in the traditional approach have all been solved by cryo-techniques, but not the problem of weak contrast. Thus, the strong contrast typical of TEM images enhanced with phase plates for unstained biological specimens is an important advantage.
Physical Basis of Phase Contrast in TEM
Image formation theory based on wave optics tells us that the main effect of the phase plate is changing the sine-type contrast transfer function (CTF) of the conventional TEM to a cosine-type as shown in Figure 2. The curves are complementary with one having a zero where the other has a maximum. The phase-plate CTF starts at a point labeled k co, which is the “cut-on” frequency [Reference Danev7]. It is determined for the case of ZPC by the size of the phase-plate central hole and for the case of HDC by the proximity of the optical center to the HDC phase plate, which can be calculated by the formula:
where k is the modulus of the spatial frequency, r is the real space distance between the optical center and the edge of the phase plate, λ is the electron wavelength, and f is the focal length of the objective lens. In a 300 kV TEM system, for example, a Zernike phase plate with a hole size of 0.5 μm in diameter results in a k co about 0.025 nm−1 (40-nm periodicity). Given this limitation, applications of ZPC-TEM can cover structural studies of relatively small biological systems.
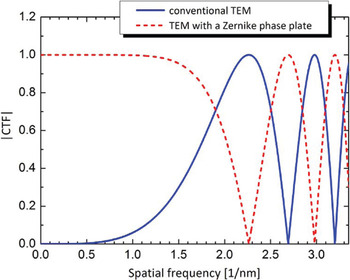
Figure 2: Moduli of phase contrast transfer functions (CTFs) without (solid line) and with (dashed line) a Zernike phase plate. k co is the cut-on frequency of the phase plate determined by the finite size of the central hole of the Zernike phase plate. Parameters for the CTF calculation: defocus 0, spherical aberration 5 mm, accelerating voltage 300 kV.
The important effect of the phase plate is the almost flat CTF region between the cut-on frequency and the first shoulder at ~1.5 nm–1 (0.67-nm periodicity). In that region, the CTF of the conventional TEM has a low magnitude, which means that object information at those frequencies will be weakly represented in the image. Adjusting the defocus can improve the transfer for parts of the low-frequency region but at the expense of reduced performance at higher frequencies and rapidly oscillating CTF modulation [Reference Danev and Nagayama8].
Biological Applications Using Thin-Film Phase Plates
In the next paragraphs, the image appearance characteristics of ZPC are shown through various examples from protein molecules to whole-mounted cells. Then the characteristics of HDC are presented.
ZPC-TEM Applications.Figures 3a and 3b illustrate the differences between a conventional and a ZPC image for a chaperonin protein, GroEL [Reference Danev and Nagayama9]. Several competing groups intensively pursued high-resolution 3D structures of this protein with single particle analysis based on conventional images (Figure 3a). The most difficult component of the single particle analysis when performed with the conventional approach is the first step, identification of the images that correspond to protein molecules. High-contrast images by ZPC have a significant advantage in such particle identification as shown in Figure 3b.

Figure 3: Comparisons of DPC and ZPC images for various ice-embedded samples. (a) A DPC image (300 kV) for GroEL. The inset is a diffractogram obtained by taking the Fourier-transform of the image. A typical sine CTF (refer to Figure 2) is shown. (b) A ZPC image (300 kV) for GroEL. A typical cosine CTF is shown. Bars in (a) and (b) are 20 nm [Reference Danev and Nagayama9]. (c) A DPC image (300 kV) for a calcium channel protein, rat TRPV4. (d) A ZPC image (300 kV) of rat TRPV4. (Bars in c and d are 50 nm.) (d') TRPV4 particles picked up from the image shown in (d). Bar = 10 nm [Reference Shigematsu10]. (e) A DPC tomographically sliced image (200 kV) for a complex protein, the hook basal body of flagellar motor (HBB). (f) A ZPC tomographically sliced image of the same HBB protein. Bars in (e) and (f) are 50 nm [Reference Hosogi11]. (g) A DPC image (200 kV) of T4 phage. (h) A ZPC image (200 kV) of a similar area of the specimen in (g). Bars in (g) and (h) are 50 nm [Reference Danev and Nagayama8]. (i) A DPC tomographically sliced image (200 kV) of T4 phage. (j) A ZPC image (200 kV) of a similar area of the specimen in (h). Bars in (i) and (j) are 100 nm [Reference Danev12]. (k) A DPC image (300 kV) for a primary cultured neuronal cell. (l) A ZPC image (300 kV) for a primary cultured neuronal cell. Bars in (k) and (l) are 200 nm [Reference Fukuda13].
The channel proteins belong to the most difficult group to be tackled with TEM because they are membrane proteins with difficulties for solubilization and structural preservation in an artificial aqueous medium. It is well-known that their contrast in TEM is vague probably due to the smeared boundary between ambient ice and detergents dressing the protein. The ZPC technique seems to be one answer to this difficulty, as shown in Figures 3c and 3d [Reference Shigematsu10]. The improved visibility of the low-molecular weight channel protein, rat TRPV4, is remarkable.
The larger the particle, the greater the image contrast from ambient ice. This is the major reason why larger protein particles are preferred in single-particle analysis. One such example is shown in Figures 3e and 3f, where a tomographic reconstruction of a part of the flagellar motor hook basal body (HBB) is shown in both DPC and ZPC [Reference Hosogi11]. The contrast difference between sliced data of the HBB with these two schemes is clearly recognized, leading to an easy interpretation of internal structures in the complex protein.
When much larger biological specimens are treated, the advantage of using ZPC is not decisive. Nevertheless as seen in examples with viruses, T4 phage for example, there is a concrete gain in the structural elucidations as shown in Figures 3g to 3j [Reference Danev and Nagayama9, Reference Danev12]. Images in Figures 3g to 3j are shown using the same intensity scale. The higher contrast of the Zernike image may be attributed to improved transfer for the low spatial frequencies. In addition, fine fiber-like structures protruding from the T4 phage surface are clearly recognized (Figure 3h); this is a result of the uniform transfer for a wide portion of the spatial frequency spectrum. Insets in Figures 3g and 3h show the amplitudes of the Fourier transforms of the images. The DPC spectrum (inset in Figure 3g) shows a moderate presence of low-frequency information around the center of the spectrum and ring-shaped areas of reduced amplitude due to CTF zeros. The ZPC-TEM spectrum (inset in Figure 3h) does not exhibit CTF zeros and has very strong presence of low-frequency information. The tomographically sliced image taken from tomograms of a T4 phage sample shown in Figures 3i and 3j demonstrate the same higher-contrast characteristics in ZPC in a 3D manner [Reference Danev12].
The last example to illustrate the comparison of DPC and ZPC is a quickly frozen whole primary cultured neuronal cell specimen (unsectioned) derived from the cerebral cortices and hippocampi of E16 mice (Figures 3k and 3l) [Reference Fukuda13]. Fine details such as cytoskeletal filaments inside the cell are much more accessible with ZPC. Vertically running fine fibers recognized inside the cell (Figure 3l) have been interpreted as intermediate filaments by their width.
HDC-TEM Applications. The most striking application of HDC-TEM to the biological phase-contrast technique is the imaging of entire cells in an ice-embedded state [Reference Kaneko14, Reference Nitta15]. These results seemed to be completely unexpected in the TEM community, as whole-mounted cells had been considered too thick to be visualized without sectioning. The HDC-TEM images display topographic features and appear similar to images obtained with differential interference contrast light microscopes, as shown for a cyanobacterium in Figure 4a [Reference Nitta15]. Surrounded by smooth cell walls, the thylakoid membranes, carboxysomes, and prominent polyphosphate body are visible through HDC. The identification of the structures was confirmed with conventional TEM images of ultrathin sections of chemically fixed and resin-embedded cyanobacteria (Figure 4b).

Figure 4: (a) An HDC image (300 kV) of an ice-embedded whole cyanobacterial cell (not incubated with BrdU). (b) A conventional TEM image (100 kV) of a chemically fixed, resin-embedded, sectioned cell (not incubated with BrdU). The sections were stained with uranyl acetate and lead citrate, which conferred electron density to strands assumed to be DNA. C, carboxysomes; L, lipid droplets; P, polyphosphate body or its residual hole; T, thylakoid membranes; arrows: DNA fibers. (c) An HDC image (300 kV) image for an ice-embedded whole cyanobacterial cell incubated with BrdU for 2 hours. (d) A DPC image (300 kV) for an ice-embedded whole cyanobacterial cell incubated with BrdU for 24 hours. (e) A HDC image (300 kV) for the same ice-embedded whole cyanobacterial cell incubated with BrdU for 24 hours. Bars = 100 nm [Reference Nitta15].
A further experiment was designed to identify DNA in HDC-TEM images because DNA exhibits characteristic shapes in conventional TEM (Figure 4b, arrows). After rapidly growing cells were cultured in BrdU-containing media for 2 hours, no electron-dense areas were observed except for the polyphosphate body (Figure 4c). After incubating for 24 hours, incorporation of BrdU into DNA was confirmed by fluorescent microscopy using FITC-labeled anti-BrdU antibodies and by EDX line analysis during TEM observation of resin embedded sections [Reference Nitta15]. When BrdU-incorporating whole cells were observed with TEM after rapid freezing, electron-dense areas appeared in certain portions of the cells imaged at high under-focus without the phase plate (Figure 4d). When the HDC phase plate was applied, visualization of detailed ultrastructure in the electron-dense area was greatly enhanced by its effect (Figure 4e).
Future Prospects
Electrostatic Charging. TEM pioneers noted that con-tamination on the surface of phase plates made of insulating materials was the source of the charge. The phase plate itself is not charged when made of a conducting material such as carbon. There are three major sources of charged contaminants: organic materials, metal oxides, and inorganic materials; these are unavoidably integrated into or onto phase plates during the fabrication procedure. For the final answer to settle the dilemma of fabricating or not fabricating, our group employed an old idea—electrostatic shielding. The charge-induced potential can be shielded by wrapping charges with conductive material such as carbon [Reference Nagayama16]. In the final step of phase-plate production, both sides of the phase plate, likely contaminated with organic materials, metal oxides, or inorganic materials, are coated with carbon in a vacuum evaporator. Consequently, once grounded, the electrostatic potential arising from charging is eliminated. A schematic for a three-layered phase plate constructed with a carbon wrapping is shown in Figure 5.

Figure 5: Design for a three-layered carbon film to avoid charging effects in a Zernike phase plate. Contaminants that could charge and modify the image are wrapped by a conductive carbon coat [Reference Danev and Nagayama1].
Next-Generation Phase Plates. One of the disadvantages of using thin-film phase plates is electron loss due to electron scattering [Reference Danev and Nagayama4, Reference Nagayama16]. In his pioneering work, Boersch proposed the other option for phase plates—electrostatic potential type [Reference Boersch3]. The sophisticated version of the Zernike phase plate containing a static ring electrode that can arbitrarily control the amount of phase shift was first proposed theoretically [Reference Matumoto and Tomonura17], and recently many groups have reported that the electrostatic phase plate is technically tractable with the use of advanced microfabrication technology. However, efficient phase contrast by this method has yet to be reported for biological samples partly because of the large outer diameter of the central electrode ring that blocks the lower-frequency components and partly because of unavoidable charging of devices with complicated geometry. Phase plates are now continuously stimulating physicists as a novel kind of physical toy that challenges various kinds of physical principles including the Aharonov-Bohm effect [Reference Aharonov and Bohm18, Reference Nagayama19] and laser modulation. Details of next-generation phase plates including such developments may be found in a recent review article [Reference Danev and Nagayama8].


