


Introduction
Climate change will very likely cause a global acceleration of sea-level rise (SLR). The projected acceleration of SLR will also affect the Wadden Sea. In addition to an accelerated SLR, gas and salt extraction will cause subsidence that adds to an increase in water depth in the tidal basins in the Dutch part of the Wadden Sea. This will have consequences for the sediment budget of these basins and especially for the intertidal flats that have a high ecological value. Therefore, insight into the possible changes in the sediment budget of the Dutch Wadden Sea and the contributing factors is necessary.
The aim of this paper is to give a concise overview of the state of the art in our understanding of the development of mean sea-level change along the Wadden coast of the Netherlands and the effect of anticipated changes in the coming decades, of the subsidence of the seabed caused by extraction of raw materials and of the state of the sediment-sharing system of the tidal basins in the Dutch Wadden Sea. This information will be combined to provide the best possible projection of future developments in this area.
This synthesis summarizes the information presented in the papers by Vermeersen et al. (Reference Vermeersen, Slangen, Gerkema, Baart, Cohen, Dangendorf, Duran-Matute, Frederikse, Grinsted, Hijma, Jevrejeva, Kiden, Kleinherenbrink, Meijles, Palmer, Rietbroek, Riva, Schulz, Slobbe, Simpson, Sterlini, Stocchi, Van de Wal and Van der Wegen2018), Fokker et al. (Reference Fokker, Van Leijen, Orlic, Van der Marel and Hanssen2018) and Wang et al. (Reference Wang, Elias, Van der Spek and Lodder2018) in this special issue of the Netherlands Journal of Geosciences and combines projections of local sea level, subsidence and sediment transport into an assessment of the future state of the Dutch part of the Wadden Sea. We will restrict ourselves to projections of the future morphological development using the SLR scenarios presented by Vermeersen et al. (Reference Vermeersen, Slangen, Gerkema, Baart, Cohen, Dangendorf, Duran-Matute, Frederikse, Grinsted, Hijma, Jevrejeva, Kiden, Kleinherenbrink, Meijles, Palmer, Rietbroek, Riva, Schulz, Slobbe, Simpson, Sterlini, Stocchi, Van de Wal and Van der Wegen2018) in combination with the prognoses for subsidence caused by gas and salt extraction for the individual fields in the Wadden Sea by Fokker et al. (Reference Fokker, Van Leijen, Orlic, Van der Marel and Hanssen2018). In order to do this, the state of the sediment balance, as presented by Wang et al. (Reference Wang, Elias, Van der Spek and Lodder2018), for the years 2030, 2050 and 2100 will be discussed. The projection of the morphological state of the individual basins for these years will be based on existing system knowledge and insight rather than a new modelling study.
Sea-level change projections for the Wadden Sea
In order to project sea-level changes at a specific location like the Dutch coast and the Wadden Sea (Fig. 1), we need to understand what is causing sea-level change, both on the global scale and on regional to local scales. On the global scale, the main drivers of contemporary SLR are thermal expansion (i.e. higher temperatures cause the seawater to expand) and the exchange of water mass between land ice and the ocean. Owing to processes acting on different spatial and temporal scales, however, regional or local sea-level change can deviate significantly from the global average change.
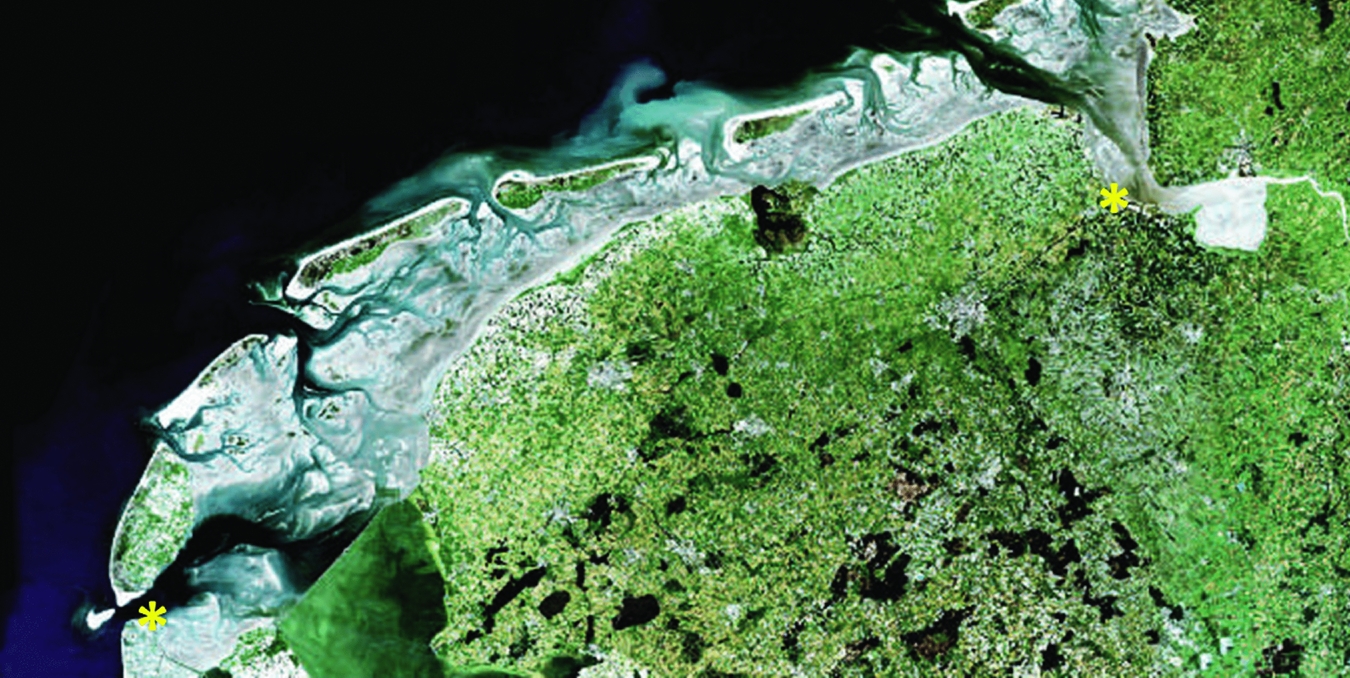
Fig. 1. Overview of the Dutch Wadden Sea. The locations of the tide gauge stations Den Helder at the western boundary and Delfzijl at the eastern boundary are indicated with asterisks. (Source satellite image: www.waddensea-secretariat.org.)
Here, the focus is on sea-level projections for the Wadden Sea over the course of the 21st century. The regional sea-level projections from the Intergovernmental Panel on Climate Change Fifth Assessment Report (IPCC AR5; Church et al., Reference Church, Clark, Cazenave, Gregory, Jevrejeva, Levermann, Merrifield, Milne, Nerem, Nunn, Payne, Pfeffer, Stammer, Unnikrishnan, Stocker, Qin, Plattner, Tignor, Allen, Boschung, Nauels, Xia, Bex and Midgley2013) have been taken as the starting point of this assessment. These projections include ocean steric and dynamic changes, ice sheet and glacier mass changes, groundwater extraction, atmospheric pressure change and glacial isostatic adjustment (GIA) and depend on the concentration of greenhouse gases in the atmosphere. Vermeersen et al. (Reference Vermeersen, Slangen, Gerkema, Baart, Cohen, Dangendorf, Duran-Matute, Frederikse, Grinsted, Hijma, Jevrejeva, Kiden, Kleinherenbrink, Meijles, Palmer, Rietbroek, Riva, Schulz, Slobbe, Simpson, Sterlini, Stocchi, Van de Wal and Van der Wegen2018) considered three scenarios in terms of Representative Concentration Pathways (RCPs) as defined in IPCC AR5. Based on those results, they examined the influence of recent advances on the regional projections for the Wadden Sea. In this, they also assessed new estimates of dynamic ice sheet contributions from Antarctica to SLR. Moreover, they also considered different GIA estimates and evaluated the impact this has on the regional sea-level projections.
The projected changes are subject to local interannual variability, which means that a spread may be expected around the projected changes. Vermeersen et al. used observations from tide gauge stations of Den Helder at the western boundary of the Dutch Wadden Sea, and Delfzijl at the eastern boundary of the Dutch Wadden Sea (see Fig. 1) to estimate local variability. This was superimposed on the projected rates for the Dutch part of the Wadden Sea.
Data and methods
The regional sea-level projections presented by Vermeersen et al. (Reference Vermeersen, Slangen, Gerkema, Baart, Cohen, Dangendorf, Duran-Matute, Frederikse, Grinsted, Hijma, Jevrejeva, Kiden, Kleinherenbrink, Meijles, Palmer, Rietbroek, Riva, Schulz, Slobbe, Simpson, Sterlini, Stocchi, Van de Wal and Van der Wegen2018) are based on the projected IPCC AR5 contributions to sea level change from ice sheet changes, glacier mass loss, land water storage and global thermal expansion. The time series for ice sheet, glacier and land water mass changes were used to compute the sea-level ‘fingerprints’ that account for the responses of Earth's geoid (via gravity and rotational effects) and the lithosphere to obtain the associated regional sea-level change. The authors also included an estimate of relative sea-level change as a result of the vertical land motion and geoid changes associated with GIA from the ICE-5G (VM2) model. The final step in the regional projections was to account for local changes in the shape of the sea surface that can arise from local changes in circulation and/or density (‘oceanographic’ sea level), which is computed by large-scale climate models.
On a regional scale, Den Helder and Delfzijl (Fig. 1) show similar results, but they differ from the global mean projections. The larger uncertainty in the regional oceanographic contribution translates into a larger uncertainty for the summed sea-level projections at both stations. The projected changes by 2100 for these two locations are above the global mean projections (+0.04m, +0.08m and +0.11m for scenarios RCP2.6, RCP4.5 and RCP8.5, respectively), mainly due to the above-average dynamic ocean and GIA contributions in the regional projections. The projected average rise in mean sea level in Den Helder and Delfzijl for 2100 (with relation to 2018) is 0.41m, 0.52m and 0.76m for, respectively, the RCP2.6, RCP 4.5 and RCP8.5 scenarios (Table 1). Figure 2 illustrates the projections for these scenarios. Table 2 gives the rates of SLR for 2030, 2050 and 2100 for the three RCPs.
Table 1. Projected sea-level rise in the Dutch Wadden Sea for the years 2030, 2050 and 2100 with relation to 2018 (m) for the three scenarios. The uncertainties represent the 5th to 95th percentile values. From Vermeersen et al. (Reference Vermeersen, Slangen, Gerkema, Baart, Cohen, Dangendorf, Duran-Matute, Frederikse, Grinsted, Hijma, Jevrejeva, Kiden, Kleinherenbrink, Meijles, Palmer, Rietbroek, Riva, Schulz, Slobbe, Simpson, Sterlini, Stocchi, Van de Wal and Van der Wegen2018).
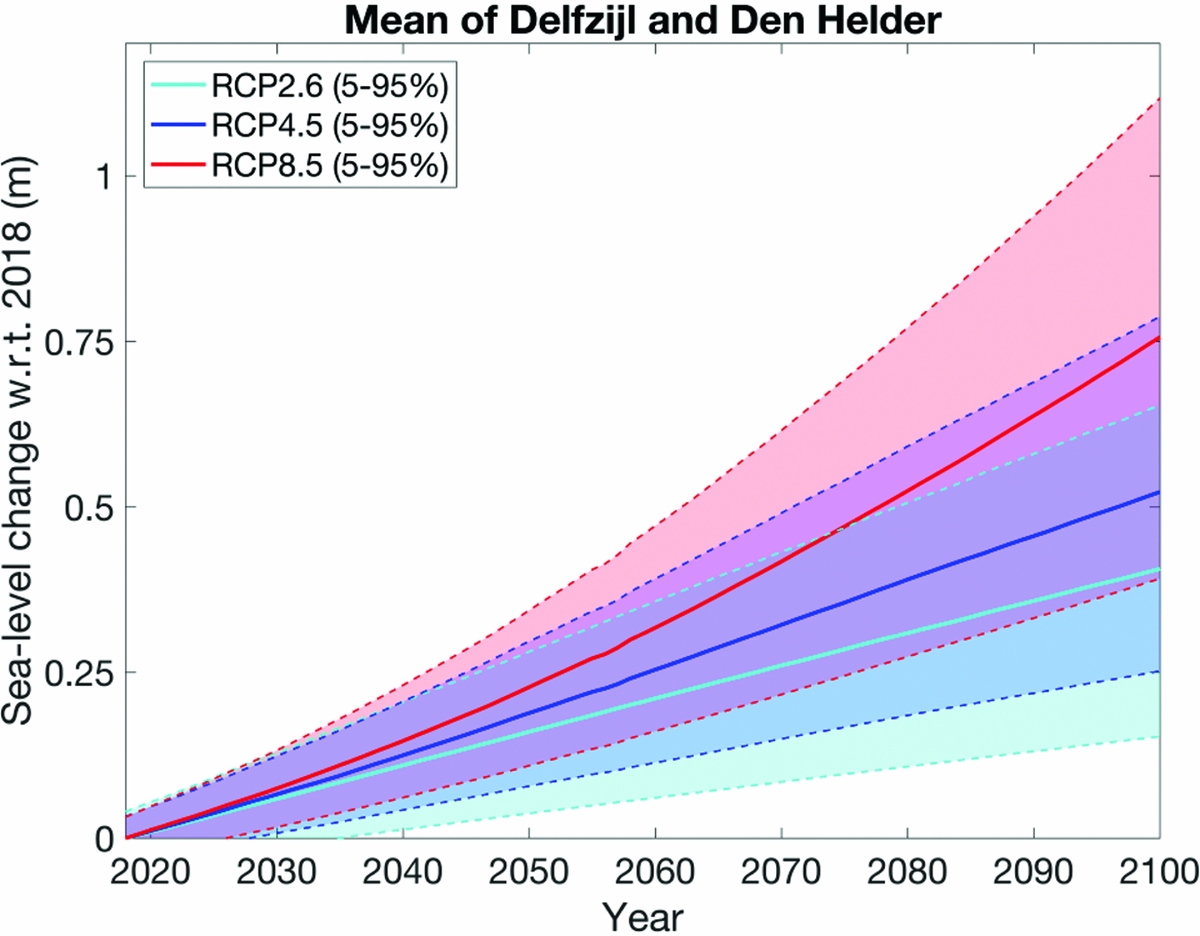
Fig. 2. Sea-level change projections for the Dutch Wadden Sea (mean of stations Den Helder and Delfzijl) for three different emission scenarios over the period 2018–2100. The uncertainty bands indicate the 5th to 95th percentile values. Based on data from Vermeersen et al. (Reference Vermeersen, Slangen, Gerkema, Baart, Cohen, Dangendorf, Duran-Matute, Frederikse, Grinsted, Hijma, Jevrejeva, Kiden, Kleinherenbrink, Meijles, Palmer, Rietbroek, Riva, Schulz, Slobbe, Simpson, Sterlini, Stocchi, Van de Wal and Van der Wegen2018). Figure courtesy of Aimée Slangen.
Table 2. Future median rates of sea-level rise (mma−1) corresponding to the three scenarios, averaged for the locations Den Helder and Delfzijl. From Wang et al. (Reference Wang, Elias, Van der Spek and Lodder2018), based on data of Vermeersen et al. (Reference Vermeersen, Slangen, Gerkema, Baart, Cohen, Dangendorf, Duran-Matute, Frederikse, Grinsted, Hijma, Jevrejeva, Kiden, Kleinherenbrink, Meijles, Palmer, Rietbroek, Riva, Schulz, Slobbe, Simpson, Sterlini, Stocchi, Van de Wal and Van der Wegen2018).
Variability around projected sea-level rise
The projections discussed above are all long-term, and do not take into account local small-scale variability. Vermeersen et al. (Reference Vermeersen, Slangen, Gerkema, Baart, Cohen, Dangendorf, Duran-Matute, Frederikse, Grinsted, Hijma, Jevrejeva, Kiden, Kleinherenbrink, Meijles, Palmer, Rietbroek, Riva, Schulz, Slobbe, Simpson, Sterlini, Stocchi, Van de Wal and Van der Wegen2018) combined the observed variability from the tide gauge stations with the projections to show the local differences on shorter timescales. They used tide gauge observations for the period 1865–2015 to estimate the local variability, and assumed that the distribution of the variability does not change in the future. The rates of change measured at the tide gauge stations have a very wide distribution. The variability reduces if averages are taken over longer periods.
Time-variable sources of uncertainty in the projections
There are various sources of uncertainty that determine the total uncertainty in the projections (see the discussion in Vermeersen et al., Reference Vermeersen, Slangen, Gerkema, Baart, Cohen, Dangendorf, Duran-Matute, Frederikse, Grinsted, Hijma, Jevrejeva, Kiden, Kleinherenbrink, Meijles, Palmer, Rietbroek, Riva, Schulz, Slobbe, Simpson, Sterlini, Stocchi, Van de Wal and Van der Wegen2018). A main source of uncertainty in sea-level projections in the short term is the internal climate variability: natural fluctuations in the climate. This includes large-scale phenomena like the El Niño Southern Oscillation (ENSO) or the North Atlantic Oscillation (NAO), which have a large effect on the climate and which occur on interannual to inter-decadal timescales. These fluctuations can be quite large, especially on a regional scale. A second source of uncertainty in the projections is the choice of emission scenario, which is largely based on the actions taken by society. In the first few decades of the 21st century, the emission scenarios do not yet have a very large effect on the projected sea-level change, as the response of the different processes contributing to sea level is delayed (compare the numbers in Table 1). However, from the mid-21st century the projections start to diverge as a result of the followed scenarios, and therefore have a larger effect on the projected uncertainties (see Fig. 2). A third source of uncertainty is the choice of the climate model used for the projections. There is a significant spread between models, which is due to a number of reasons, such as different model set-up or different parameterizations of sub-grid-scale processes.
Subsidence in the Dutch Wadden Sea
Vertical movement of the land surface and seabed is caused by both natural and anthropogenic processes. We will summarize the processes that take place within the Dutch Wadden Sea.
Natural causes of subsidence
On a timescale of thousands of years, compaction, tectonics and isostasy play an important role. When we measure surface movements, we measure the combined effects of these processes.
The Netherlands are located at the southeast of the North Sea basin and at the mouth of major rivers, where sediments have been accumulating since the beginning of the Tertiary. The weight of the accumulating sediments causes compaction of the underlying strata. Postglacial isostasy is the surface response caused by the reduction of load on it by melting of land ice and glaciers of Scandinavia and Scotland. Tectonic movements are not relevant in the Dutch Wadden Sea. Here, a slow, natural subsidence with expected velocities of less than 1mma−1 was estimated to take place until the present day. More information on natural processes of subsidence can be found in the paper of Vermeersen et al. (Reference Vermeersen, Slangen, Gerkema, Baart, Cohen, Dangendorf, Duran-Matute, Frederikse, Grinsted, Hijma, Jevrejeva, Kiden, Kleinherenbrink, Meijles, Palmer, Rietbroek, Riva, Schulz, Slobbe, Simpson, Sterlini, Stocchi, Van de Wal and Van der Wegen2018) on SLR.
Anthropogenic causes of subsidence
Subsurface activities in the Dutch Wadden Sea comprise gas production and salt mining. Gas production implies the extraction of natural gas from gas reservoirs, in which the virgin pressure of the gas is of the order of the hydrostatic pressure of water at depth. The production of gas causes a decrease in the pressure in the reservoir. This leads to an increase in the effective stresses that the grains in the matrix structure of the reservoir rock exert on each other. Increased effective stresses cause compaction of the reservoir.
The mechanical response of the subsurface formations surrounding the compacting reservoir propagates the compaction of the reservoir to the Earth's surface and causes subsidence. The magnitude and extent of this movement depend, among others, on the depth, the size and the shape of the gas field, the amount of gas produced and the associated pressure drop, possible depletion of connected aquifers, the mechanical properties of the reservoir rock and its geological structure, and the properties of the formations above, below and besides the reservoir.
Salt solution mining is a technology to produce salt from deep rock salt layers. A well is drilled into the rock salt strata, then fresh water is pumped into this well, causing salt to dissolve and a cavern containing brine to develop. This brine is brought to the surface, where the salt is separated. In the salt caverns the brine pressure is kept below the lithostatic pressure. As a result, the elasto-visco-plastic salt is flowing toward the cavern. This is called squeeze mining. After some time, typically two to three years, a dynamic balance develops between cavern volume increase due to the solution process and decrease due to convergence by the creep of salt. Volume and shape of the cavern then stay roughly constant. The cavern convergence induces elastic deformation of the strata around it, which results in surface subsidence. Shape and magnitude of the subsidence bowl depend on the squeeze volume and the properties of the surrounding formations.
Measuring subsidence
Surface subsidence is defined as a relative height change over time between two locations or points. There are various techniques to measure heights, (spatial) height differences, (temporal) height change, or (spatio-temporal) changes in height differences. These techniques can be spaceborne, airborne or terrestrial, and have their own characteristics regarding spatial density of measurements, spatial extent, temporal sampling frequency, temporal extent, geometric sensitivity, and precision. See Fokker et al. (Reference Fokker, Van Leijen, Orlic, Van der Marel and Hanssen2018) for more information. Global Navigation Satellite Systems (GNSS), such as GPS, actually measure 3D positions. In the case of satellite radar interferometry (InSAR), the measurements are taken in the radar line-of-sight between the satellite and the surface. In practice, for subsidence analysis, typically levelling, GNSS and/or InSAR measurements are used.
In the Dutch Wadden Sea, a number of dedicated benchmarks for GNSS and levelling are available. The resulting datasets are complementary, therefore the integration of the various datasets is desirable. Onshore measurements should be included to improve the quality of the result.
Combining models and measurements
The surface movement constitutes a measurable signature of the processes in the reservoir. Such measurements can thus provide information about the subsurface. However, large uncertainties are usually associated with subsurface parameters. Inverse modelling or data assimilation is required to successfully constrain subsurface knowledge and parameters with the use of surface movement data.
Future subsidence in the Dutch Wadden Sea
The aim of the paper by Fokker et al. (Reference Fokker, Van Leijen, Orlic, Van der Marel and Hanssen2018) is to provide estimates of subsidence rates to be expected after 2018. An estimate should always be accompanied by a quality measure: a standard deviation or a confidence range of expected numbers. Measurements should have been used to constrain the forecasts. In order to assess the impact on the larger Wadden Sea development, the subsidence forecasts need to be formulated in terms of volume rates or aerially averaged subsidence rates in the different tidal basins. Table 3 presents the expected subsidence rates for the Vlie, Pinkegat and Zoutkamperlaag basins. Since it is unknown whether there will be any extraction activities beyond 2050, estimates for subsidence in 2100 are not given.
Table 3. Rates of subsidence in the tidal basins in the Dutch Wadden Sea in 2030 and 2050 in mma−1, based on Fokker et al. (Reference Fokker, Van Leijen, Orlic, Van der Marel and Hanssen2018). Estimates for subsidence in 2100 are not given since it is unknown whether there will be any extraction activities beyond 2050. From Wang et al. (Reference Wang, Elias, Van der Spek and Lodder2018).
Development of the sediment budget of the Dutch Wadden Sea until 2100
Sediment-sharing system Wadden Sea
The Wadden Sea is a sediment-sharing system that consists of barrier islands separated by tidal inlets with their associated ebb-tidal deltas and that shelter tidal basins which include tidal flats and salt marshes from open North Sea conditions. Since no rivers debouch into the Dutch Wadden basins, alluvial sediment input can be ruled out and all sediment has to be imported from the North Sea coastal zone. The evolution of a coastal system under the condition of a rising sea level depends on the balance between the creation of accommodation space for sediment, that can be considered sediment ‘demand’, and supply of sediment to fill that space. In a ‘surplus’ situation the accommodation space is filled in with time, and the coastal system will finally accrete seaward, whereas in a ‘deficit’ state coastal erosion is not sufficient to fill the space and the coastline will recede landward. When we apply this principle to the Wadden Sea, the accommodation space in the basins is the driving ‘demand’ and the sediment import by the tidal inlets is the supply. The accommodation space in a back-barrier basin gradually increases due to (1) a rise in mean sea level and (2) regional subsidence of the seabed. Both components contribute to an increase in water depth and can be lumped into relative sea-level rise. Additionally, local subsidence due to gas and salt extraction increases accommodation space at a higher rate. Finally, abrupt changes in the accretionary status of a basin can be caused by the impact of interventions. The import of sand and mud into the Wadden Sea contributes to the infilling of the accommodation space. The sediment will be transported further into the basin through the tidal channels and finally end up in the tidal flats and salt marshes.
Current state of the Wadden Sea sediment budget
Analysis of the bathymetric changes in the Wadden Sea over the period 1935–2005 (Elias et al., Reference Elias, Van der Spek, Wang and De Ronde2012; see figs 2 and 4 in Wang et al., Reference Wang, Elias, Van der Spek and Lodder2018) shows that the seabed in the basins accreted at higher rates than strictly needed for the compensation of the relative SLR that was deduced from tide gauge observations. Large-scale interventions strongly influenced the Wadden Sea basins during this period. The closure of the Zuiderzee with the Afsluitdijk in 1932 had an extensive impact on the western Wadden Sea, whereas the closure of the Lauwerszee in 1969 caused significant changes in the Zoutkamperlaag tidal basin. The western Wadden Sea is relatively deep and used to consist of flood-tidal deltas situated at the seaward end of the Zuiderzee lagoon. The closure caused an increase in the tidal ranges at Texel and Vlie Inlet, while the tidal volumes of these inlets remained more or less constant. The construction of the Afsluitdijk cut off the tidal channels that used to run south into the Zuiderzee, which caused these channels to fill in with predominantly mud. The sediment budget of the western Wadden Sea is deficient; the substantial accommodation space in the basins triggered a large-scale sediment import, especially from the ebb-tidal deltas of the inlets. However, the sediment volume that has been supplied since 1932 has not been able to satisfy this sediment demand. The net annual sediment import has an upper limit; apparently the system is transport-limited. The Zoutkamperlaag channel and its tidal basin reacted fast to the closure of the Lauwerszee, reaching new equilibrium dimensions within 25 years (Van de Kreeke, Reference Van de Kreeke2004). Also, gas extraction in the basins of Pinkegat, Zoutkamperlaag and Groninger Wad did not cause noticeable subsidence of the tidal-flat surface, despite the measured subsidence of the deeper layers in the subsurface; apparently the increase in accommodation space for sediment has been filled instantly. This can be explained from large gross sediment transports in the system that can fill an increase in accommodation space quickly: the system is accommodation-limited. See Wang et al. (Reference Wang, Elias, Van der Spek and Lodder2018) for further details.
Effect of an increase in sediment accommodation space
Acceleration in SLR and the ongoing subsidence due to mining activities in the coming decades will increase the accommodation space in the individual tidal basins. The current long-term averaged value for sediment import into the western Wadden Sea has not been adequate to fill the demand in the basins in the western Wadden Sea since the construction of the Afsluitdijk. A future increase in relative SLR will aggravate this situation. For the eastern Wadden Sea the situation is different. Here, an increase in accommodation space can be satisfied from the gross transports until the maximum sediment transport capacity in the inlets is reached. From then on, the accommodation space will grow faster than the supplied volume of sediment, and a deficit will develop.
Exceeding critical rates of sea-level rise
When we increase the presented SLR scenarios with the subsidence estimates, together the relative SLR, and compare these rates to critical threshold rates calculated for the individual tidal basins (see Wang et al., Reference Wang, Elias, Van der Spek and Lodder2018), we can determine the moment the rate of relative SLR exceeds the critical rate. In that case, the maximum imported sediment volume can no longer compensate the increase in accommodation space in a basin and the intertidal flats will start to diminish in surface area and/or height (‘drowning’). It should be emphasised that exceeding the critical rate of SLR in a basin does not mean that the total intertidal flat area in a tidal basin is then permanently inundated.
Under the RCP2.6 scenario, the median sea level will increase linearly by c.5mma−1 until 2100 (Table 2). The additional subsidence will cause minor increases for some basins. All rates of relative SLR are below the critical rate for drowning of the inlet systems in the Dutch Wadden Sea (see Table 4a). According to scenario RCP4.5, the critical SLR rate will be exceeded in 2030 for Vlie Inlet (Table 4b). For the other basins the critical rate will not be exceeded until 2100 or later. According to scenario RCP8.5, the critical SLR rate will be exceeded for Vlie Inlet (from 2030), Texel Inlet (from 2050) and Ameland Inlet (in 2100) (see Table 4c). For the other small tidal basins the critical rate will not be exceeded until after 2100.
Table 4. Rates of critical sea-level rise Rc for the various tidal basins in the Dutch Wadden Sea as deduced with the ASMITA (Aggregated Scale Morphological Interaction between Tidal inlets and the Adjacent coast) model, rates of local accelerated sea-level rise for the Dutch Wadden Sea (from Table 2), extra relative sea-level rise caused by subsidence (from Table 3) and the total relative sea-level rise for 2030, 2050 and 2100, for different emission scenarios. Numbers in bold indicate rates of relative sea-level rise that exceed the critical rate per tidal basin.
‘Drowning’ of the intertidal flats
A sediment deficiency will result in erosion of the intertidal flats and lead to a declining surface area and mean height of those areas. For example, according to scenario RCP4.5 the critical rate in the Vlie Inlet will be exceeded around the year 2030. The SLR rate will then be just above the critical rate of 6.3mma−1. The observed long-term sedimentation rate in the basin of Vlie Inlet is about 4.7mma−1 (see fig. 4 in Wang et al., Reference Wang, Elias, Van der Spek and Lodder2018). If this long-term sedimentation rate remains the same (despite the changing hydraulic conditions), the SLR rate will exceed the sedimentation rate by approximately 2mma−1 until 2100. As the tidal range in the basin is almost 2m, complete drowning will be achieved in about 1000 years. Similarly, according to scenario RCP8.5 the SLR will exceed the sedimentation rate of 4.7mma−1 by about 3mma−1 in 2030, almost 5mma−1 in 2050 and 7.2mma−1 in 2100 (see Table 2 for rates of SLR). The complete drowning will then be about three centuries from now. We can thus conclude that none of the tidal basins in the Dutch Wadden Sea are likely to be drowned by 2100, even if the most pessimistic scenario of SLR comes true. However, the change in vertical height of the intertidal area cannot be translated directly into loss of surface area, since the distribution of surface area over height is not linear (see fig. 11 in Wang et al., Reference Wang, Elias, Van der Spek and Lodder2018). Moreover, the way the intertidal flats in a basin will react to ‘drowning’ is not clear. It is highly possible that erosion of tidal flats in one place will produce the sediment volume to maintain flats in other places.
In order to get an indication of the effects of the three sea-level scenarios on the intertidal morphology, Wang et al. (Reference Wang, Elias, Van der Spek and Lodder2018) evaluated the extra over-depth due to relative sea-level rise. They assumed a sedimentation rate of 4.5mma−1, which is more or less the long-term averaged rate of observed sedimentation in the western part as well as in the eastern part of the Dutch Wadden Sea. By definition, the area of the intertidal flat is the difference between the area at HW and that at LW according to the hypsometric curve (see fig. 3c in Wang et al., Reference Wang, Elias, Van der Spek and Lodder2018). The loss of area of intertidal flat due to sea-level rise is estimated by heightening the LW with the over-depth. According to the relation shown in figure 11 in Wang et al. (Reference Wang, Elias, Van der Spek and Lodder2018), the Dutch Wadden Sea would be practically drowned at an extra over-depth of more than 1m. Table 5 gives the percentage loss of intertidal flat area in the Dutch Wadden Sea corresponding to the estimated extra over-depth for the three scenarios.
Table 5. Development of extra over-depth and the corresponding percentage loss of intertidal flat area due to sea-level rise according to the three scenarios. From Wang et al. (Reference Wang, Elias, Van der Spek and Lodder2018).
What will the future Wadden Sea look like?
The wide range of projected SLR as a result of different climate scenarios constitutes the largest contribution to the uncertainty about the future state of the Wadden Sea. For the near future, up to 2030, the effect of accelerated SLR will be limited and hardly noticeable. Over the long term, up to 2100, the projected change largely depends on the climate scenarios (Table 4). In the RCP2.6 scenario, there will be hardly any effect due to SLR until 2100, whereas in the RCP8.5 scenario the effect will be noticeable already in 2050. Vermeersen et al. (Reference Vermeersen, Slangen, Gerkema, Baart, Cohen, Dangendorf, Duran-Matute, Frederikse, Grinsted, Hijma, Jevrejeva, Kiden, Kleinherenbrink, Meijles, Palmer, Rietbroek, Riva, Schulz, Slobbe, Simpson, Sterlini, Stocchi, Van de Wal and Van der Wegen2018) also present other, more extreme scenarios, such as the scenario according to De Conto & Pollard (Reference De Conto and Pollard2016) predicting a total SLR of about 1.7m in 2100. If such an extreme scenario becomes truth, the Wadden Sea will be practically drowned before 2100.
The conceptual model for channel–shoal interaction presented in Wang et al. (Reference Wang, Elias, Van der Spek and Lodder2018) can help to deduce what the consequences of inadequate sediment supply for the intertidal morphology might be. The shoal edge is the most dynamic part where breaking waves erode and tidal flow supplies sand. A structurally decreased sediment supply will result in net erosion of these edges since the wave activity in the basin will not be directly influenced by the changes. Also, the higher parts of the shoal will experience net erosion since only part of the sand removed by waves will be replaced. The eroded sand will end up in the tidal channels and is in principle available for resedimentation on the shoals. Where the sand will end up depends on local energy conditions that are not clear beforehand. However, it is likely that tidal flats close to the tidal inlet will be influenced the least, since the net supply from outside the basin will pass through there and the local balance between supply and erosion is not likely to change. This is in accordance with the model for Holocene tidal basins under the influence of high rates of SLR that was presented by Van der Spek & Beets (Reference Van der Spek and Beets1992): sandy intertidal flats near the inlet and along the main channels, resembling a flood-tidal delta, and a subtidal lagoon further landwards where predominantly mud accumulates. Whether the latter situation will develop in the future Wadden Sea is not clear. There is no reason to assume that future concentrations of suspended matter will decrease, but the accumulation of fine-grained material depends on the local energy level. The present-day Wadden Sea comprises comparatively few sheltered areas where mud would settle, since these areas have been reclaimed in the past. This results in a larger impact of the predominantly westerly winds on the hydraulic conditions in the basins. An increase in average depth in the basins and the expansion of open water will render them more susceptible for local wave-growth and wind-driven currents.
Acknowledgements
This study into the future of the Dutch Wadden Sea was initiated by the Wadden Academy and the Programme towards a Rich Wadden Sea (Programma naar een Rijke Waddenzee). I would like to thank Hessel Speelman, Klaas Deen and Hein Sas for their enthusiastic support of this work. The writing of this synthesis would not have been possible without the pleasant cooperation of Bert Vermeersen, Aimée Slangen, Peter Fokker and Zheng Bing Wang, the lead authors of the papers on sea levels, subsidence and sediments in this volume. The paper benefited from the suggestions of seven anonymous reviewers.


 Open access