


The corrigendum is about Fig. 7 in the original paper by Bungenstock et al. (Reference Bungenstock, Freund and Bartholomä2021), which also affects the last paragraph in the discussion and respective statements in the conclusions and abstract.
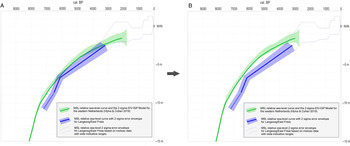
Figure 7 of the original paper depicts the RSL curve and envelope for the Langeoog area in comparison with the western Netherlands RSL curve and envelope by Hijma and Cohen (Reference Hijma and Cohen2019). By importing the western Netherlands curve in the age-depth diagram of the Langeoog curve, the western Netherlands curve was unfortunately wrongly stretched to 2000 cal BP instead of 3000 cal BP, which results in an incorrect overlap of the error envelopes (Fig. 1A in this corrigendum).

Fig. 1. A: Curve of the western Netherlands and Langeoog as wrongly plotted in Fig. 7 in the original publication. B: Corrected plot of the two curves showing almost no overlap of the error envelopes and a wider offset than depicted before.
When plotting the western Netherlands curve in correct position in the Langeoog age-depth diagram (Fig. 1B of this corrigendum), the two curves show no overlapping of the 2 sigma error envelopes since about 6000 cal BP, only around 3500 cal BP there is a beginning overlap of the error envelopes. Additionally, the two curves show an offset of more than decimetre range as it was described in the original paper. The offset between the correctly depicted RSL curves is about 0.8 m around 6000 cal BP and 3000 cal BP and up to 1.6 m at the straight part of the Langeoog curve between 6000 and 3000 cal BP. For this segment, the offset was originally described to be up to 0.8 m probably as an effect of lacking data of this time span that causes the straight shape of the curve. More data and a more curved course of the Langeoog dataset would diminish the offset, but it would be still much higher than reported in the original paper. The originally cited offset of 0.8 m resulting from the wrong plot in Fig. 7 in the original publication is repeated in the abstract.
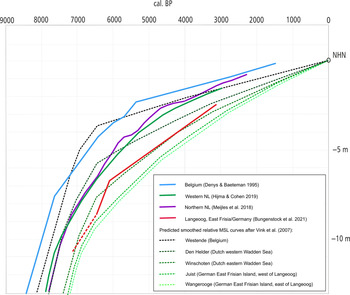
In the discussion, the western Netherlands curve is also compared with the predicted Wangerooge MSL curve after Vink et al. (Reference Vink, Steffen, Reinhardt and Kaufmann2007). Wangerooge is located 20 km east of Langeoog and therefore serves as a good comparison. Around 6000 cal BP, the Wangerooge curve lies almost 3 m below the western Netherlands curve, and around 3000 cal BP, it lies about 1.5 m below as already described in the original publication. These values are correct. It is also correct that the Langeoog curve plots upwards of the Wangerooge curve and that the offset between the western Netherlands curve and Wangerooge with values of 1.5–3 m is higher than the offset between the western Netherlands curve and the Langeoog curve with values of 0.8–1.6 m (Fig. 2), although in the original publication the discrepancies between the western Netherlands and the Langeoog curve were assumed to be smaller due to the wrong plotting.

Fig. 2. Four examples of RSL curves along the southern North Sea coast from Belgium in the west to Langeoog in the east plotted together with the predicted relative MSL curves resulting from the GIA modelling by Vink et al. (Reference Vink, Steffen, Reinhardt and Kaufmann2007). Modified after Vink et al. (Reference Vink, Steffen, Reinhardt and Kaufmann2007) and Meijles et al. (Reference Meijles, Kiden, Streurman, Van der Plicht, Vos, Gehrels and Kopp2018).
By repeating the offset resulting from the wrongly plotted curves in Fig. 7 in the original publication, the authors concluded that the GIA effect for the last 6000 years is probably less than predicted so far. With the corrected plot and values (Fig. 1B), one could assume that this conclusion should be considerably softened. This would be a misleading causality as this conclusion is not only derived from the comparison of the wrongly plotted curves but also from the comparison with the predicted relative MSL curves by Vink et al. (Reference Vink, Steffen, Reinhardt and Kaufmann2007), in particular the Wangerooge curve. When plotting four examples of relative MSL curves from the southern North Sea coast, as there are Belgium (Denys & Baeteman, Reference Denys and Baeteman1995), western Netherlands (Hijma & Cohen, Reference Hijma and Cohen2019), northern Netherlands (Meijles et al., Reference Meijles, Kiden, Streurman, Van der Plicht, Vos, Gehrels and Kopp2018) and East Frisia (Bungenstock et al., Reference Bungenstock, Freund and Bartholomä2021), together with the predicted MSL curves by Vink et al. (Reference Vink, Steffen, Reinhardt and Kaufmann2007), with Juist located 35 km west of Langeoog and Wangerooge located 20 km east of Langeoog (Fig. 2), it becomes obvious that the GIA offset is less than predicted for the last 6000 years although it is not as much less than assumed when comparing only the wrongly plotted curves in Fig. 7 in the original publication.
Acknowledgements
We thank Kim Cohen who hinted on the wrong plot. This gave us the chance to write the corrigendum to correct this sensitive error.

 Open access