


Introduction
Sugar has been described as a ‘ubiquitous term’, difficult to both define and measure, which may be in part due to its dual function as both a nutrient and as an ingredient(Reference Fidler Mis, Braegger and Bronsky1). A form of carbohydrate, chemically, the term ‘sugars’ usually describes mono- and disaccharides, with examples of monosaccharides being glucose, galactose and fructose and examples of disaccharides being sucrose, lactose and maltose. Examples of some natural contributing food sources include fruits (fructose, glucose, sucrose), honey (fructose, glucose, sucrose), milk and milk products (galactose, lactose), and table sugar (sucrose). Such ‘-ose’ sugars can also form the building blocks of other carbohydrate types, such as oligosaccharides and polysaccharides. In addition, sugars in many of the above forms may be added as an ingredient to foods during processing or preparation to preserve food and/or to confer functional properties, such as viscosity, texture, body and colour, or at the table by consumers to add sweetness(Reference Fidler Mis, Braegger and Bronsky1,Reference Clemens, Jones and Kern2) . As a result, there is a broad range of foods containing sugars with varying quantities depending on the desired function, individual preference and food form. As a carbohydrate form, sugars, regardless of type, contribute 3·75 kcal/g, which is equivalent to the contribution from starch.
Whilst the relationship between the frequency of consumption of foods containing sugars (particularly sucrose) and dental caries is well established(3–5), there is debate concerning the relationship between dietary sugar intake and other health outcomes such as obesity, type 2 diabetes and cardiovascular disease. The evidence has been critiqued and systematically reviewed both in scientific publications(Reference Prinz6,Reference Johnson, Appel and Brands7) and by advisory bodies and competent authorities(3–5,Reference Tappy, Morio and Azzout-Marniche8,9) with no firm conclusion that dietary sugars are directly related to diet-related diseases other than as a source of dietary energy particularly implicated as a contributor towards positive energy balance. As an individual dietary sugar, fructose has been identified of note, particularly with respect to metabolic health and hyperuricemia; however, as yet, no agreed conclusion has been reached regarding fructose(Reference Jamnik, Rehman and Blanco Mejia10,Reference Dornas, de Lima and Pedrosa11) . The strongest available evidence of any link between dietary sugars and health is for body weight, and following the consumption of sugar-sweetened beverages rather than sugars or a single sugar per se (5,Reference Lobstein12,Reference Te Morenga, Mallard and Mann13) . At the request of a number of countries in the wider Nordic region, the European Food Safety Authority (EFSA) is currently (2020) undertaking a renewed review of the evidence to provide scientific advice on dietary sugars and to derive a tolerable upper intake level (UL) for total/added/free dietary sugars(14). A draft for public consultation is expected in mid-2021.
In light of this continuing focus on sugars and their role in health, it is important to review current estimates of intake globally and to place these in context against recommendations. This allows generation of a benchmark for ongoing surveillance. Previously, there have been three reviews covering dietary sugars intakes, one with a global perspective(Reference Newens and Walton15) a second focused on European countries(Reference Azaïs-Braesco, Sluik and Maillot16) and a third focusing on Latin American countries(Reference Fisberg, Kovalskys and Gómez17). However, there exists a need to capture more recent data on a global basis and in a consistent balanced manner. The current review provides an up-to date critique of sugars in terms of their classification and dietary recommendations. A secondary analysis of the available data on dietary sugar intakes worldwide is described, followed by a perspective on the role of sugars in the diet globally.
Classification and definitions of dietary sugars
The term ‘sugars’ is conventionally used to define the mono- and disaccharides in foods (also known as total sugars). This includes naturally occurring sugars as well as those added to a food or drink (such as sucrose, fructose, maltose, lactose, honey, syrup, corn syrup, high-fructose corn syrup, molasses and fruit juice concentrate) but does not include polyols. Other definitions of dietary sugars are typically either linked to function in terms of establishing dietary recommendations, or they inform regulations and food labelling. With respect to definitions used to underpin dietary recommendations, the key terms are ‘total sugars’ (as defined above), ‘free sugars’, ‘added sugars’ and, historically, ‘non-milk extrinsic sugars’ (UK only). Table 1 provides a brief description of these definitions and issuing guidance body. Of note, the term ‘total sugars’ provides the most encompassing measure of dietary sugars intake, used widely in food labelling and for informing consumers about the total sugars content of foods and drinks. The use of the term ‘total sugars’ in food labelling is mainly due to there currently being no accepted method for empirically measuring free sugars or non-milk extrinsic sugars in a food/drink. However, it is less frequently used in dietary recommendations(Reference Mela and Elizabeth18). Terms that are used more frequently in dietary recommendations include ‘free’ or ‘added’ sugars(Reference Buyken, Mela and Dussort19). Both EFSA (Europe) and the Institute of Medicine (United States) define added sugars as all sugars that are added to foods and beverages by the manufacturer, cook and consumer, but do not include natural sources of sugars such as those included in unsweetened fruit juices(3,20) . On the other hand, free sugars, as defined by WHO and EFSA, include all added sugars but also those sugars naturally present in honey, syrups and fruit juices(4,21) . Such divergence in definitions for sugars is reflected in varying descriptions when reporting on dietary intake, in varying use of the terms in food regulations and even in defining the composition of formulae and foods for infants and young children(Reference Fidler Mis, Braegger and Bronsky1).
Table 1. Definitions of sugars as used in dietary recommendations
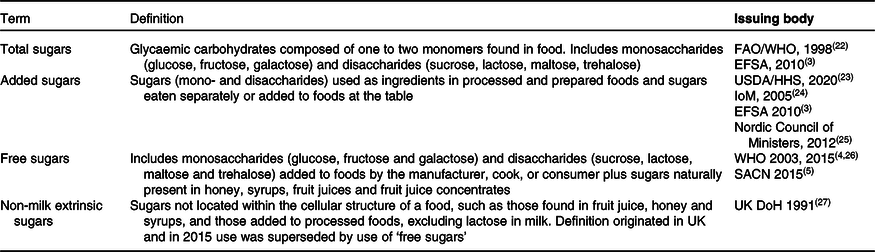
FAO/WHO (Food and Agriculture Organization and the World Health Organization), 1998. Carbohydrates in human nutrition. Report of a Joint FAO/WHO Expert Consultation, Rome, Italy, 14–18 April 1997. EFSA NDA Panel (EFSA Panel on Dietetic Products, Nutrition and Allergies), 2010. Scientific Opinion on Dietary Reference Values for carbohydrates and dietary fibre.
EFSA Journal 2010;8(3): 1462, 77 pp. https://doi.org/10.2903/j.efsa.2010.1462.
IoM (Institute of Medicine), 2002. Dietary reference intakes for energy, carbohydrate, fiber, fat, fatty acids, cholesterol, protein, and amino acids.
Dietary guidelines for sugars consumption
Universally, most food-based dietary guidelines make the sensible and pragmatic suggestion for populations to limit the consumption of foods of low nutrient density, such as foods of low dietary quality that are high in calories, sugar, salt and/or fat, especially saturated fat. In recent years, many government and health organisations worldwide have revisited their guidance for dietary sugar intake, particularly in relation to maximum recommended intakes for added or free sugars. Some of these goals are average population maximum targets, and some are recommendations for intakes at the individual level. Examples of current recommendations relating to quantitative guidelines for dietary sugars are included in Table 2 and are summarised briefly below.
Table 2. Examples of dietary reference values for sugars globally
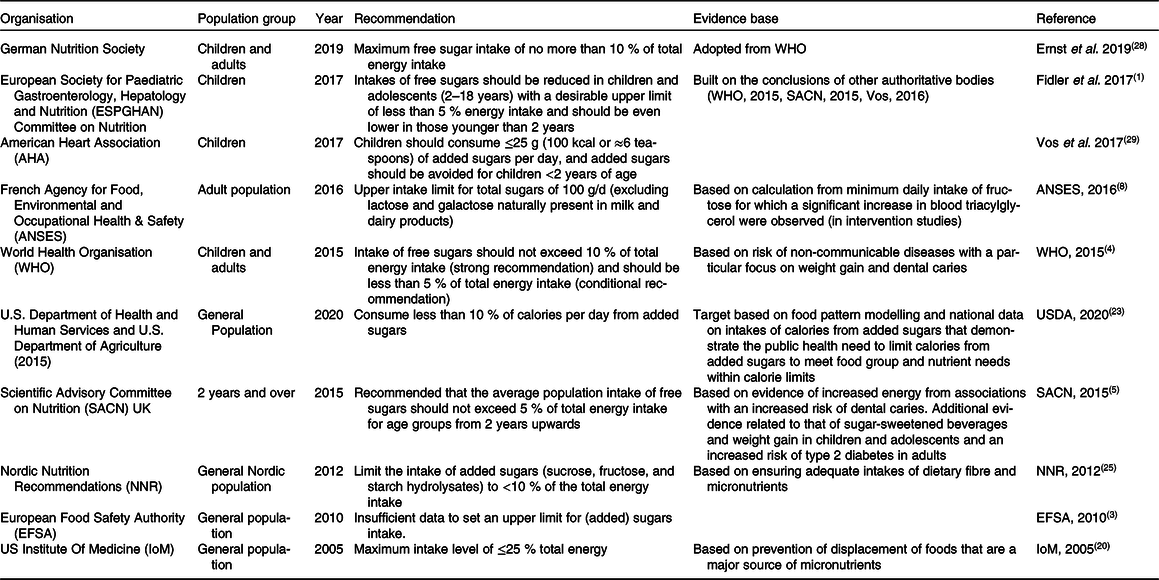
For free sugars, the World Health Organisation (WHO) recommends that all individuals, both adults and children, reduce their intake of free sugars to <10% energy (E) intake and suggest a further conditional recommendation of reduction to <5% E for further health benefits(4). This <5%E value is also proposed by both the UK Scientific Advisory Committee on Nutrition (SACN) (as an average population maximum target) and by the European Society for Paediatric Gastroenterology Hepatology and Nutrition (ESPGHAN) (as individual guidance). Of note, there is a differing body of evidence underpinning these recommendations. Whilst SACN focus on intervention and prospective cohort studies relating to the intake of sugars to energy intake and to an increased risk of dental caries and type 2 diabetes mellitus(5), the ESPGHAN recommendation(Reference Fidler Mis, Braegger and Bronsky1) is informed by the conclusions of both WHO and SACN(4,5) rather than by independent analyses. Of note also, ESPGHAN suggest children under 2 years of age should have even lower intakes than the <5%E(Reference Fidler Mis, Braegger and Bronsky1).
For added sugars, both the Nordic countries and the United States recommend limiting the intake of added sugars to <10%E(23,25) . In both cases, these recommendations were in the context of healthy dietary patterns rather than any link with disease risk, a major difference to recommendations for free sugars. Whilst the American Heart Association (AHA) in the United States have listed a UL for children(Reference Vos, Kaar and Welsh29), this was not reflected in US national guidelines, which were unable to establish this guidance value owing to lack of evidence. In the absence of such scientific evidence, the IoM suggested that intakes above 25%E from added sugars may be associated with displacement of foods that are major sources of essential micronutrients, but they were unable to set a UL at that time (2002) and have not set one since(9). Of note, the French Agency for Food, Environmental and Occupational Health & Safety (ANSES) have set an upper limit for total sugars of 100 g/d for adults, but this excludes lactose and galactose naturally present in milk and dairy products(Reference Tappy, Morio and Azzout-Marniche8). As mentioned previously, the EFSA is currently mandated to provide scientific advice on dietary sugars and to establish a UL if the available data allow it, having previously being unable to set such a benchmark in 2010(3). It is unknown yet how an establishment of such a UL may influence national dietary guidelines within Europe: currently, whilst some European countries have quantitative limits established, such as the Nordic countries, the UK and France, others such as Germany have adopted the WHO recommendations(Reference Ernst, Arens-Azevêdo and Bitzer28). What is currently known regarding the EFSA scientific evaluation is that the exposure assessment will focus on intake of free sugars and that the disease endpoints of interest will include incidence/severity of dental caries and incidence of metabolic diseases. Other less direct endpoints will include measures of body fatness, ectopic fat distribution, glucose homeostasis and blood lipids among others(14). As we await the findings of this EFSA scientific opinion, recent reviews suggest that, for numerical dietary sugar recommendations, more explicit quantification, justifications and communication of uncertainty factors, together with greater international harmonisation for both exposures and outcomes, would help to minimise any variation in recommendations(Reference Fisberg, Kovalskys and Gómez17,Reference Buyken, Mela and Dussort19,Reference Erickson, Sadeghirad and Lytvyn30) . An update of these reviews is included below.
Sugar intake data
Selection of data
Recent reviews of dietary surveys (published between 2014 and 2018) were used to identify a list of countries that have undertaken dietary surveys and the dates that these surveys were performed(Reference Rippin, Hutchinson and Evans31–Reference Song and Song34). These were then supplemented with searches of databases such as Science Direct, PubMed and Google Scholar using terms such as ‘national dietary survey’ and ‘sugar(s) consumption’. As nutrient and food intakes derived from national food consumption survey data are typically published in reports, rather than peer-reviewed papers, the data presented in the present review were primarily collected from various reports and publications of national dietary surveys. Surveys and reports known to the authors of the present study were also included. Peer review publications were used to obtain additional data, for countries including New Zealand, Mexico, Spain, Brazil, the United States and Ireland. Studies were included if the data were (i) nationally representative, (ii) available in the public domain, (iii) summarised (no raw data were analysed) and (iv) collected at the individual level, and if (v) sugar intake was reported as a nutrient rather than a food group. There was no limit to the study size, and data from all available direct dietary assessment methodology were included, including food diaries, diet recalls or food frequency questionnaires.
Presentation of data
In an attempt to assess the available evidence which quantifies dietary sugar intake, a secondary analysis of published intake data for all sugar forms has been completed, and the findings (as reported in their original form) are reported in Tables 3–7 and summarised below. Energy values have been included to allow others to make crude estimates of sugars intakes as a percentage of energy where these data were not in the original reports.
Table 3. Energy and sugar intake of infants and young children (<4 years)
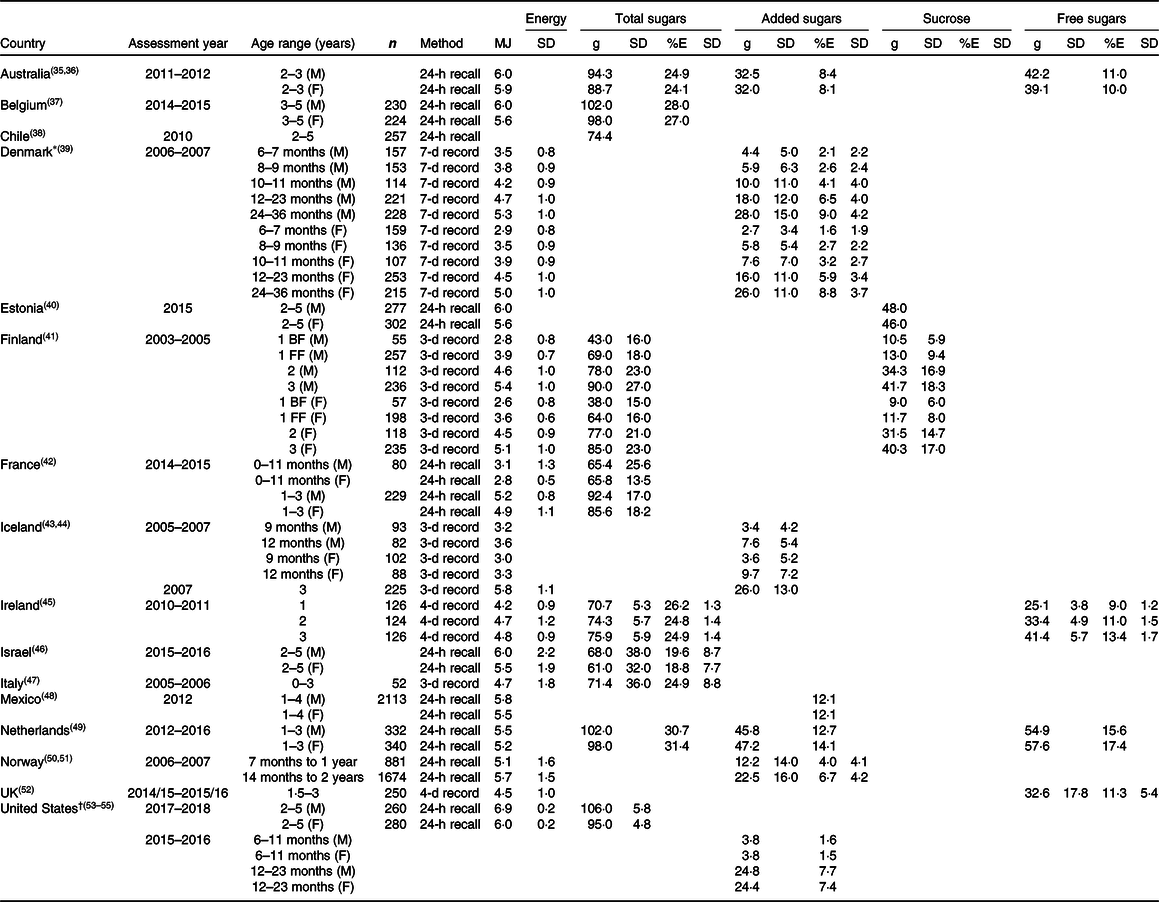
M: male; F: female.
BF: breastfed; FF: formula fed.
* Energy values per 10 MJ.
† United States reports SEM.
Table 4. Energy and sugar intake of children (4–12 years)
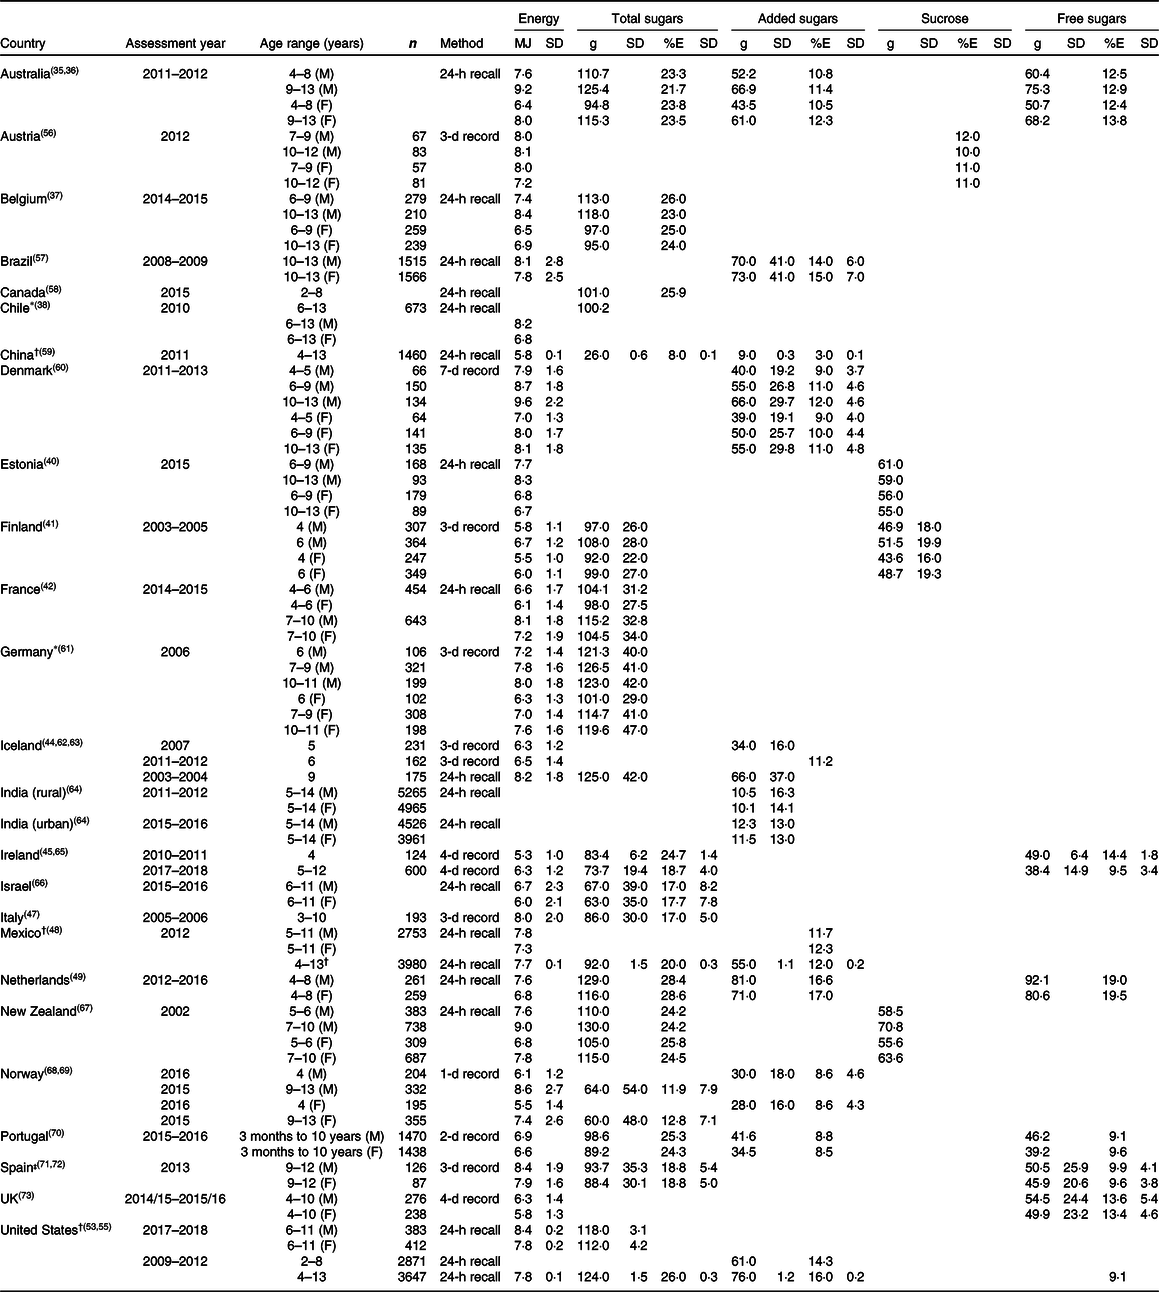
M: male; F: female.
* Chile and Germany report median intakes.
† China, Mexico (4–13) and United States report SEM.
‡ Spain energy intake from ANIBES (2014). Sugar intake reported from Ruiz et al. (2017).
Table 5. Energy and sugar intake of adolescents (˜13–18 years)
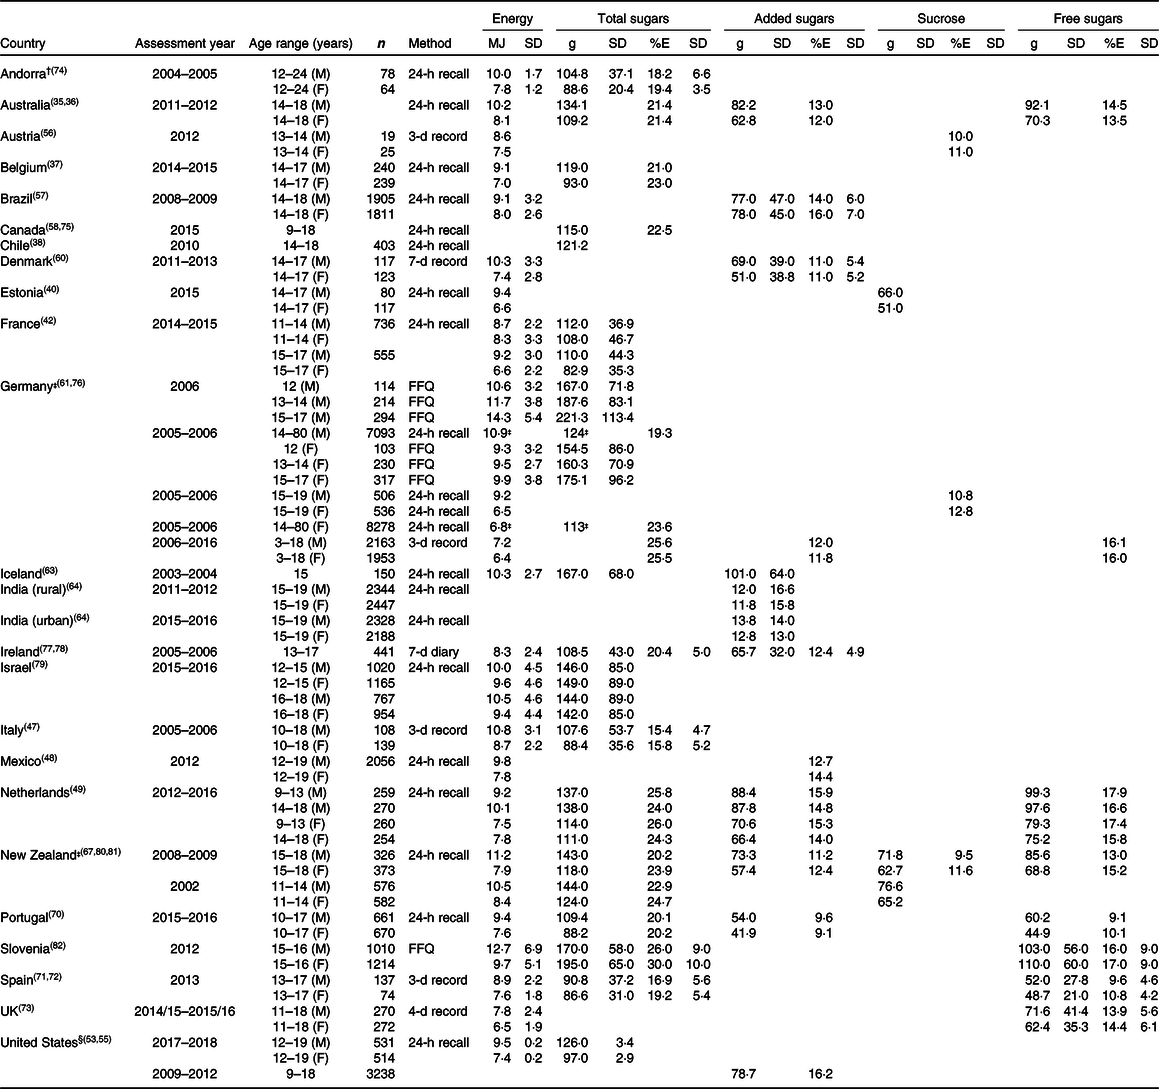
M: male; F: female.
† Total sugars for Andorra reported as digestible sugars.
‡ Germany and New Zealand report median values.
§ United States reports SEM.
Table 6. Energy and sugar intake of adults (19–64 years)
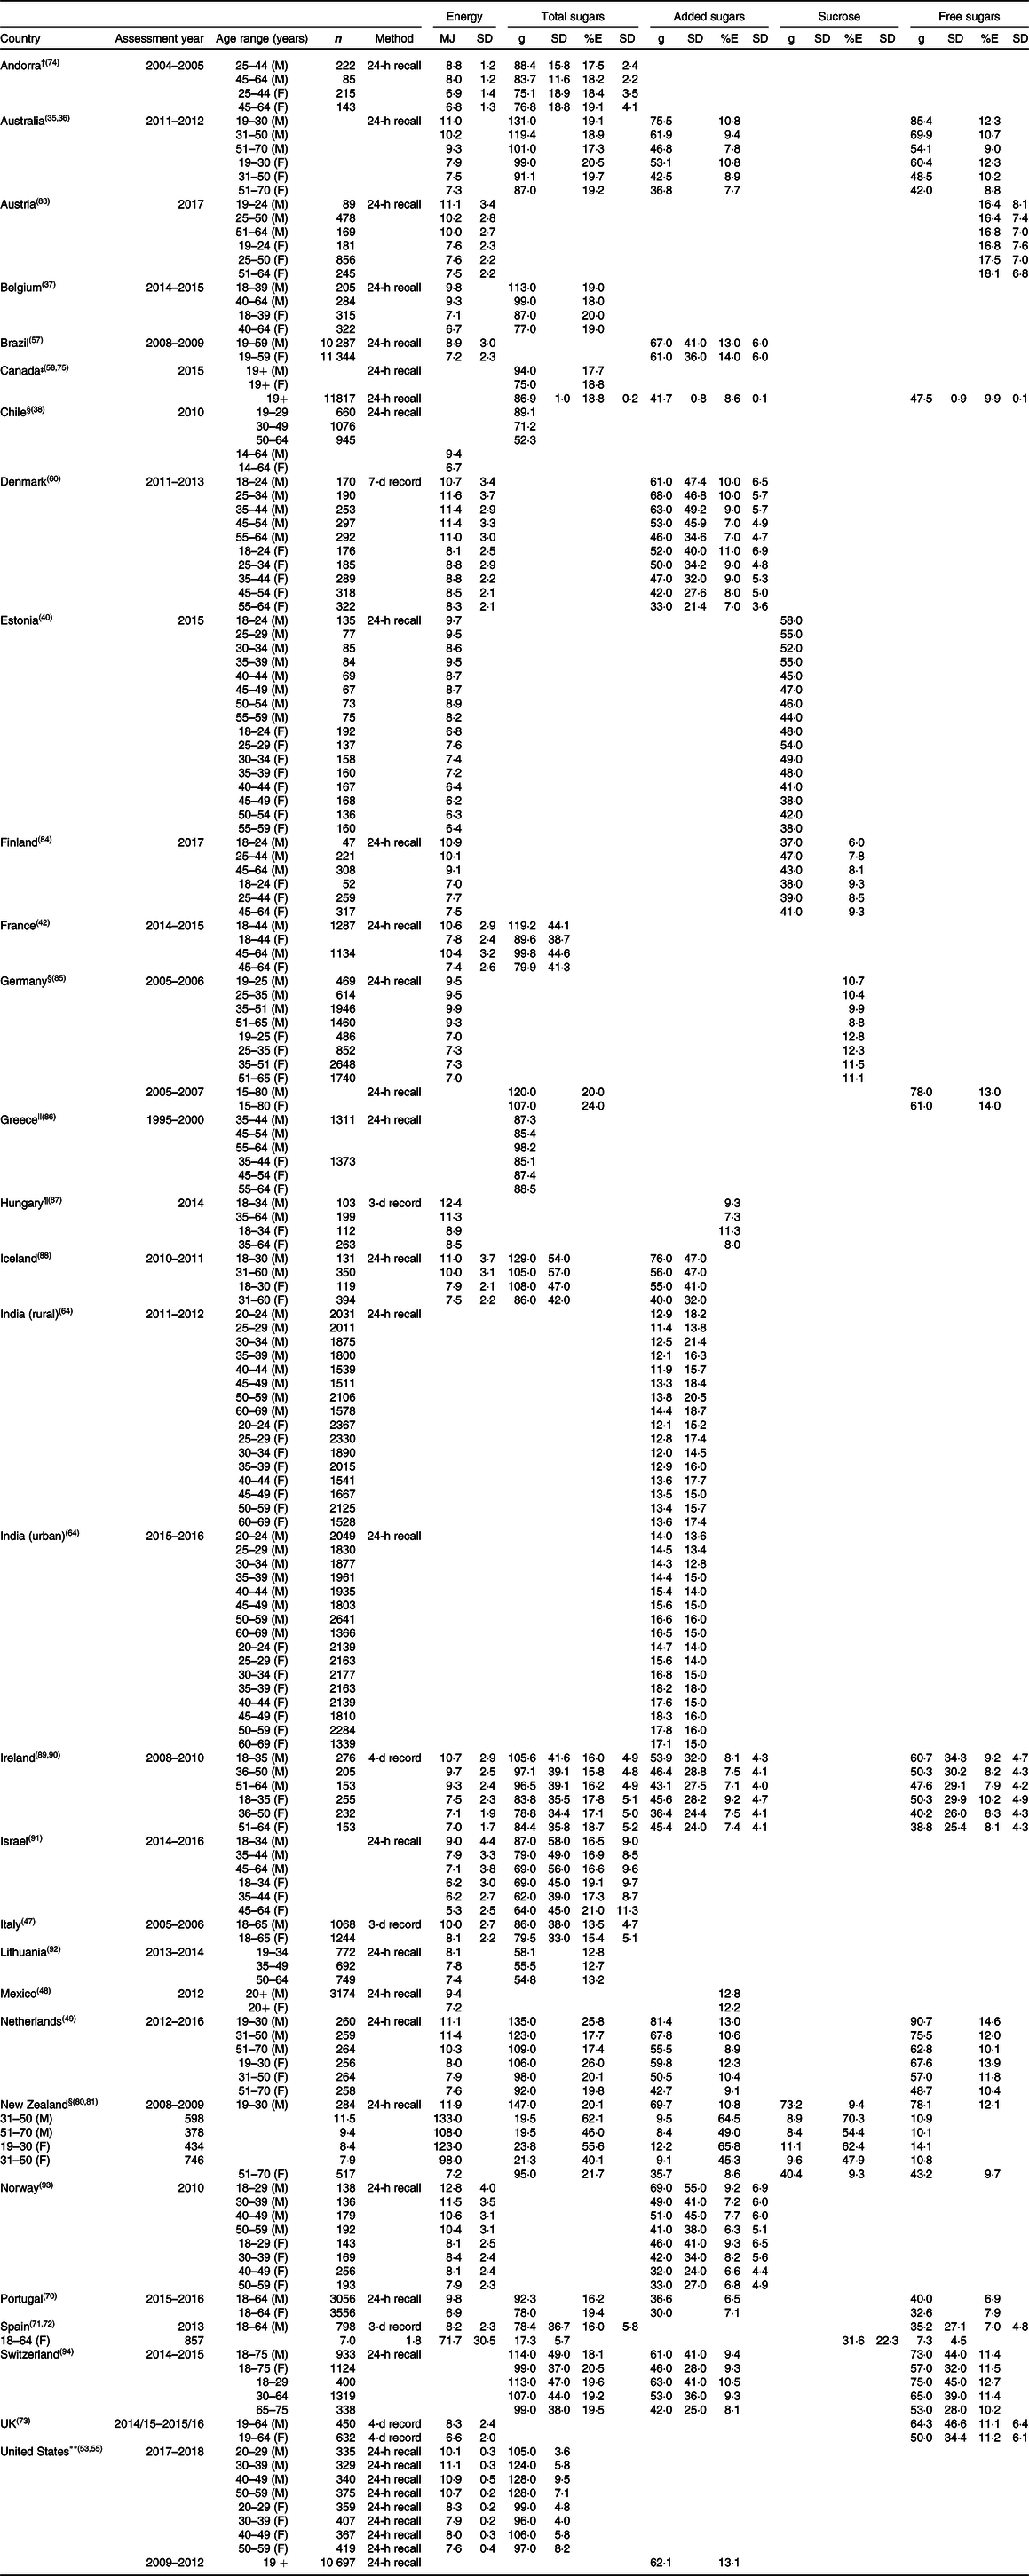
M: male; F: female.
† Total sugars for Andorra reported as digestible sugars.
‡ Canada variance reported as standard error (SE), not SD. Intakes for adults not split by sex, based on the first day recall, not usual intake.
§ Chile, Germany and New Zealand report median values.
|| Greece n-values include older adults, but data are for age groups as reported.
¶ Hungary mono- and disaccharides added to foods, foodstuffs during production or preparation, and natural sugars in honey.
** United States reports SEM.
Table 7. Energy and sugar intake of older adults (65+ years)
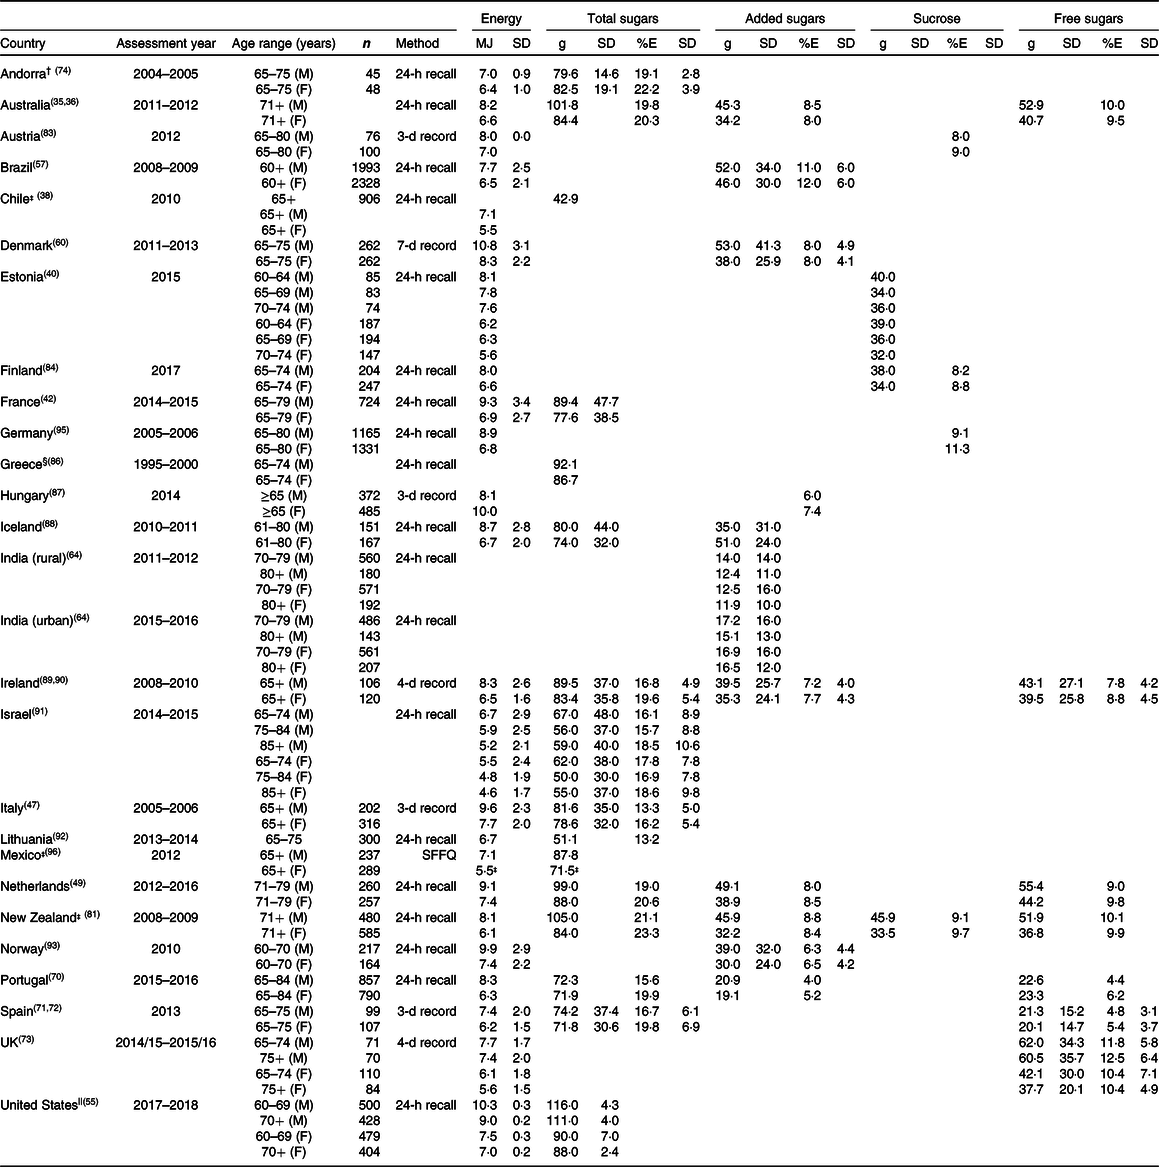
* M: male; F: female.
† Total sugars for Andorra reported as digestible sugars.
‡ Chile, Mexico and New Zealand report median.
§ n-Values combined for 19–59 and 65–74 years for Greece.
|| United States reports SEM.
Values are reported for estimated intakes of energy, total sugars, added sugars, free sugars or sucrose as available. Where energy was provided in kcal, it was converted to MJ using a factor of 238·85. Data are presented as provided in the reports and publications, and where possible, data have been divided by age range and not subdivided by sex. No statistical analysis has been performed on these data sets, and the results are purely descriptive. Under-reporting of food consumption can influence the accuracy of dietary intake data, resulting in an underestimate of energy and nutrients. The data presented in the tables do not account for under-reporting as under-reporters are not typically excluded from data presented in reports of food and nutrient consumption. Additionally, the data are usually presented as a percentage of energy intake, which partially accounts for this but will still result in an underestimate of sugar intake if foods/drinks that are high in sugar are selectively under-reported. It should also be noted that there are significant limitations in comparing sugar intakes across countries (from different time points) since the composition of individual foods and beverages may have changed drastically over that time and may not be reflective of current consumption.
Children (<4 years)
For infants and very young children (<4 years), sugar intake data are available for 16 countries: Australia, Belgium, Chile, Denmark, Estonia, Finland, France, Iceland, Ireland, Israel, Italy, Mexico, the Netherlands, Norway, the UK and the United States (Table 3). These include intakes of total sugars (nine countries), added sugars (seven countries), free sugars (four countries) and sucrose (two countries).
Total sugar intake expressed as a percentage of total energy (%E) ranged from 18·8 % for 2–5-year-old girls in Israel to 31·4 % for 1–3-year-old girls in the Netherlands. Intake of added sugars (%E) ranged from 1·5 % in 6–11-month-old girls in the United States to 14·1 % in 1–3-year-old girls in the Netherlands. Intake of free sugars (%E) ranged from 9 % in 1-year-olds in Ireland to 17·4 % in 1–3-year-old girls in the Netherlands.
Children (4–12 years)
For children aged 4–12 years, sugar intake data are available for 25 countries: Australia, Austria, Belgium, Brazil, Canada, Chile, China, Denmark, Estonia, Finland, France, Germany, Iceland, India, Ireland, Israel, Italy, Mexico, the Netherlands, New Zealand, Norway, Portugal, Spain, the UK and the United States (Table 4). These include intakes of total sugars (eighteen countries), added sugars (eleven countries), free sugars (six countries), sucrose (four countries) and intrinsic sugars (Spain only).
Total sugar intake (%E) ranged from 8 % in 4–13-year-olds in China to 28·6 % in 4–8-year-old girls in the Netherlands. Intakes of added sugars (%E) ranged from 3 % in 4–13-year-old children in China to 17·0 % in 4–8-year-old girls in the Netherlands. Intakes of free sugars (%E) ranged from 9·1 % in 3-month-old-to-10-year-old boys in Portugal to 19·5 % for 4–8-year-old girls in the Netherlands.
Adolescents (13–18 years)
For older children (13–18 years), sugar intake data were available for 24 countries: Andorra, Australia, Austria, Belgium, Brazil, Canada, Chile, Denmark, Estonia, France, Germany, Iceland, India, Ireland, Israel, Italy, Mexico, the Netherlands, New Zealand, Portugal, Slovenia, Spain, the UK and the United States (Table 5). These include intakes of total sugars (sixteen countries), added sugars (twelve countries), free sugars (eight countries), sucrose (four countries) and intrinsic sugars (Spain only).
Total sugar intake (%E) ranged from 15·4 % in 10–18-year-old boys in Italy to 30 % in 15–16-year-old girls in Slovenia. Intakes of added sugars (%E) ranged from 9·1 % in 10–17-year-old girls in Portugal to 16·2 % in 9–18-year-old children in the United States. Intakes of free sugars (%E) ranged from 9·1 % in 10–17-year-old boys in Portugal to 17·9 % for 9–13-year-old boys in the Netherlands.
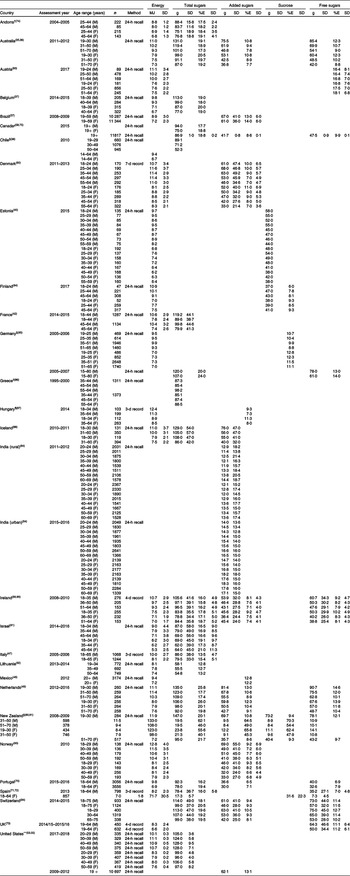
Adults (19–64 years)
For adults, sugar intake data are available for 29 countries: Andorra, Australia, Austria, Belgium, Brazil, Canada, Chile, Denmark, Estonia, Finland, France, Germany, Greece, Hungary, Iceland, India, Ireland, Israel, Italy, Lithuania, Mexico, the Netherlands, New Zealand, Norway, Portugal, Spain, Switzerland, the UK and the United States (Table 6). These include intakes of total sugars (eighteen countries), added sugars (fifteen countries), free sugars (eleven countries), sucrose (four countries) and intrinsic sugars (Spain only).
Total sugars intake (%E) ranged from 12·7 % in 35–49-year-old men and women in Lithuania to 26 % in 19–30-year-old women in the Netherlands. Intakes of added sugars (%E) ranged from 6·3 % in 50–59-year-old men in Norway to 14 % in 19–59-year-old women in Brazil. Intakes of free sugars (%E) ranged from 6·9 % in 18–64-year-old men in Portugal to 18·1 % in 51–64-year-old women in Austria.
Adults (>65 years)
For older adults, sugar intake data are available for 26 countries: Andorra, Australia, Austria, Brazil, Chile, Denmark, Estonia, Finland, France, Germany, Greece, Hungary, Iceland, India, Ireland, Israel, Italy, Lithuania, Mexico, the Netherlands, New Zealand, Norway, Portugal, Spain, the UK and the United States (Table 7). These include intakes of total sugars (fifteen countries), added sugars (eleven countries), free sugars (seven countries), sucrose (five countries) and intrinsic sugars (Spain only).
Total sugar intake (%E) ranged from 13·2 % in 65–75-year-old adults in Lithuania to 23·3 % in women ≥71 years old in New Zealand. Intakes of added sugars (%E) ranged from 4 % in men aged 65–84 years in Portugal to 12 % in women ≥60 years old in Brazil. Intakes of free sugars (%E) ranged from 4·4 % in 65–84-year-old men in Portugal to 12·5 % for men aged >75 years old in the UK.
Patterns of dietary sugars intake
Our analysis shows that intakes (expressed as %E) of both free and added sugars are highest in children and adolescents and are lowest for older adults.
Based on data as reported and one data point per age category per country, crude global estimates of mean intakes of free sugars (%E) were 12 % for 1–4-year-olds, 12 % for 4–12-year-olds, 14 % for 13–18-year-olds, 11 % for 19–64-year-olds and 8 % for >65-year-olds. For added sugars, crude global estimates of mean intakes were 8 % for 1–4-year-olds, 11 % for 4–12-year-olds, 13 % for 13–18-year-olds, 10 % for 19–64-year-olds and 8 % for >65-year-olds. These findings indicate that, where quantified, intakes of both added and free sugars are generally higher than recommended dietary guidelines at all life stages.
Such patterns of added sugars intake across the lifecycle are similar to previous findings, with the highest intakes in school-aged children and adolescents and the lower intakes observed in young children and adults (particularly older adults)(Reference Newens and Walton15,Reference Azaïs-Braesco, Sluik and Maillot97) . Findings from individual countries such as Australia, Canada, the UK and Ireland have shown some reduction in intakes of added/free sugars in children and adolescents over the last ∼15–20 years(35,Reference Roberts, Steer and Maplethorpe73,Reference Langlois, Garriguet and Gonzalez75,98) . For example, free sugar intake in Ireland has decreased from 16%TE (2003–2004) to 9%TE (2017–2018)(98). These studies have suggested that this reduction is largely due to reformulation, particularly in the sweetened beverage categories which are commonly consumed by children and adolescents. It is difficult to draw stronger conclusions beyond this due to differing terminology and methodologies used between countries and over time.
In brief, two observations are apparent from this analysis of published dietary sugars intake data globally. The first is the high intake of added/free sugars compared with recommendations at all life stages but particularly in school-aged children and adolescents. The second outcome is that more data (both in terms of quantity and harmonisation) are required to give a complete picture of sugars intake globally. Caution is needed when interpreting these dietary intake data across sugar types and making inter-country comparisons, due to differences in the dietary assessment methodologies, differences in the time periods in which dietary intake was assessed and differences in national clustering of age groups. Future studies could examine the feasibility of identifying and compensating for selected under-reporting (which may be worse for sugar-sweetened foods and beverages) by using biomarkers in a subset of the population.
Interpretation and application of dietary sugar data
Challenges of data availability and quality
Whilst this review serves to update data on sugar intake from two previous reviews, for some countries there have been no updates since the time of the previous reviews, and hence these earlier data are included here also. New data are, however, available and included for countries such as Andorra, Australia, Chile, China, Estonia, Germany, Greece, India, Lithuania, Mexico, New Zealand, Portugal, Slovenia and Switzerland, and updated data are available for some age groups, including for Belgium, Canada, Denmark, Finland, France, Germany, Ireland, Israel, Netherlands, Norway, the UK and the United States.
Notwithstanding the addition of new data, the findings suggest that relatively few countries globally provide any kind of dietary data on sugar intake. The greatest amount of intake data was available for adults, but even then, data were only available for 29 countries; mostly in the European Union (EU) and greater European region, Australia and New Zealand, the United States and some of the Americas. Of note, there are 194 countries in the world today(Reference Hayes99) and 100 countries which have food-based dietary guidelines(26). Significant gaps remain in examining sugars intakes globally, mirroring gaps in dietary surveillance in general(Reference Micha, Coates and Leclercq100).
A notable difference between this 2020 review and previous reviews(Reference Newens and Walton15,Reference Azaïs-Braesco, Sluik and Maillot16) is the inclusion of available data for dietary free sugar intake. This is in part due to newly available methods and definitions to estimate free sugars in databases of food consumption(Reference Louie, Moshtaghian and Boylan101,Reference Swan, Powell and Knowles102) . These new data allow comparisons against nutrient goals for dietary sugars, which are typically based on free sugars intake. In particular, the inclusion of these data highlights the challenges of meeting dietary recommendations for free sugars, particularly at 5%E. For example, of the twenty-seven surveys that provided an estimate for free sugars, only one survey reported an estimate of mean intake below that value (Spain, where older male adults reported sugars intakes of 4·8%E). Understanding which food groups are the key contributors to free sugars at each lifecycle stage will help to inform strategies to reduce these intakes(Reference Amoutzopoulos, Page and Steer103).
Nevertheless, there remain considerable challenges in estimating dietary sugar intake data. Standard challenges exist relating to population sampling, selection bias and the assumptions and uncertainties inherent to the dietary collection methods used (24 h recall, food records and food frequency questionnaires)(Reference Newens and Walton15,Reference Micha, Coates and Leclercq100) . Further, for sugars, obtaining reliable estimates of added and free sugar consumption continues to be a challenge for researchers. Despite the development of protocols to estimate added/free sugar composition(Reference Louie, Moshtaghian and Boylan101,Reference Amoutzopoulos, Steer and Roberts104) , detailed food and composition data at brand level are necessary for these purposes(Reference Newens and Walton15,Reference Swan, Powell and Knowles102) . As part of EFSA’s ongoing assessment to provide scientific advice on an tolerable upper intake level for sugars, harmonised data on dietary sugars intake will be compared for countries in the European region; however, challenges remain for assuring valid comparisons in other global regions(14).
Application of dietary sugar data
For dietary intake researchers, data managers and risk assessors, the need to survey and accurately quantify dietary sugars intake remains a priority. However, it also remains problematic, given the lack of global harmonisation of definitions, classifications and recommendations and the lack of biomarkers to differentiate between the dietary intake of different sugars types. Future situations that could overcome this lack of harmony, but that could also offer objective biomarkers of intake and quantitative measures of the amounts of the various sugar forms present within foods, would be welcome. However, where available, these are currently only in their infancy and, indeed for biomarkers at least, may be a futile effort(Reference Davy and Jahren105–Reference Louie108).
For policy makers, current dietary sugar intake patterns are needed for consistent longitudinal monitoring and may enforce concerns and underline the importance of policy initiatives to reduce population sugar and energy (calorie) intakes. To date, there have been a variety of approaches undertaken by different countries, ranging from education strategies, taxation policies on single food types (e.g. taxes on sugar-sweetened beverages) to more comprehensive initiatives affecting multiple food types (e.g. UK initiatives targeting reformulation, portion size and altering consumer purchasing behaviour(Reference Capacci, Allais and Bonnet109), or indeed a mix of all three(110,111) ). Although there is some information to suggest that such efforts may reduce purchase and, in some cases, intake, any impact on outcomes other than absolute dietary intakes (e.g. health outcomes such as obesity risk) remain unknown, despite numerous modelling exercises(Reference Wright, Smith and Hellowell112–Reference Amies-Cull, Briggs and Scarborough117). A challenge remains in balancing the need to have regular robust population dietary assessments to underpin and evaluate policy with the costs and logistics that accompany such surveillance programmes(Reference Micha, Coates and Leclercq100).
Food compositional data for sugars are also used on food labels as applied by the food industry. The values on such labels can be used to underpin estimates of dietary sugars intake by researchers. For most countries, there is no mandatory labelling of added or free sugars, and only total sugars is required to be declared on the label, mainly due the current lack of a an accepted analytical method for manufacturers to assess added/free sugar content in foods/drinks. Exceptions include the United States, where added sugars (g, % daily value) will be included on the food label from 2021(118), and Mexico, who have recently (2020) also updated their labelling guidelines to include added sugars(119). Notwithstanding this, challenges remain: for example, in the United States, single-ingredient sugars such as syrups are treated differently with respect to labelling requirements and are not labelled as added sugars unless added as an ingredient in other foods. Given such disparities, continued challenges will remain when sourcing and applying food composition data to underpin estimates or modelling of dietary sugars intake, particularly for foods which are either new to market or have been recently reformulated for sugars. It is promising to see a recently proposed method to quantify free sugars in foods and beverages which, if workable, will be a valuable addition for assessment of free sugars and will be useful in product development and for public health bodies, industry and regulatory agencies(Reference Mela107).
A further challenge relates to consumer awareness and understanding of the meaning of the terms ‘added’ or ‘free’ sugars in the context of dietary guidance. As mentioned, globally, food labels mostly only provide the interested consumer with information on quantitative amounts of total sugars present. Recent studies have suggested confusion in recognising dietary sources of added or free sugars, with results reiterating the need to have a readily understood term for sugars relating to label information and to educate and inform consumers of such(Reference Tierney, Gallagher and Giotis120,Reference Tang, Lin and Yang121) . With disconnection between dietary guidance and food labelling regulations with respect to total/free/added sugars, it will be a challenge for consumers to understand the relevant sugar content of foods from the nutrition label.
Future directions and conclusion
With the role of dietary sugars under scrutiny, this review aimed to provide a current picture of dietary guidance and actual sugar intake worldwide. It shows that, globally, a minority of countries provide any estimate of sugar intake. Further, intakes of the sugar forms upon which the greatest emphasis is placed (free and added sugars) generally exceed existing dietary guidelines across all population groups and are highest in children and adolescents and lowest for older adults Whilst individual studies suggest some reductions in intakes of added sugars (%E) in children and adolescents, this review suggests that there is a need for more data to understand the complete picture. Furthermore, this review suggests a greater need for harmonisation of terms and for collaborative efforts to ensure that the most up-to-date food composition data are used to underpin any estimates of intake or modelling scenarios. Development and consensus on robust, valid biomarkers which provide accurate measures of dietary sugars intake, and preferably in a manner which is cost-effective, non-invasive and quick, would be welcome. In the interim, continued focus on monitoring of both dietary intakes and the efficacy of any public health initiatives remains paramount.
Acknowledgements
We wish to thank the authors of the dietary survey reports in different countries who assisted us with data related queries.
Financial support
This work was supported by the World Sugar Research Organisation (WSRO). WSRO had no role in the analysis or writing of this review.
J.W. received financial support from the WSRO for the initial draft of the manuscript. No funding was received for later drafts or for final manuscript. R.R. and H.B. are previous employees of WSRO and were employees at the time that the data were collected.
R.R. and J.W. conceived the idea of this review paper. H.B. collated the data. J.W. and A.N. interpreted the data and drafted the manuscript. All authors read and approved the final version of the manuscript.


 Open access