


Introduction
The role of meat in the diet has come under scrutiny in recent times with an increased public emphasis on providing healthy diets from sustainable food systems which includes limiting/reducing the consumption of animal products(Reference Willett, Rockström and Loken1). Furthermore, recent studies have linked red and processed meat consumption with an increased risk of certain cancers which has brought attention to the types and quantities of meat that are being consumed(2,Reference Bouvard, Loomis and Guyton3) . The World Cancer Research Fund (WCRF) recommends consuming less than 500 g of red meat per week and very little if any processed meat(4) and the UK Scientific Advisory Committee on Nutrition (SACN) recommends limiting red and processed meat consumption to no more than 70 g/d(2).
Meat is a valuable source of high-biological value protein and a range of micronutrients including riboflavin, niacin, vitamin B6, vitamin B12, Fe and Zn; however, processed meats can also contain high amounts of nutrients of public health concern such as saturated fat and Na(Reference Pereira and Vicente5). For many countries, meat is a key component of the food-based dietary guidelines (FBDG) and is often the central food around which meals are based; however, with health concerns related to red and processed meat consumption and trends towards a more plant-based diet, there is a need to understand the current role of meat in the diet including compliance with guidelines and the contribution of meat to nutrient intakes.
The present review aims to summarise dietary guidelines relating to meat, actual meat intakes and the contribution of meat to energy and nutrient intakes of children, teenagers and adults in Europe. Data are included from nationally representative dietary surveys published as reports, online web pages or peer-reviewed journal articles. For inclusion in the present review, the surveys must be published in English, must have been undertaken post-2000, and have used a food diary or 24 h recall as the dietary assessment method. The data for the present review were collected between January and June 2019; Table 1 outlines the ten European countries for which data within the above criteria were available including the years the studies were carried out, the age groups examined, the number of participants and the categories of meat reported within each study.
Table 1. European countries from which data were available for the present review, including study years, age groups examined, number of participants and categories of meat reported

Classification of meat
Meat is a nutrient-dense food eaten in a variety of different forms, often being the central food around which meals are based(Reference Bender6). It is defined as the flesh of animals used as food, but this definition is often widened to include organs such as liver, kidney, brains and other edible tissues(Reference Lawrie7). Meat can be broadly categorised into red and white meat, with red meat typically having a higher proportion of type I oxidative (red) muscle fibres than type IIb glycolytic (white) muscle fibres(Reference Listrat, Lebret and Louveau8). Both red and white meat are then further categorised as either processed or unprocessed. However, there is lack of consistency between public health bodies and individual studies on the definitions of red, white and processed meat. The WCRF defines red meat as beef, pork, lamb and goat from domesticated animals including that contained in processed foods(4). The International Agency for Research on Cancer (IARC) refers to red meat as unprocessed mammalian muscle meat (including minced or frozen meat), for example, beef, veal, pork, lamb, mutton, horse, or goat meat(Reference Bouvard, Loomis and Guyton3) and processed meat refers to meat that has been transformed through salting, curing, fermentation, smoking, or other processes to enhance flavour or improve preservation(Reference Bouvard, Loomis and Guyton3). The UK SACN defines processed meat as meat (usually red) that has been treated with preservatives, excluding salt, but including some cured meats(2). The European Prospective Investigation into Cancer and Nutrition (EPIC) has defined white meat as poultry (including chicken, hen, turkey, duck, goose, and unclassified poultry)(Reference Rohrmann, Overvad and Bueno-de-Mesquita9) and domestic rabbit, while other epidemological studies include fish in their definition of white meat(Reference Abid, Cross and Sinha10). Not withstanding the variations in definitions from public health bodies, variations between individual studies can make it difficult to compare intakes between countries; for example, the UK National Diet and Nutrition Survey (NDNS) reported intakes of total red meat including processed meat(11) while the Dutch National Food Consumption Survey 2012–2016(Reference van Rossum, Buurma-Rethans and Vennemann12) reported intakes of ‘domestic mammals’ (including beef, veal, pork, mutton/lamb, and horse) in line with the International Agency for Research on Cancer (IARC) definition of red meat as unprocessed mammalian muscle meat (including minced or frozen meat)(Reference Bouvard, Loomis and Guyton3) (Table 1). This highlights a need for standardised definitions of red and processed meat both from a public guidance perspective and to allow for uniform estimation of meat intakes and compliance with guidelines. Table 1 highlights the variations of subcategories reported within ‘total meat’ between studies which can make it difficult to compare intakes between countries.
Dietary guidelines for meat consumption
The FAO has compiled a comprehensive database of all FBDG worldwide(13). Countries in the WHO European Region which include meat as part of their FBDG are outlined in Table 2. While most FBDG recommend eating meat in some form, guidelines differ between countries in terms of types and quantities of meat in their recommendations. In Austria, for example, the recommendation is to ‘Eat up to 3 servings of lean meat or low-fat sausages per week (300–450 g)’(14), while in Latvia the recommended weekly amount of lean meat is 300–600 g(15). Recommended portion sizes also vary between countries, for example according to the Albanian guidelines one portion of meat equates to 100–120 g(16) while the Turkish guidelines state that 50–60 g equates to 1 serving(17). Furthermore, certain countries do not distinguish meat from other foods when providing quantitative recommendations on consumption limits, for example, Belgium, ‘Do not eat more than 75–100 g per day of meat, fish, eggs or products made with these foods’(18) and Greece, ‘Consumption of poultry, eggs and red meat should not exceed on the average 1 serving per day’ (1 serving of cooked lean meat = 60 g)(19).
Table 2. Meat consumption guidelines in Europe
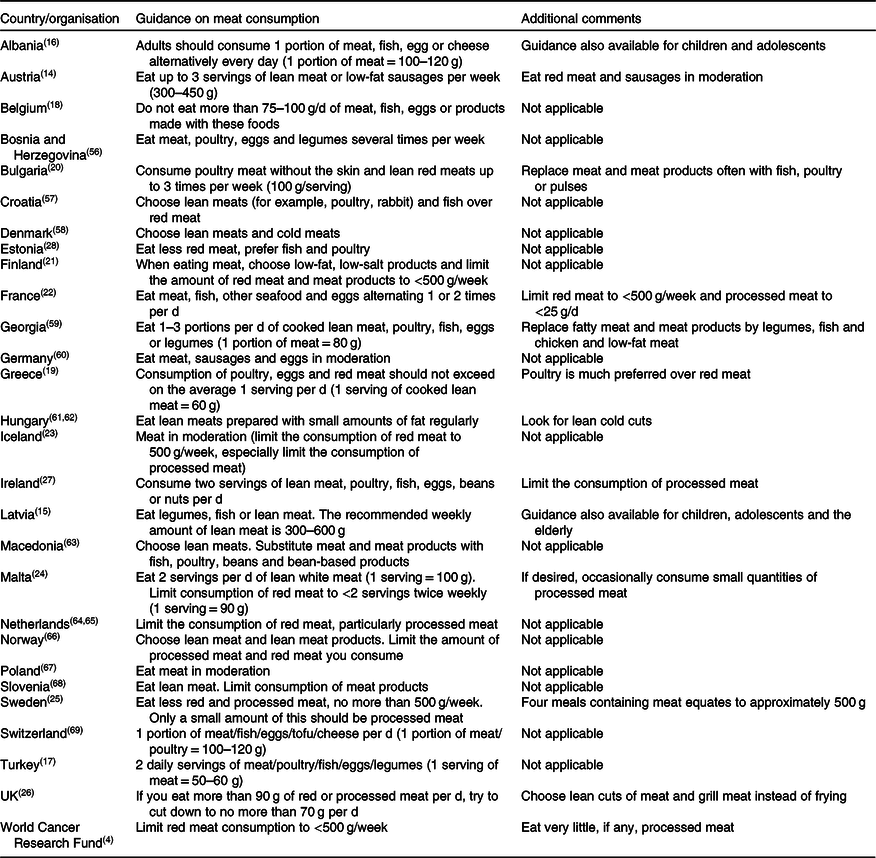
The WCRF recommends that adults limit consumption of red meat to less than 500 g/week to provide a balance between the advantages of eating red meat (as a source of essential macro- and micronutrients) and the disadvantages (an increased risk of colorectal cancer and other non-communicable diseases) and to consume very little, if any, processed meat(4). The following countries provided a quantitative consumption limit for red and/or processed meat: Bulgaria, ‘Consume poultry meat without the skin and lean red meats up to three times per week’ (100 g/serving)(20); Finland, ‘Limit the amount of red meat and meat products to <500 g per week’(21); France, ‘Limit red meat consumption to no more than 500 g per week and processed meat consumption to 25 g per day’(22); Iceland, ‘Limit the consumption of red meat to <500 g per week’(23); Malta, ‘Limit consumption of red meat to <2 servings twice weekly’ (1 serving = 90 g)(24); Sweden, ‘Eat less red and processed meat, no more than 500 g per week, only a small amount of this should be processed meat’(25); and the UK, ‘If you eat more than 90 g of red or processed meat per day, try to cut down to no more than 70 g per day’(26). Furthermore, a number of countries provide non-quantitative recommendations limiting red and processed meat consumption, such as the Irish guidelines which state to limit processed meats’(27), the Austrian guidelines recommend to ‘Eat red meat and sausages in moderation’(14) and the Estonian guidelines which state ‘Eat less red meat, prefer fish and poultry’(28). Despite variations in dietary guidance for meat consumption across European countries, overall, most countries recommend limiting red meat and to consume little, if any, red and processed meat.
Meat consumption in Europe
Comparison of studies
Data from nationally representative nutrition surveys in ten European countries are presented in the present review. For comparison of meat intakes, data were available from the Czech Republic(Reference Ruprich, Dofkova and Jakubikova29), Denmark(Reference Pedersen, Christensen and Matthiessen30), Finland(Reference Helldán, Raulio and Kosola31), Germany(Reference Heuer, Krems and Moon32), Ireland(33–36), Italy(Reference Pounis, Bonanni and Ruggiero37,Reference Leclercq, Arcella and Piccinelli38) , Lithuania(Reference Barzda, Bartkeviciute and Baltusyte39,Reference Barzda, Bartkevičiūtė and Baltušytė40) , the Netherlands(Reference van Rossum, Buurma-Rethans and Vennemann12,Reference van Rossum, Fransen and Verkaik-Kloosterman41,Reference Ocke, Buurma-Rethans and de Boer42) , Sweden(Reference Amcoff, Edberg and Enghardt Barbieri43) and the UK(11) while data on the contribution of meat to energy and nutrient intake were available from Denmark(Reference Pedersen, Christensen and Matthiessen30), Finland(Reference Helldán, Raulio and Kosola31), Ireland(33–36), the Netherlands(Reference van Rossum, Fransen and Verkaik-Kloosterman41) and the UK(11).
Due to the previously mentioned lack of internationally accepted standard definitions for red, white and processed meat there are variations in definitions between studies which report intakes of these meat categories. Additionally, as meat is often consumed as part of a composite dish, total weight of the dish is typically reported; hence, intakes of meat can be overestimated. It has previously been reported that failing to disaggregate the meat component of composite dishes may overestimate meat intakes by >40 %(Reference Cosgrove, Flynn and Kiely44). The German, Italian, Dutch, Irish and UK national food consumption surveys have disaggregated meat from composite dishes; however, compliance with upper limitations of meat intake may be underestimated in other countries.
Meat intakes in adults
In European countries for which data have been reported on meat consumption, 95–99 % of adults were identified as meat consumers. The mean intake (g/d) of total meat in European adults is reported in Table 3. Mean intakes of total meat ranged from 75 g/d in Swedish adults(Reference Amcoff, Edberg and Enghardt Barbieri43) to 211 g/d in Finnish adults(Reference Helldán, Raulio and Kosola31). Where data have been reported by population subgroups such as age group or sex, mean intakes of total meat in Italy, Sweden, Finland, Denmark, the Netherlands, Germany, Ireland and the UK were higher in younger adults aged 18–69 years (range 93–233 g/d) compared with older adults aged over 65 years (range 75–191 g/d)(11,Reference van Rossum, Buurma-Rethans and Vennemann12,Reference Pedersen, Christensen and Matthiessen30–Reference Heuer, Krems and Moon32,35,Reference Pounis, Bonanni and Ruggiero37,Reference van Rossum, Fransen and Verkaik-Kloosterman41–Reference Amcoff, Edberg and Enghardt Barbieri43) . Mean intakes of total meat across Europe were higher in men (84–218 g/d) compared with women (64–163 g/d).
Table 3. Mean intake (g/d) of total meat in European adults by age group and sex

Intakes of poultry have been reported in the Netherlands, Sweden, Finland, Denmark and Ireland while the UK has reported the intake of ‘total white meat’(11,Reference van Rossum, Buurma-Rethans and Vennemann12,Reference Pedersen, Christensen and Matthiessen30,Reference Helldán, Raulio and Kosola31,35,Reference van Rossum, Fransen and Verkaik-Kloosterman41,Reference Amcoff, Edberg and Enghardt Barbieri43) . Mean intakes of poultry ranged from 11 to 46 g/d, with the highest intakes observed in Irish adults (55 g/d among males aged 18–64 years, 39 g/d among females aged 18–64 years and 32 g/d among older adults ≥65 years)(35) and intakes in the Netherlands and Sweden ranged from 15 to 23 g/d for younger adults and from 11 to 16 g/d for older adults(Reference van Rossum, Buurma-Rethans and Vennemann12,Reference van Rossum, Fransen and Verkaik-Kloosterman41) .
Consumption of offal across all European countries was relatively low compared with consumption of other meat groups. Offal intakes have been reported in Italy, Lithuania, the Czech Republic, Finland, the Netherlands and Ireland. Mean intakes of offal among adults in Italy, Lithuania, the Netherlands and Ireland were 0–2 g/d(Reference van Rossum, Buurma-Rethans and Vennemann12,35,Reference Leclercq, Arcella and Piccinelli38–Reference van Rossum, Fransen and Verkaik-Kloosterman41) while intakes in the Czech Republic and Finland were higher (4 and 3 g/d, respectively)(Reference Ruprich, Dofkova and Jakubikova29,Reference Helldán, Raulio and Kosola31) .
Intakes of red and processed meat in adults have been reported in the Netherlands(Reference van Rossum, Buurma-Rethans and Vennemann12), Ireland(Reference Cocking, Kehoe and McNulty45) and the UK(11). Mean intakes of red and processed meat in younger adults were 93 g/d in the Netherlands, 86 g/d in Ireland and 71 g/d in the UK which is above the UK SACN recommendation of <70 g/d, with adults in the Netherlands and Ireland also exceeding the WCRF recommendation of <500 g per week. For older adults, the mean intakes of red and processed meat were 77 g/d in the Netherlands, 85 g/d in Ireland and 63 g/d in the UK, with older adults in the UK only having meat intakes below the upper daily consumption limits recommended by the WCRF and the UK SACN. It is important, however, to continue to monitor meat intakes, particularly in light of changing food consumption patterns. Recent time-trend analysis from the NDNS over a 9-year period (2008/2009 to 2016/2017) has reported a downward trend in intake of red and processed meat in adults and older adults with little change in the intake of total meat, indicating a change in the types of meats consumed(Reference Bates, Collins and Cox46).
The contribution of meat to energy and nutrient intakes in adults has been reported in Denmark(Reference Pedersen, Christensen and Matthiessen30), Finland(Reference Helldán, Raulio and Kosola31), Ireland(35,Reference Cocking, Kehoe and McNulty45) , the Netherlands(Reference van Rossum, Fransen and Verkaik-Kloosterman41) and the UK(11) (Table 4). Overall, meat contributed 12–17 % of energy intake in adults across Europe. Meat also contributed to large proportions of key nutrients such as protein (29–41 %), MUFA (23–28 %), PUFA (11–21 %), B vitamins (4–38 %), vitamin D (5–30 %), Fe (16–23 %), K (13–19 %) and Zn (27–36 %); however, it also contributed to high proportions of total fat (19–24 %), saturated fat (19–24 %) and Na (15–28 %).
Table 4. Contribution (%) of total meat to energy and nutrient intakes in European adults

While some national nutrition surveys in Europe have collected biochemical data to explore the nutritional status of population groups, there are few studies which examine the impact of meat consumption on nutritional status. A recent study from the UK NDNS has shown that among females aged 11–64 years those who consumed less than 40 g/d of total red meat were more likely to have micronutrient intakes below the lower reference nutrient intake (LRNI) for vitamin D, vitamin B12, Zn, Fe and K; however, there were no significant differences observed for blood biomarkers(Reference Derbyshire47).
Meat intakes in children and teenagers
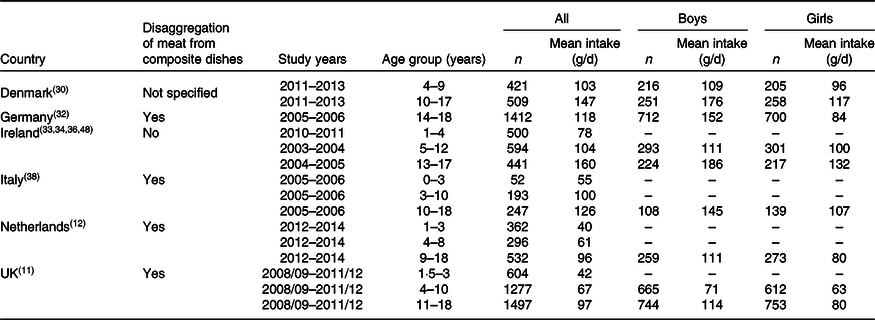
The mean intake (g/d) of total meat in European children and teenagers is reported in Table 5. Mean intakes of total meat in Irish children and teenagers (1–4, 5–12 and 13–17 years)(33,34,36) and Danish children and teenagers (4–9 and 10–17 years)(Reference Pedersen, Christensen and Matthiessen30) were higher than those observed in children and teenagers in Germany(Reference Heuer, Krems and Moon32), Italy(Reference Leclercq, Arcella and Piccinelli38), the Netherlands(Reference van Rossum, Buurma-Rethans and Vennemann12,Reference van Rossum, Fransen and Verkaik-Kloosterman41) and the UK(11), which may be partly explained by the inclusion of meat from composite dishes in estimates of intakes. Mean intakes of total meat in young children aged 0–3 years in the Netherlands, the UK and Italy ranged from 40 to 55 g/d(11,Reference van Rossum, Buurma-Rethans and Vennemann12,Reference Leclercq, Arcella and Piccinelli38) and mean intakes in Irish children aged 1–4 years were 78 g/d(36,Reference Cocking48) . Mean intakes of total meat in older children aged 3–12 years were 61 and 67 g/d in the Netherlands(Reference van Rossum, Buurma-Rethans and Vennemann12,Reference van Rossum, Fransen and Verkaik-Kloosterman41) and the UK(11) and ranged from 100 to 104 g/d in Italy(Reference Leclercq, Arcella and Piccinelli38), Denmark(Reference Pedersen, Christensen and Matthiessen30) and Ireland(33,36,Reference Cocking48) . Mean intakes of total meat in older children/teenagers aged 9–18 years ranged from 96 to 97 g/d in the Netherlands(Reference van Rossum, Buurma-Rethans and Vennemann12,Reference van Rossum, Fransen and Verkaik-Kloosterman41) and the UK(11) and from 118 to 160 g/d in Germany(Reference Heuer, Krems and Moon32), Italy(Reference Leclercq, Arcella and Piccinelli38), Denmark(Reference Pedersen, Christensen and Matthiessen30) and Ireland(33,34) . Where data have been reported by age group and sex, mean intakes of total meat in European children and teenagers were higher in boys (71–186 g/d) compared with girls (63–132 g/d) across all age groups examined.
Table 5. Mean intake (g/d) of total meat in European children and teenagers by age group and sex
Intakes of poultry and poultry dishes have been reported in the Netherlands(Reference van Rossum, Buurma-Rethans and Vennemann12,Reference van Rossum, Fransen and Verkaik-Kloosterman41) , Denmark(Reference Pedersen, Christensen and Matthiessen30), Italy(Reference Leclercq, Arcella and Piccinelli38) and Ireland(33,34,36) , while the UK(11) has reported the intake of ‘total white meat’. Mean intakes of poultry ranged from 5 to 15 g/d in younger children aged 0–4 years, from 7 to 24 g/d in older children aged 3–12 years and from 14 to 44 g/d in older children/teenagers aged 9–18 years.
Mean intakes of offal in children and teenagers have been reported for children and teenagers in Italy(Reference Leclercq, Arcella and Piccinelli38), the Netherlands(Reference van Rossum, Buurma-Rethans and Vennemann12,Reference van Rossum, Fransen and Verkaik-Kloosterman41) and Ireland only(33,34,36) . Mean intakes of offal were 0 g/d among all children and teenagers in the Netherlands and Ireland while intakes among Italian children were <1 g/d across all age groups.
Intakes of red and processed meat in children and teenagers have been reported in the Netherlands(Reference van Rossum, Buurma-Rethans and Vennemann12,Reference van Rossum, Fransen and Verkaik-Kloosterman41) , Ireland(Reference Cocking48) and the UK(11). Mean intakes of red and processed meat in the Netherlands, Ireland and the UK ranged from 30 to 41 g/d in younger children (0–4 years) and from 45 to 54 g/d in older children (4–12 years). Mean intakes of red and processed meat in older children/teenagers (9–18 years) were 60 g/d in the UK, 68 g/d in the Netherlands and 76 g/d in Ireland. There are currently no recommendations on red and processed meat intake in children and teenagers. While older children/teenagers and boys have higher intakes compared with younger children and girls, it is important to continue to monitor intakes as there is evidence from the recent NDNS time-trend analysis that intakes of red and processed meat are declining among children/teenagers aged 11–18 years(Reference Bates, Collins and Cox46).
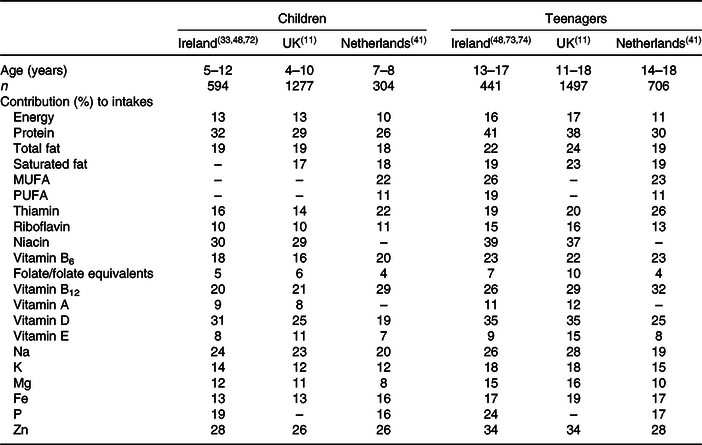
The contribution of meat to energy and nutrient intakes in children and teenagers has been reported in Denmark(Reference Pedersen, Christensen and Matthiessen30), Finland(Reference Helldán, Raulio and Kosola31), Ireland(33,34,36) , the Netherlands(Reference van Rossum, Fransen and Verkaik-Kloosterman41) and the UK(11) (Table 6). Overall, meat contributed 10–17 % of energy intake in children and teenagers across Europe. Meat also contributed to large proportions of key nutrients such as protein (26–41 %), MUFA (22–26 %), PUFA (11–19 %), B vitamins (4–39 %), vitamin D (19–35 %), Fe (13–19 %), K (12–18 %) and Zn (26–34 %); however, it also contributed to high proportions of total fat (19–24 %), saturated fat (17–23 %) and Na (19–28 %). To the best of the authors’ knowledge there are no data available exploring the association of meat consumption with nutritional status markers among children and teenagers in Europe.
Table 6. Contribution (%) of total meat to energy and nutrient intakes in European children and teenagers
Current research and future perspectives
Research is ongoing to explore the potential to improve the nutritional composition of meat for both macro- and micronutrients. Enhancing the fatty acid composition of meat to improve the unsaturated fat:saturated fat ratio is one area which has been investigated extensively. A recent review has shown that on a g/g fat basis, grass-fed beef has a more favourable profile for saturated fat, conjugated linoleic acid and n-3 fatty acid composition than grain-fed beef(Reference Daley, Abbott and Doyle49). Moreover, the review found that grass-fed beef tends to be lower in overall fat content and is also higher in precursors for vitamins A and E. Another recent review has highlighted the potential of fish oil or microalgae in the diets of single-stomached animals such as pigs and chickens to enhance n-3 content of the animal meat(Reference Scollan, Price and Morgan50). Additionally, despite the extensive lipolysis and biohydrogenation of dietary lipids in the microbiome of ruminants, some studies have also achieved high levels of long-chain n-3 in lamb(Reference Hopkins, Clayton and Lamb51,Reference Meale, Chaves and He52) . The lack of human intervention trials to assess the nutritional value of these compositional changes has been emphasised. While meat is already a key source of many micronutrients in the diet, there is also ongoing research aimed at investigating meat as a vehicle for other micronutrients that are not naturally present in high quantities. The biofortification of red meat with vitamin D is one such area of research. It has been shown that providing the maximum allowable level of 2000 IU vitamin D (in the form of either 25(OH)D3 (D3) and/or 25-hydroxvitamin D) per kg diet in pigs can increase the total vitamin D activity of pork loin meat to 0·9 to 1·7 μg per 100 g(Reference Cashman, Duffy and Hayes53). Furthermore, vitamin D3 supplementation of heifers’ diets within allowable European Union inclusion levels (4000 IU of vitamin D3 per kg of feed) can successfully enhance the vitamin D content of beef to such an extent that a 7–9 % contribution per 100 g of beef could be made to an individual’s recommended daily intake of vitamin D(Reference Duffy, O’ Doherty and Rajauria54). The Se and iodine content of meat can also be improved by fortification of animal feeds, whereas Zn and Fe contents are highly variable among different species and cannot be improved by increased feed concentrations(Reference De Smet and Vossen55). Any changes in the nutritional profile of meat and meat products should be reflected in food composition tables to allow for ongoing and accurate estimations of the contribution of meat to nutrient intakes.
Conclusion
With the role of meat consumption under scrutiny for both health and environmental reasons, the present review aimed to provide a current picture on country-specific dietary guidelines and actual consumption of meat within Europe. The review found that FBDG for most countries recommend consuming lean meat in moderation and many recommend limiting red and processed meat consumption.
In Europe, the mean intake of total meat ranged from 40 to 104 g/d in children, from 96 to 160 g/d in teenagers and from 75 to 233 g/d in adults. While meat was shown to be a key contributor to important nutrients such as protein, PUFA, B vitamins, vitamin D and essential minerals such as Fe and Zn, it can also contribute to significant proportions of nutrients of public health concern such as saturated fat and Na across population groups, primarily due to processed meats.
While there were few data available on intakes of red and processed meat (with varying defintions), mean intakes in adults are slightly higher than the upper limits recommended by the UK SACN (70 g/d)(2) and the WCRF (500 g/week)(4). While there are no recommendations for red and processed meat consumption in children and teenagers, intakes currently range from 30 to 76 g/d. However, it is important to continue to monitor meat intakes among all popualtion groups given recent evidence from the UK indicating a decrease in red and processed meat consumption among population groups(Reference Bates, Collins and Cox46). A standardised definition of red and processed meat in relation to health is needed for a uniform estimation of meat intakes and compliance with guidelines.
Research is ongoing to show the potential effects of improving the nutritional profile of meat through reformulation and biofortification. It is important that these changes to the food supply are reflected in food composition databases to allow for accurate estimates of the contribution of meat to the diet. The present review provides a comprehensive overview of the role of meat in the European diet which may be of use to stakeholders including researchers, policy makers and the agri-food sector. In light of the global shift towards providing healthy diets from sustainable food systems it is important to continue to monitor the consumption of meat and its role in the diet of population groups.
Acknowledgements
The authors acknowledge the contribution of Meat Technology Ireland (MTI), a co-funded industry/Enterprise Ireland Technology Centre funded through the Technology Centre programme (TC 2016 002).
C. C. collated the data. C. C., J. W. and L. K. wrote the first draft of the manuscript. All authors contributed to the plan of research, subsequent drafts of the manuscript, and approval of the final version submitted for publication.
There are no conflicts of interest.


