


Introduction
The extent of a species’ range is directly related to its population size, and species distribution data are of primary importance for conservation and management (Mace, Reference Mace, Edwards, May and Webb1994; IUCN, 2001). Comprehensive survey data can indicate the best approach to species management, facilitate assessment of management efficacy at regional and country scales and inform appropriate interventions at local scales. Conservation planning, i.e. identifying and prioritizing conservation areas, is often based on predicted species distributions because survey data are incomplete or not available (Wilson et al., Reference Wilson, Westphal, Possingham and Elith2005). The uncertainty inherent in predicted data makes such an approach less than ideal for species-specific management, especially when intervention is required, as in human–wildlife conflict mitigation.
The Asian elephant Elephas maximus is categorized as Endangered on the IUCN Red List (Choudhury et al., Reference Choudhury, Lahiri Choudhury, Desai, Duckworth, Easa and Johnsingh2008) and is currently limited to 13 South and South-east Asian range states (Fernando & Pastorini, Reference Fernando and Pastorini2011). Asian elephants have a sexually dimorphic social structure, with adult females and young forming closely bonded groups, and dispersal of pubertal males (Fernando & Lande, Reference Fernando and Lande2000). Adult males are mostly solitary and are more likely to use crops, adopting a high risk–high gain strategy (Sukumar & Gadgil, Reference Sukumar and Gadgil1988). Most incidents of human–elephant conflict involve adult males (Fernando, Reference Fernando2011).
The Asian elephant is unique as an Endangered species in coming into widespread and intense conflict with people, requiring active management for its conservation and for conflict mitigation. In Sri Lanka alone c. 70 people and 250 elephants lose their lives annually as a result of human–elephant conflict (Fernando et al., Reference Fernando, Jayewardene, Prasad, Hendavitharana and Pastorini2011). Most elephant management activities are directed towards conflict mitigation, often at the cost of elephant conservation (Fowler & Mikota, Reference Fowler and Mikota2008; Fernando & Pastorini, Reference Fernando and Pastorini2011). Across Asian elephant range, elephant management has been based on confining elephants to protected areas (Fernando & Pastorini, Reference Fernando and Pastorini2011). Human–elephant conflict occurs entirely outside protected areas and has continued to escalate over the past few decades, necessitating a rethink of management approaches (Fernando et al., Reference Fernando, Wikramanayake, Weerakoon, Janaka, Gunawardena, Jayasinghe, McNeely, McCarthy, Smith, Olsvig-Whittaker and Wikramanayake2006; Fernando & Pastorini, Reference Fernando and Pastorini2011).
Asian elephants are forest animals, which makes their detection challenging. In Sri Lanka they mostly occupy low-visibility habitat such as scrub and secondary forest during the day, venturing into the open only at night. Most Asian elephants come into conflict with people, and therefore they actively avoid people and/or respond aggressively to close approach (Fernando et al., Reference Fernando, Wikramanayake, Janaka, Jayasinghe, Gunawardena and Kotagama2008). Asian elephant densities vary from < 0.1 elephants/km2 in rain forests to c. 4 elephants/km2 in grassland–savannah habitats (Sukumar, Reference Sukumar1989), thus the Asian elephant is essentially a low-density species. Elephants also have home ranges of hundreds of km2 and can travel long distances, sometimes seasonally (Baskaran & Desai, Reference Baskaran and Desai1996; Fernando et al., Reference Fernando, Wikramanayake, Janaka, Jayasinghe, Gunawardena and Kotagama2008; Alfred et al., Reference Alfred, Ahmad, Payne, Williams, Ambu, How and Goossens2012), adding further complexity to detection. Although methods based on direct sighting of elephants and elephant signs such as droppings, footprints and evidence of feeding can be used to establish elephant presence (Hedges, Reference Hedges2012), their implementation at countrywide scales is difficult (but see Jathanna et al., Reference Jathanna, Karanth, Kumar, Karanth and Goswami2015).
Rural communities in Asia are largely dependent on agriculture. Where elephants are present in agricultural neighbourhoods they almost invariably use crops, provoking strong negative emotions among residents. Although elephants generate universal interest, most South Asian populaces have close cultural and religious ties to elephants and identify closely with them (Sukumar, Reference Sukumar2011; Gogoi, Reference Gogoi2018). This counterbalances negative attitudes towards elephant conservation (Bandara & Tisdell, Reference Bandara and Tisdell2004) and makes elephants and their whereabouts a matter of keen interest to local communities. Thus, communities tend to be aware of the presence or absence of elephants in their neighbourhood. Questionnaire surveys have been used to ascertain the distribution of a wide variety of species, including mountain lions Puma concolor (Berg et al., Reference Berg, McDonald and Strickland1983), chimpanzees Pan troglodytes (Sugiyama & Soumah, Reference Sugiyama and Soumah1988), Sika deer Cervus nippon (Kaji et al., Reference Kaji, Miyaki, Saitoh, Ono and Kaneko2000), adders Vipera berus (Reading et al., Reference Reading, Buckland, McGowan, Jayasinghe, Gorzula and Balharry1996), squirrels Sciurus spp. (Teangana et al., Reference Teangana, Reilly, Montgomery and Rochford2000) and polecats Mustela putorius (Baghli & Verhagen, Reference Baghli and Verhagen2003). Because of the way Asian elephants behave and interact with communities, a questionnaire-based approach should be suitable to determine their current distribution and how this has changed over time.
A number of studies have surveyed Asian elephant distribution in particular areas. Hedges et al. (Reference Hedges, Tyson, Sitompul, Kinnaird, Gunaryadi and Aslan2005) conducted a survey of elephant presence in Lampung Province (33,307 km2), Sumatra, based on questionnaire surveys and recce transects in areas where elephants were reported to be present. They also assessed elephant density in Bukit Barisan Selatan and Way Kambas national parks based on 286 km of line transects in an area of 4,803 km2 (Hedges et al., Reference Hedges, Tyson, Sitompul, Kinnaird, Gunaryadi and Aslan2005). Jathanna et al. (Reference Jathanna, Karanth, Kumar, Karanth and Goswami2015) studied elephant presence in the Western Ghats of Karnataka, India, over an area of 38,540 km2, based on trail surveys of elephant habitat in 205 grid cells. The survey effort was proportional to the extent of suitable elephant habitat in each 188 km2 cell, with up to 40 km for a cell with 100% elephant habitat (Jathanna et al., Reference Jathanna, Karanth, Kumar, Karanth and Goswami2015). Madhusudan et al. (Reference Madhusudan, Sharma, Raghunath, Baskaran, Bipin and Gubbi2015) assessed elephant distribution in Karnataka, India, based on data for a 16-year period from multiple sources: dung counts on line transects, records of human–elephant conflict, media reports, opportunistic sightings, and sign and interview surveys. They overlaid the information on maps of 2,855 forest beats (smallest Forest Department administrative unit) with a median area of 31.53 km2 (range 0.6–1,802 km2) to produce a distribution map (Madhusudan et al., Reference Madhusudan, Sharma, Raghunath, Baskaran, Bipin and Gubbi2015). Here we present the results of a grid-based questionnaire survey of Asian elephant distribution in Sri Lanka.
Methods
Interview survey
We overlaid a map of Sri Lanka with 5 × 5 km raster, creating 2,742 grid cells. A cell size of 25 km2 was chosen in preference to the 4 km2 recommended by IUCN (2001), based on a minimum home range size of 41 km2 for Sri Lankan elephants (Fernando et al., Reference Fernando, Wikramanayake, Janaka, Jayasinghe, Gunawardena and Kotagama2008) and logistical considerations. We surveyed by administering a questionnaire to residents in each cell. Interview locations within a cell were selected such that they were not clustered together. Survey locations and routes were identified from 1 : 50,000 topography maps from the Sri Lanka Survey Department.
From a pilot survey of 478 grid cells, with three respondents per cell, we found complete congruence of within cell responses in areas within and outside elephant range, but found variance at the boundaries. We then administered 10 questionnaires per cell in a sample survey of 25 cells with variable responses and scrutinized habitat and land use in presence/absence locations within a cell. We found that intra-cell variance was attributable to actual intra-cell spatial variation in elephant presence, and not type I or type II errors.
For the island-wide survey, based on logistical considerations, we chose to administer the questionnaire to three residents within each grid cell. In selecting respondents we visited each cell and chose individuals who had been resident for > 5 years in that location, excluding those visiting or newly settled. Before administering the questionnaire we engaged the respondents in discussion and made a subjective assessment of their knowledge of the surroundings, and whether they were truthful. If in doubt, the questionnaire was not administered and another respondent was selected. In areas where there were no elephants we interviewed older people (≥ 60 years) who had been resident in the cell their entire lives. A subjective assessment of each respondent was made in relation to reliability and knowledge of past events in the area, prior to recording the data. Interviews were conducted by MKCRDS and LKAJ during 2011–2015. The questionnaire was administered verbally and responses recorded on a standard data sheet. The geographical coordinates of each interview location were recorded using a global positioning system (GPS).
As interview surveys require detection, recall and reporting, it is possible that errors may occur, despite the safeguards taken. We therefore conducted an a posteriori test, using known-truth data (Chambert et al., Reference Chambert, Miller and Nichols2015) from GPS tracking of 54 elephants during 2004–2018, to estimate false negatives in our questionnaire survey. We overlaid a total of 164,568 GPS locations from 28,469 tracking days on the survey results, and identified grid cells where elephant presence was not recorded in the survey but was indicated by the tracking data.
Data analyses
The data were analysed in Excel (Microsoft, Redmond, USA), and the maps were produced in QGIS (QGIS Development Team, 2016). We defined elephant presence as the year-round or seasonal presence of resident or non-resident adult males or herds within a grid cell. Cells in which elephants were reported to occur irregularly (once every few years) were considered not to have elephants present. A cell with 1–3 positive answers for elephant presence was categorized as ‘elephants present’, assuming that heterogeneity of responses reflected spatial heterogeneity within our mapping unit of 25 km2. Similarly, we used a hierarchy of elephant occupation states: herds > males, resident > passing through, and present all year > present seasonally (dry or wet season only). From the three responses for each query within a cell we selected the higher state observed to represent the cell. For example, if one person stated that males passed through in the dry season, another stated that herds were resident in the dry season, and another that herds were resident all year, we categorized the cell as ‘herds resident all year’. For cells without current elephant presence we took the most recent year stated for past presence to represent that cell. To assess the pattern of range loss, we grouped responses into 5-year categories for 2000–2015 and 10-year categories for 1960–2000.
A cell without people resident was assigned a state based on the four cells sharing a common boundary with it (first-order neighbourhood), following the same hierarchy of states as before. Cells assigned a state in this manner were subsequently considered to be the same as cells categorized based on survey data.
To summarize human–elephant conflict for each grid cell we assigned the following values to the responses to the question ‘How much of a problem are elephants?’: none = 0, minor = 1, moderate = 2, major = 3. We then calculated the mean value for each cell.
Results
Grid cells surveyed
Interviews were conducted in 2,214 grid cells, covering 80.7% (55,350 km2) of Sri Lanka. In nine cells (0.4% of total surveyed) only a single resident was interviewed, and in 34 cells (1.5%) only two were interviewed. In 2,171 cells (98.1%) we interviewed three residents. Five hundred cells (18.2% of Sri Lanka; 12,500 km2) had no residents and consisted mostly of protected areas. No data were obtained from 28 cells (1.0% of Sri Lanka) because of logistics (promontories, water bodies) or error.
Elephant presence
Of the 2,214 grid cells surveyed, 1,128 (50.9%) had elephants (Fig. 1a). Of the 500 cells without residents, 497 were deemed to have elephants, based on first-order neighbourhood assignment. Thus, elephants were present in a total of 1,625 cells, of which 1,379 had both herds and males, and 245 had only males (Table 1; in one cell, herd presence was not specified). The herd range was 17.8% smaller than the male range. Cells with elephants present were contiguous, with the exception of two cell clusters in the south-west and a single cell in the south of the country, all of which indicated the presence of males only. Both south-western clusters included cells without people, corresponding to Forest Reserves.
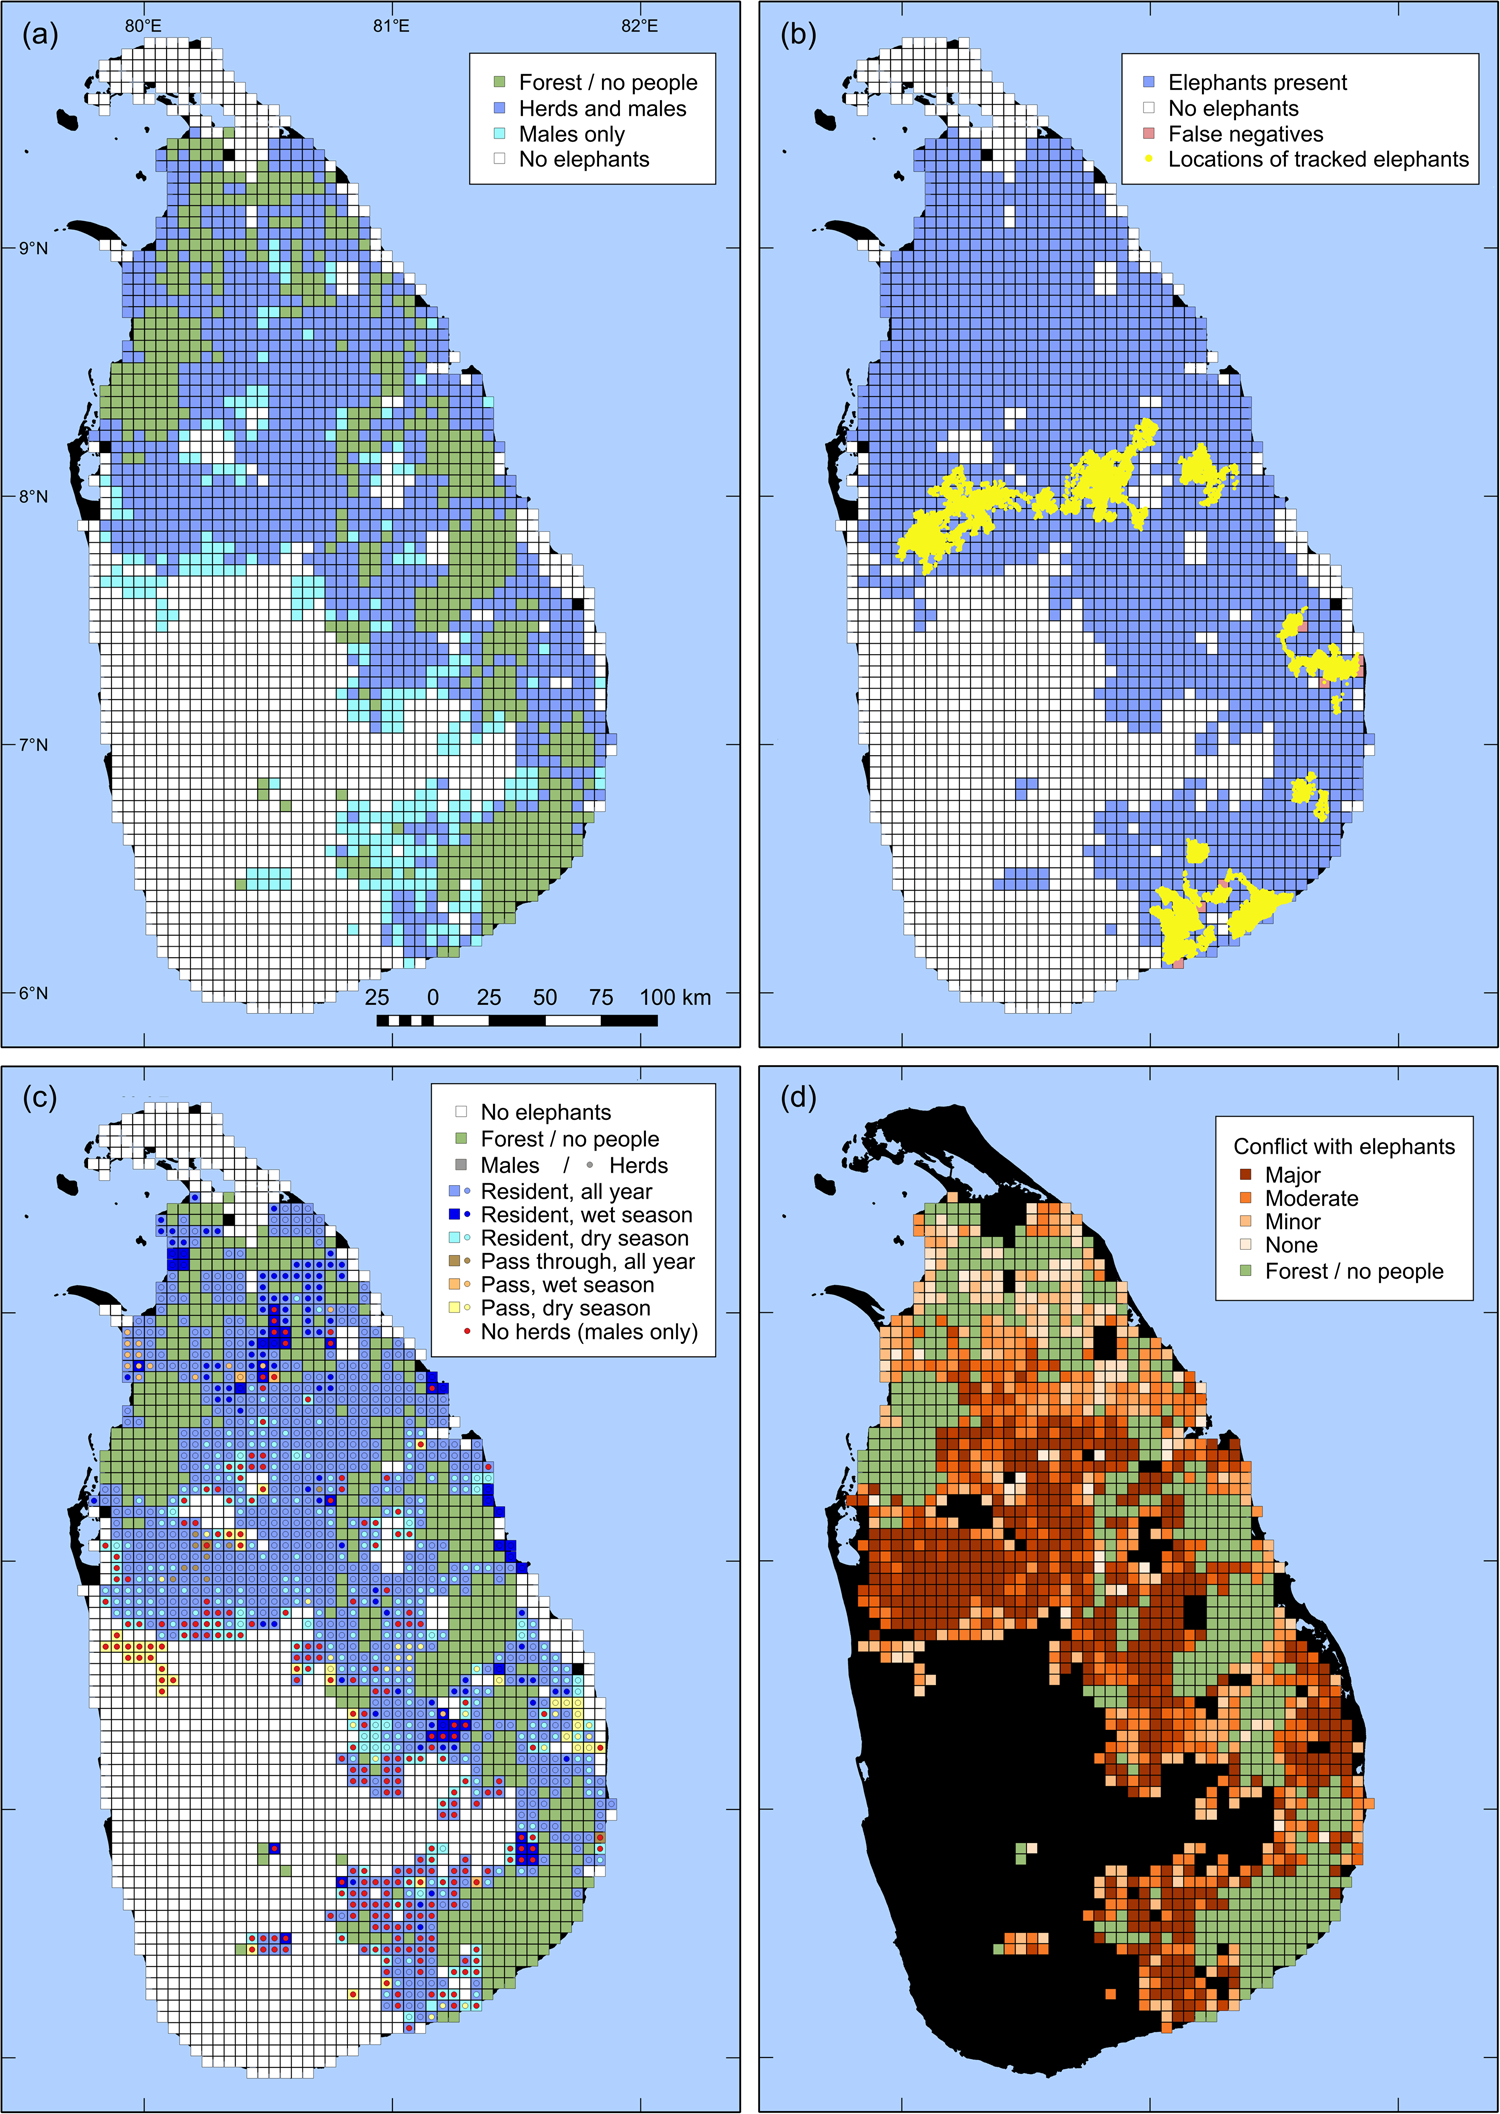
Fig. 1 Results of a countrywide survey of Asian elephant Elephas maximus distribution in Sri Lanka over 2,714 5 × 5 km grid cells. (a) Elephant presence, by herds and males; cells without resident people are coloured green. (b) Elephant presence and absence overlaid with the GPS locations of 54 elephants tracked during 2004–2018. (c) Spatio-temporal patterns of cell use by elephant herds and males (Fig. 2). (d) Severity of human–elephant conflict.
Table 1 Details of the presence of male Asian elephants Elephas maximus and elephant herds in the 1,625 grid cells with elephants, from a countrywide survey of elephant distribution in Sri Lanka (2,742 grid cells).

A posteriori test for false negatives
The 164,568 GPS locations covered a total of 264 grid cells, of which 257 (97.3%) were identified as ‘elephants present’ in the survey (Fig. 1b). Elephant presence and elephant habitat occurred in only a fragment of each of the seven cells for which telemetry data indicated elephant presence but the interview survey did not.
Spatio-temporal patterns
All grid cells with herds resident year-round also had resident males throughout the year. Males and herds were resident year-round in 88.6 and 60.9%, respectively, of elephant range. In 8.7 and 20.3% of elephant range, males and herds, respectively, were resident only seasonally. Dry-season range was larger than wet-season range, with 69.7% of seasonal range of males and 66.1% of that of herds consisting of dry season only range. Males and herds passed through but were not resident in 2.6 and 3.7%, respectively, of elephant range (Figs 1c, 2; Table 1).

Fig. 2 Usage, as per cent of 2,714 5 × 5 km grid cells, by male elephants and elephant herds, from a countrywide survey of elephant distribution (Fig. 1c).
Changes in elephant distribution
In 1960 elephants were present in 71.3% of Sri Lanka (Fig. 3). Herd range in 1960 was 19.0% smaller than that of males. Males lost more of their range (16.1%) than herds (12.1%) during 1960–2015, with the majority of the decline occurring after 2005 (Fig. 4). In 41 grid cells (1.5% of Sri Lanka) elephants were previously absent but are currently present.

Fig. 3 Distribution of elephant herds and male elephants in Sri Lanka in (a) 1960 and (b) 2015.
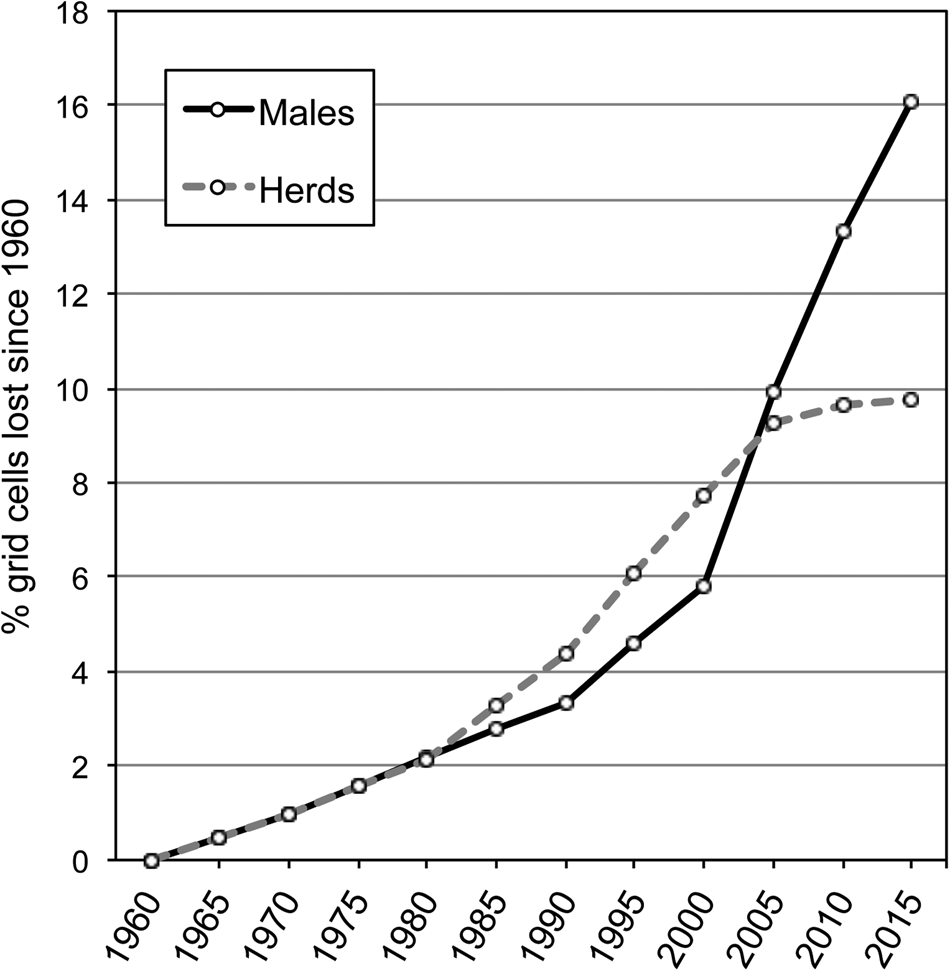
Fig. 4 Per cent of 2,742 5 × 5 km grid cells across Sri Lanka that lost male elephants and elephant herds between 1960 and 2015.
Human–elephant conflict
Of the 3,136 people with elephants in their neighbourhood, 55.7% said they had major problems with elephants. Another 23.1% said they had moderate problems and 14.2% had minor problems with elephants. A total of 219 people (7.0%) said they had no problems with elephants. In 17 grid cells (1.5%) with both people and elephants present, all respondents said they had no problems with elephants. In all other cells there was some degree of conflict (Fig. 1d), with a mean score of 2.14 ± SD 0.88 (n = 1,127).
Discussion
Elephant distribution
The countrywide distribution map of Asian elephants presented here is the first evidence-based map for a range state. We found elephants had an area of occupancy (AOO) of 59.9% of Sri Lanka. Based on our a posteriori test for false negatives, the detection probability was 97.3%. Thus we may have underestimated elephant distribution by 2.7%, which amounts to 1.6% of the country. As grid cells with partial elephant presence were categorized as having elephants, our study could also have some bias towards overestimating elephant presence. However, such bias would only occur at the perimeter of elephant distribution, and given the relative scale of the survey and the grid size, we suggest that our estimate is robust and approximates the true distribution.
Previous estimates of elephant distribution in Sri Lanka based on expert opinion have suggested an AOO of c. 24.9% (Olivier, Reference Olivier1978; percentage assessed by us from published map), c. 47.8% (Hoffman, Reference Hoffmann1978; percentage assessed by us from published map), > 12% (Sukumar, Reference Sukumar1989), 9.3% (Santiapillai & Jackson, Reference Santiapillai and Jackson1990), 42.4% (Leimgruber et al., Reference Leimgruber, Gagnon, Wemmer, Kelly, Songer and Selig2003) and 36% (de Silva & de Silva, Reference de Silva and de Silva2007). As none of these studies provided a definition of elephant presence, direct comparison may not be appropriate. However, compared to our findings, estimates of elephant distribution in Sri Lanka based on expert opinion have consistently been underestimates.
The ratio between the number of elephants and the area of Sri Lanka is thought to be almost 10 times that for any other range state (Fernando et al., Reference Fernando, Jayewardene, Prasad, Hendavitharana and Pastorini2011). This disparity may be partly explained by the lower mean AOO of elephants for the other Asian elephant range states (14.4 ± SD 13% of country area; Leimgruber et al., Reference Leimgruber, Gagnon, Wemmer, Kelly, Songer and Selig2003). Compared to most range states, the greater extent of elephant range outside protected areas in Sri Lanka may be another contributory factor, as disturbed habitats support higher elephant densities (Fernando & Leimgruber, Reference Fernando, Leimgruber, McShea, Davies and Bhumpakphan2011; Pastorini et al., Reference Pastorini, Janaka, Nishantha, Prasad, Leimgruber and Fernando2013; Evans et al., Reference Evans, Asnera and Goossens2018; Ranjeewa et al., Reference Ranjeewa, Pastorini, Isler, Weerakoon, Kottage and Fernando2018).
African forest elephants in Gabon were found to avoid anthropogenic habitats (Barnes et al., Reference Barnes, Barnes, Alers and Blom1991). In contrast, we found people were resident in 69.4% of elephant range in Sri Lanka, and therefore the majority of elephants occupied landscapes that were largely human-dominated, disturbed and agricultural. Similarly, in Karnataka, India, 55% of Asian elephant habitat was outside designated protected areas (Madhusudan et al., Reference Madhusudan, Sharma, Raghunath, Baskaran, Bipin and Gubbi2015). Determining whether the observed patterns are species- or population-specific must await wider assessment of African and Asian elephant populations.
Habitats with an intermediate disturbance regime support higher densities of Asian elephants than undisturbed forests (Fernando & Leimgruber, Reference Fernando, Leimgruber, McShea, Davies and Bhumpakphan2011; Pastorini et al., Reference Pastorini, Janaka, Nishantha, Prasad, Leimgruber and Fernando2013; Ranjeewa et al., Reference Ranjeewa, Pastorini, Isler, Weerakoon, Kottage and Fernando2018; Evans et al., Reference Evans, Asnera and Goossens2018). In an analysis of Borneo elephant Elephas maximus borneensis ranging and habitat use, degraded and secondary forests were found to be of higher suitability for elephants than primary forests, but their value for elephant conservation is largely unappreciated (Evans et al., Reference Evans, Asnera and Goossens2018). The conditions assumed to be requisite for Asian elephant conservation, such as large, unfragmented, protected wildlands (Sukumar, Reference Sukumar1989; Santiapillai & Jackson, Reference Santiapillai and Jackson1990; Leimgruber et al., Reference Leimgruber, Gagnon, Wemmer, Kelly, Songer and Selig2003), are brought into question by these findings. Although undisturbed, unfragmented areas are important, degraded and human-dominated landscapes may be critical habitats for Asian elephants, and hence their incorporation in elephant conservation plans is of vital importance for the species’ survival.
We found adult males were resident year-round over most of their range (88.6%), whereas herds were resident year-round in only two thirds of their range (60.9%). Herds were present seasonally and were non-resident in a greater portion of their range than were males. Higher tolerance of human disturbance and of conflict by males (Fernando, Reference Fernando2011) probably explains the sexual dimorphism in spatio-temporal patterns of occurrence.
We found elephant habitat without resident people covered 18.4% of Sri Lanka. The current extent of protected areas in Sri Lanka is 23.2% (IndexMundi, 2017). Almost all grid cells without people and located within elephant range had elephants (based on first-order neighbourhood assignment), indicating elephant presence in all protected areas. The inconsistency between elephant habitat without people and protected area extent is largely because some protected area categories (e.g. sanctuaries and proposed reserves) permit human habitation. Additionally, some 25 km2 cells partially consisted of protected areas without people, but had people resident in the remainder, and hence interviews were conducted and the cells categorized as having human presence.
Population subdivision
Our survey indicated that areas of elephant habitat in Sri Lanka are almost entirely contiguous, and therefore Sri Lankan elephants are not geographically subdivided but a single population. Of the isolated clusters identified, the two in the south-west correspond to the Peak Wilderness and Sinharaja forest reserves, which are the only wet zone habitats still occupied by elephants (Fernando et al., Reference Fernando, Jayewardene, Prasad, Hendavitharana and Pastorini2011). Peak Wilderness currently harbours c. 15 elephants, and Sinharaja 2–3 adult males (Fernando et al., Reference Fernando, Jayewardene, Prasad, Hendavitharana and Pastorini2011). Although there are no electric fences or other barriers preventing elephant movement out of the two areas, these elephants are thought to be isolated from other elephant range by densely populated and developed areas. Our results suggest that the Sinharaja population was contiguous with the dry zone populations to the east c. 50 years ago, but we found no evidence of current connectivity. Conclusive evidence of current isolation or connectivity can be obtained only through radio-tracking.
The notion that elephant groups become isolated and non-viable as a result of development has given rise to the idea of so-called pocketed elephants in the dry zone of Sri Lanka, and their removal by translocation or capture has been suggested (Somasuntharam et al., Reference Somasuntharam, Spittel, Jayawardena, Somanader, Coombe and Norris1959; Olivier, Reference Olivier1978; Seidensticker, Reference Seidensticker1984; Santiapillai & Jackson, Reference Santiapillai and Jackson1990; Jayewardene, Reference Jayewardene1994; Lair, Reference Lair1997). Our survey results indicate that dry zone elephant range is continuous, and that such management may be inappropriate. Removing pocketed elephants has also been discussed elsewhere, including in India (Gubbi et al., Reference Gubbi, Swaminath, Poornesha, Bhat and Raghunath2014) and Sumatra (Fowler & Mikota, Reference Fowler and Mikota2008). Based on our findings in Sri Lanka we advocate assessing the population viability of alleged pocketed elephants based on data on elephant distribution, ranging patterns, demography and health status, prior to any intervention.
Sexual segregation
We found some areas harboured only males, and therefore herd range was less than that of adult males. Spatial segregation of the sexes has been observed in African elephants and has been attributed to closer association of herds with water sources and displacement of non-musth males by musth males (Stokke & Du Toit, Reference Stokke and Du Toit2002), differential forage selection between males and herds (Shannon et al., Reference Shannon, Page, Duffy and Slotow2006), and either exploitation of resources inaccessible to female herds by males or competitive exclusion of males by female herds (Evans & Harris, Reference Evans and Harris2012). We found that all areas with female herds also had adult males, thus ruling out displacement or competitive exclusion of males as possible explanations.
Male-only areas in our study occurred mostly at the perimeter of elephant distribution. The exclusively male areas were zones where highly developed and densely populated areas graded into agricultural, less heavily populated areas, characteristic of elephant range. A probable explanation of the observed pattern is that adult males tolerate higher human densities and development, and hence more conflict, than herds. Thus in a sense the sexual segregation observed could be considered differential forage selection and male exploitation of resources inaccessible to female herds. However, the driver of sexual segregation in Sri Lanka is anthropogenic rather than natural.
Seasonality of ranges
Circa one eighth of the range of males and one fourth of herd range was seasonal, with approximately two thirds of the seasonal range for both males and females consisting of dry season only range. Seasonal ranges of elephants in Africa have been associated with periodicity of primary productivity and availability of surface water (Young et al., Reference Young, Ferreira and Van Aarde2009). However, Sri Lankan elephants do not have spatially segregated seasonal ranges and do not migrate (Fernando et al., Reference Fernando, Wikramanayake, Janaka, Jayasinghe, Gunawardena and Kotagama2008). Seasonal agriculture facilitates temporal resource partitioning between people and elephants, with shifting cultivation being particularly beneficial to elephants (Pastorini et al., Reference Pastorini, Janaka, Nishantha, Prasad, Leimgruber and Fernando2013). Therefore, seasonally used areas observed in our survey may be seasonal agriculture areas within the home ranges of elephants.
Changes in elephant distribution
We found elephants extirpated from c. one sixth of the range they occupied c. 50 years ago. Although recall over time scales of decades may be subject to lack of constancy and precision, the trend indicated (Fig. 4) is plausible. Elephants occurred over almost the entire island during the 17th century, with reported presence in current urban locales, including Colombo, Ratnapura and Kandy, during or after the 1600s (McKay, Reference McKay1973). Therefore Sri Lankan elephants lost c. 30% of their range during the 350-year period prior to 1960, and another 15.2% since then, indicating an acceleration of range loss. Although not comparable to the substantial losses in regions such as Sumatra, where elephants have lost 69% of their range since the early 1990s (Gopala et al., Reference Gopala, Hadian, Sunarto, Sitompul, Williams and Leimgruber2011), the range decline in Sri Lanka has been persistent and is likely to continue.
Although elephant range expansion has been reported previously in Sri Lanka (Fernando et al., Reference Fernando, Jayewardene, Prasad, Hendavitharana and Pastorini2011), we found it to be negligible at a countrywide scale, accounting for only 2.5% of the current range. However, such changes may have a disproportionate impact on human–elephant conflict, bringing elephants into contact with communities unaccustomed to their presence.
There is a direct correlation between spatial distribution and abundance (Brown, Reference Brown1984; Mace, Reference Mace, Edwards, May and Webb1994; Venier & Fahrig, Reference Venier and Fahrig1996), especially in populations at carrying capacity. In the absence of a recent significant reduction of elephant numbers independent of habitat loss, we should assume the Sri Lankan population to be at carrying capacity. Therefore, the pattern of range loss observed indicates a long-standing and increasing rate of elephant population decline. There is a popular belief in Sri Lanka that the elephant population has increased since the 1950s (Hoffmann, Reference Hoffmann1978; Santiapillai et al., Reference Santiapillai, Wijeyamohan, Bandara, Athurupana, Dissanayake and Read2010; Department of Wildlife Conservation, 2013; Santiapillai, Reference Santiapillai2013), based on various guesstimates of elephant numbers over time, and surveys using inappropriate methodology (Fernando, Reference Fernando2008; Jathanna et al., Reference Jathanna, Karanth, Kumar, Karanth and Goswami2015). Such a scenario implies that increasing elephant numbers are the cause of an escalation in human–elephant conflict, and has been used to advocate for relaxation of conservation efforts and/or control of the elephant population to mitigate conflict (Santiapillai et al., Reference Santiapillai, Wijeyamohan, Bandara, Athurupana, Dissanayake and Read2010). Our survey results show the fallacy of this argument and underscore the danger of basing management decisions on assumptions.
The loss of elephant range was greater in areas occupied only by adult males compared to areas occupied by herds and males. Loss of male-only range represents local extinction, whereas loss of herd range may represent elimination of elephants or conversion to male-only range. We did not observe any direct conversion of herd range to non-elephant areas. Therefore, the progression of local extinction appears to be via conversion of herd range to male-only range. In Sri Lanka the cause of elephant range loss is development, in particular conversion of natural habitat to irrigated agriculture. As adult males tend to tolerate higher levels of conflict than herds (Fernando, Reference Fernando2011), they probably persist during the early phases of development but are eliminated as development continues.
Range loss appears to have been steady until c. 2005, when the decrease in herd range appears to have plateaued and that of male-only range to have increased. New irrigation development in Sri Lanka peaked in the mid 1980s and has continued since then, with greater outlay on rehabilitation and private investment (Kikuchi et al., Reference Kikuchi, Barker, Weligamage and Samad2002; Abayawardana et al., Reference Abayawardana, Marikar, Wijerathna and Gichuki2006). Local extinction may follow a lag period of a couple of decades after infrastructure development, related to settling and farming of developed land. The difference in trajectories of range loss between herds and males may reflect sexually dimorphic responses to changes in the pace and type of development and ensuing human–elephant conflict.
Human–elephant conflict
We found people were resident in almost 70% of elephant range, and there was conflict between elephants and people wherever they co-occurred. Consequently the map of human–elephant conflict approximately coincides with that of elephant presence outside protected areas (Figs 1a,d). Over much of the elephant's range a high level of human–elephant conflict was observed. There were some grid cells with lower levels of conflict in the northern areas (Fig. 1d), probably related to the lower human densities and the influence of 26 years of armed conflict, which ended in 2009. Current information from the north and east indicates escalation of human–elephant conflict to high levels since our survey.
Importance as a survey method
Conflict with people is the biggest threat to Asian elephants (Fernando & Pastorini, Reference Fernando and Pastorini2011). Questionnaire surveys provide information on elephants that share space with people, and hence the most threatened populations. Such surveys sample a temporal and spatial scale commensurate with respondents’ experiences. Compared to methods requiring elephant or sign detection, questionnaire surveys sample a greater temporal and spatial scale and are less labour intensive, logistically simpler and applicable to large landscapes.
False positives are unlikely in detection surveys but are possible with questionnaire surveys if the respondent is untruthful or is unable to relate accurately to the area in question. Therefore it is important to make a subjective assessment of the respondent in administering questionnaires. We expect limiting queries to the immediate neighbourhood of residents, as we did, would prevent confusion about the area.
Although false negatives are a problem with detection surveys, they are less likely in questionnaire surveys, given the spatial and temporal scales sampled, as indicated by the test for false negatives in our survey. As conflict between people and elephants mostly involves adult male elephants, the observed coincidence of human–elephant co-occurrence and human–elephant conflict suggests a high detection probability of males via questionnaire surveys. Where elephants are limited to areas without resident people, questionnaire surveys may fail to detect elephant presence. Such an instance occurred in our survey, where the presence of herds in the Peak Wilderness area was not detected and neighbourhood assignment categorized it as a male-only area. This was not a problem for the current survey as it accounted for only 0.1% of the survey area. However, it may be of concern in large landscapes with low human densities, necessitating fewer interviews and/or larger minimum mapping units. Ideally questionnaire surveys should be combined with ground surveys for elephants and elephant signs, particularly in areas without resident people.
We were able to survey the entire land area of Sri Lanka, but countrywide surveys may be logistically challenging in larger countries. Sri Lanka is an exception among range countries in having a high Asian elephant AOO, and therefore covering the entire country was deemed to be important in terms of both current and past elephant distribution. Although logistically challenging, it is not impossible to conduct countrywide surveys in larger countries where accessibility is high. However, surveys could also be limited to areas of known or possible elephant presence. Starting from an area of known elephant presence, surveys could be conducted until two grid cells without elephant presence are detected, so that a 10 km wide boundary without elephants is established around a landscape with elephants. In countries where knowledge of elephant presence is poor and human densities and accessibility may be low, a larger grid size, such as 10 × 10 km, could be used for an initial survey, followed by finer-grained surveys in areas with elephants.
Management implications
Elephants and people co-occurred in c. 70% of current elephant range in Sri Lanka and human–elephant conflict occurred in almost all areas of overlap. Since the 1950s the main approach to human–elephant conflict mitigation and elephant management in Sri Lanka has been the segregation of people and elephants at a landscape level, by confining elephants to protected areas (Somasuntharam et al., Reference Somasuntharam, Spittel, Jayawardena, Somanader, Coombe and Norris1959; Fernando, Reference Fernando2015). Our survey results highlight the failure of this approach. Attempts to restrict elephants to protected areas, by elephant drives, leads to carrying capacity being exceeded, and decimation of elephant populations, and hence is detrimental to elephant conservation (Fernando, Reference Fernando2016). It also causes escalation of conflict in drive areas as a result of increased aggressiveness of elephants subject to drives but not removed (Fernando, Reference Fernando2015). Given that the majority of elephants in Sri Lanka share land with people, continued attempts to limit elephants to protected areas will lead to escalation of human–elephant conflict in the near term and, ultimately, loss of elephants. Therefore, the only option is to manage elephants in situ. We recommend a human–elephant coexistence model that promotes stakeholder awareness and mitigates conflict by protecting villages and cultivations with barriers such as electric fences. This approach has been incorporated into the National Policy for Elephant Conservation and Management in Sri Lanka but is yet to be fully implemented. The distribution map we have prepared serves as a template for identifying areas where conflict mitigation needs to be integrated into development plans, thus facilitating human-elephant co-existence and the prevention and reduction of human–elephant conflict. Under such management elephants will continue to range outside protected areas, ensuring their survival.
Acknowledgements
We are grateful to Anoma Edirisooriya for data entry. The Abraham Foundation and Elephant Family provided financial support for this study.
Author contributions
Data collection: HKJ, MKCRDS, LKAJ; data analysis: JP; writing: PF, JP.
Conflicts of interest
None.
Ethical standards
This research complied with the Oryx Code of Conduct.


 Open access