Introduction
Prior to May 2019, Northern Mozambique had never witnessed a storm as powerful and potentially damaging as Cyclone Kenneth. Just six weeks after Cyclone Idai (March 2019) devastated the country’s mid-section, sparking a cholera outbreak that resulted in over 6,600 cases and a successful mass-vaccination campaign that reached 900,000 people, Cyclone Kenneth threatened an unprecedented repeat in the Cabo Delgado area. According to the World Health Organization (WHO; Geneva, Switzerland) May 10 situation report, 254,750 people were affected and more than 45,000 houses were destroyed. 1 By May 9, a total of 18,000 people were displaced in accommodation centers. Water, sanitation, and health care were all badly damaged in a region of prior cholera incidence, and hundreds of cholera cases were subsequently recorded in and around the city of Pemba. Over 200 cases of cholera were confirmed by June 10, 2 prompting a vaccination campaign, and over 252,000 doses of the single-dose cholera vaccine were administered over several weeks.Reference Bhalla 3 The scale, speed, and geographic scope of the impact of the two natural disasters in Mozambique are examples of how pre-existing endemic diseases like cholera can escalate into large-scale outbreaks, resulting in a humanitarian health crisis. These unfortunate events raise important questions about the state of public health preparedness and opportunities to strengthen future responses to mitigate the morbidity and mortality due to cholera and other epidemic-prone infections.
In the wake of disasters, including those with natural shocks such as cyclones, disruption to infrastructure can create conditions, such as population displacement and overcrowding, that increase the risk of outbreaks of cholera and other infectious diseases, particularly those that are endemic in non-disaster settings.Reference Watson, Gayer and Connolly 4 When sources of clean drinking water are contaminated or inaccessible, for example due to flooding, cholera can rapidly spread through shared drinking vessels or in the environment. Although an oral vaccine stockpile exists, vaccines must be deployed quickly in order to effectively contain the spread of disease, and by definition the number of vaccines delivered will be much smaller than the total population at-risk. Treatment with oral rehydration salts and the staffing of cholera treatment centers are also required for outbreak response and bring their own resource allocation challenges. Since roads and other infrastructure critical to treatment and vaccine deployment are also likely to be impacted by flooding or other natural disasters, the logistical constraints are often a major barrier to the success of response and containment efforts. Given these challenges, careful consideration of how to deploy treatment and who receives the vaccine becomes critical.
In this context, epidemic forecasts that would allow policy makers and aid agencies to target the highest risk populations leading up to an outbreak, and to prioritize particular locations for the deployment of the vaccine, would be a valuable decision-making tool. Infectious disease forecasting is extremely challenging, and the level of uncertainty associated with the inherently stochastic processes that determines when and where outbreaks happen and how they spread can be overwhelming, particularly in areas where data quality is low and reporting is unreliable. However, recent advances in statistical and mechanistic model frameworks, and the advent of new data streams on basic population-level parameters from mobile devices and social media, offer promise of forecasts that can at least provide some information about where to expect cholera to emerge and spread.Reference Wesolowski, Buckee, Engø-Monsen and Metcalf 5 – Reference Hay, George, Moyes and Brownstein 7
Apart from methodological and data-availability issues involved in building disease transmission models, the heart of the matter for health response remains tightly linked to multi-actor coordination and data logistics, including the capacity to translate research protocols and findings between academics and emergency responders. Emergency responders are aware of context-specific, post-disaster conditions that can shape how health operations are planned to mitigate an outbreak of disease. For example, the commencement of vaccination campaigns in Mozambique occurred during the Holy Month of Ramadan, requiring a close integration of community engagement and social mobilization campaigns to ensure successful vaccination rates. In 2009, Malcolm MacLachlan proposed a transdisciplinary model of “integrative expertise” with the aim to integrate a wider diversity of disciplines to address global health challenges. The approach and vision aim to recognize and build a body of expertise between disciplines and practices that value context, research processes, and the interplay of knowledge domains.Reference MacLachlan 8 Over the past decade, transdisciplinary research has played an increasing role in the National Institutes of Health (NIH; Bethesda, Maryland USA) research activities,Reference Rimer and Abrams 9 and the West African Ebola epidemic prompted discussions of how academics and humanitarians can best work together in emergencies.Reference Levine 10 However, there is a need to better understand transdisciplinary disaster global health research that is translational in purpose with the aim to impact near real-time health response activities.
Report
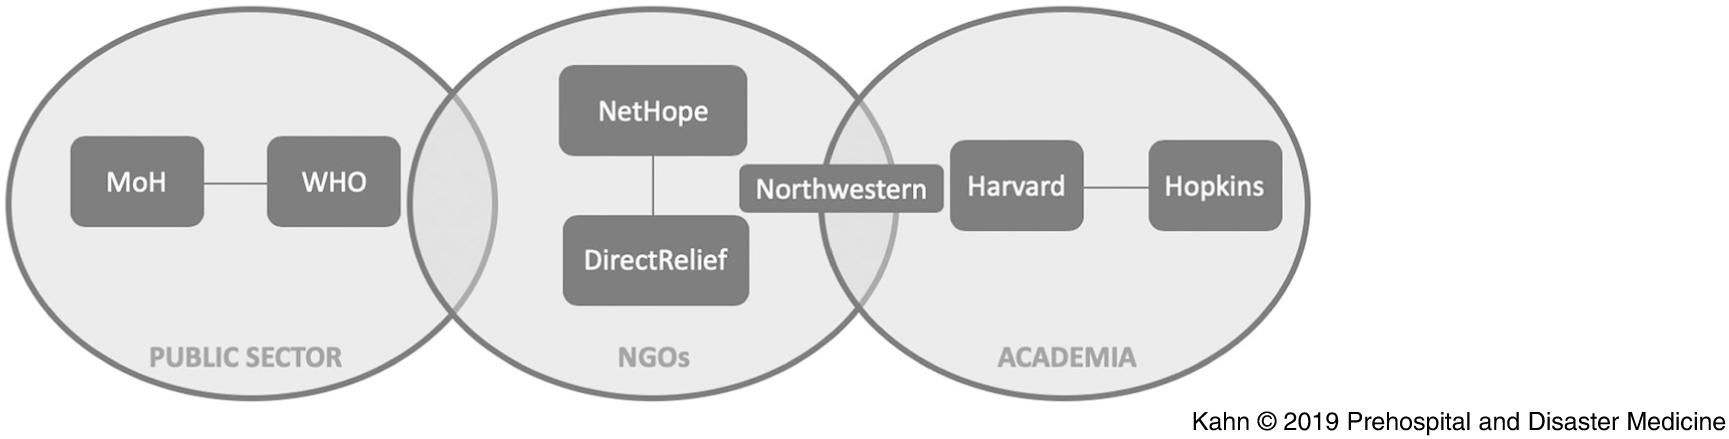
Here, an approach to cholera forecasting in near real-time that reflects the work of a team of academic researchers, humanitarian responders, and health agencies directly responding in Mozambique before and during Cyclone Kenneth (Figure 1) is described. Simple analytic methods were used for speed and clarity, and a web-based tool was created for identifying the highest risk populations prior to the cyclone, as well as a tool for forecasting once cholera emerged. The risk maps were produced and shared in near real-time with humanitarian responders in Mozambique, including the Instituto Nacional De Saúde (INS; National Institute of Health) and Ministério da Saúde (MiSAU; Ministry of Health) staff and the Expanded Programme on Immunization (EPI) teams at the Centers for Disease Control and Prevention (CDC; Atlanta, Georgia USA) and WHO. Through constant communication, the analytical results produced were matched to the needs of policy makers. These simple models accurately predicted key locations of emergent infection in Pemba and Mecufi.

Figure 1. Organizational Structure Reflecting the Team of Academic Researchers, Humanitarian Responders, and Health Agencies.
Nevertheless, significant challenges remained for connecting model outputs with real-time, tactical decision making given persistent barriers to uptake of new research during a rapid, on-going, multi-stakeholder response. It is unclear the extent to which decisions on the ground were influenced by these risk maps, but this approach represents an important case study in how real-time forecasting could work on a more routine basis. In particular, the rapid formation of flexible teams that include diverse academic disciplines and individuals with operational experience and humanitarian data expertise that are in close proximity to implementation of interventions will be critical to the use of forecasts in public health emergencies moving forward. Some of the bottlenecks and constraints for scaling this approach in the future are discussed. In particular, even when the supply of real-time information is provided, without technical capacity to understand forecasts, and interest in using them to make decisions, these efforts will fail to have impact.
Methods
A simple analytic approach was used, combining information on the extent of flooding from the cyclones, previous cholera outbreaks, and population sizes to forecast the spread of cholera from the two districts, Beira and Pemba, that were most affected by Cyclone Idai and Cyclone Kenneth, respectively. For each district in Mozambique, the risk of a cholera outbreak was modeled based on four metrics. First, for each district, publicly available projected and actual disaster-specific flood data were obtained from Copernicus (European Commission; Brussels, Belgium). 11,12 Annual cholera incidence from previous yearsReference Lessler, Moore and Luquero 13 and the sensitivity of previous outbreaks to the El Niño-Southern Oscillation cycleReference Moore, Azman and Zaitchik 14 were used as a measure of the districts’ vulnerability to cholera outbreaks independent of the impact of the cyclones. Finally, a diffusion (gravity) model was used to simulate movement of infected travelers from Beira or Pemba, using Facebook Data for Good (Facebook Inc.; Palo Alto, California USA) high-resolution population data. 15 The gravity model,Reference Xia, Bjørnstad and Grenfell 16 which is commonly used in epidemiological models in the absence of detailed mobility data, assumes that travel from Pemba or Beira occurs based on their population size, the population size of the receiving district, and the geodesic distance between the source and the receiving district according to the formula:
 $${{\sqrt {population_{source}} \times \sqrt {population_{destination}} } \over {distance}}$$
(1)
$${{\sqrt {population_{source}} \times \sqrt {population_{destination}} } \over {distance}}$$
(1)
Each metric was scaled between zero and one to obtain four independent risk indices where “zero” indicates the lowest risk and “one” indicates the highest risk. The average of the four risk indices was then used to calculate the final risk index for each cyclone. Additionally, in the case of Cyclone Kenneth, to respond to the outbreak in real-time as information about cases became available, the diffusion model risk index was calculated as the weighted average of the simulated travel from all places that reported cases in the previous week, with the weights determined by the proportion of cases for each reporting district. A web-based tool was produced for conveying the model results, identifying highest risk populations prior to the cyclone and the districts at highest risk following the start of the outbreak. 17 The web-based tool was developed using the Shiny platform in RStudio Version 1.1.423 (RStudio Inc.; Boston, Massachusetts, USA), and the results were initially communicated through blog posts by Direct Relief (Santa Barbara, California USA) and shared through the publicly available information portal ReliefWeb, a digital service of the UN Office for the Coordination of Humanitarian Affairs (OCHA; New York USA/Geneva, Switzerland). Reference Schroeder18,Reference Schroeder19 All code and data for replicating the results are publicly available on GitHub (GitHub Inc.; San Francisco, California USA). 20
Results
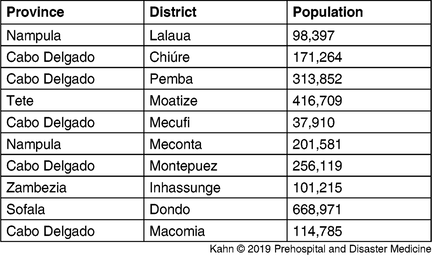
The model based on Cyclone Kenneth’s projected path, previous incidence, and El Niño risk (Figure 2 and Table 1) accurately predicted the places at highest risk of cholera. Pemba and Mecufi districts, where cholera cases were reported, had the third and fifth highest risk scores, respectively. The updated risk predictions based on the gravity model and reported flood data, following the initial reports of cholera cases in Pemba, are shown in Figure 3.
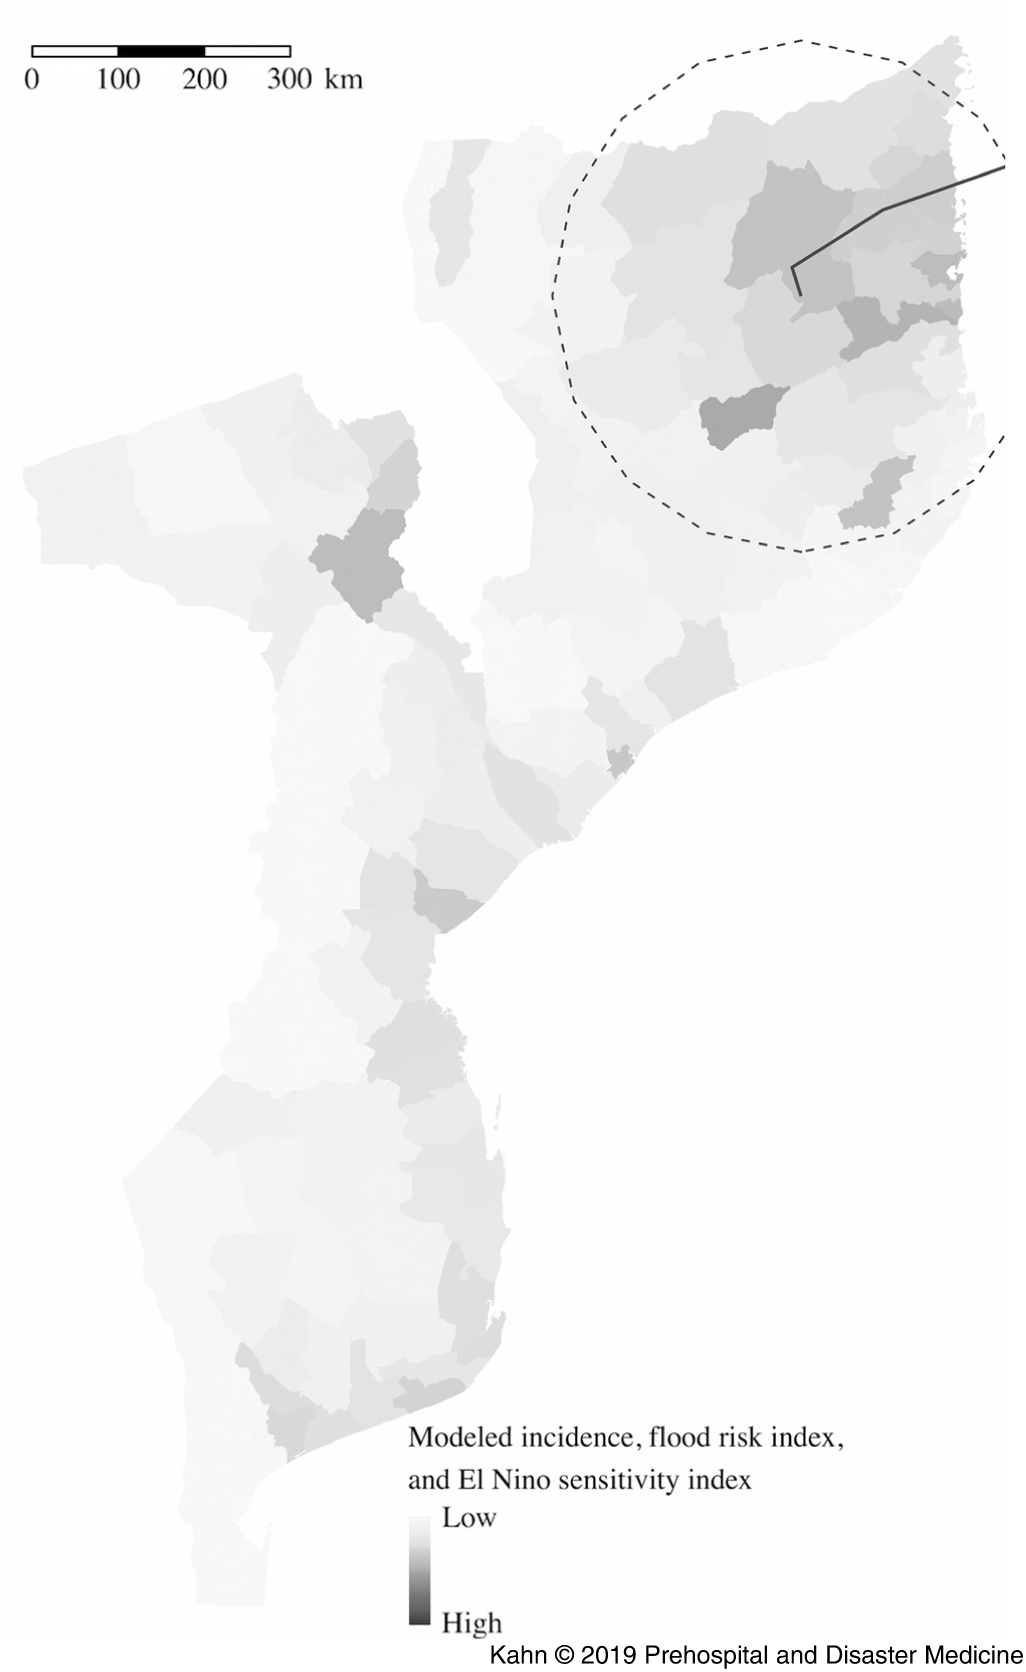
Figure 2. Districts at Highest Risk from Projected Path of Cyclone Kenneth (Black Line) Using the Metrics of Previous Incidence, Projected Flood, and El Niño Sensitivity.
Table 1. Districts at Highest Risk from Projected Path of Cyclone Kenneth Using the Metrics of Previous Incidence, Projected Flood, and El Niño Sensitivity


Figure 3. Districts at Highest Risk after Cyclone Kenneth Made Landfall Using the Metrics of the Reported Flood Data and the Gravity Model.
Discussion
Using simple modeling methods, areas at high-risk for cholera following Cyclone Kenneth were successfully identified. The modeling itself and creation of the risk scores were quick and easily adaptable when additional relevant data sources became available. Despite this success, not all data were available at the scale at which the vaccine campaign took place, limiting the model’s utility. Specifically, vaccination campaign planning was conducted in Cabo Delgado at the neighborhood level (Admin 4), yet publicly available boundary data were only available for district subdivisions (ie, “postos”) at the Admin 3 level. Additional discussions were required with the Health Cluster and the Ministry of Health representatives in Pemba to access Admin 4 boundary data and link to available population data sources to update the model at the relevant operational scale. Obtaining data sources and aggregating them to the same administration level were the rate-limiting steps. To bolster future efforts, common operational humanitarian data at the scale of operational activities should continue to be reviewed and made available as part of a preparedness framework, to account for planning requirements specific to emergency response.
For forecasts of infectious disease transmission to be useful to health- and humanitarian-response policy makers in the aftermath of natural disasters, they must be made available in near real-time and continuously updated before and during an outbreak as information becomes available. To date, there are few examples of this actually working successfully. During the 2013-2016 West African Ebola outbreak, many attempts were made to forecast the spread of Ebola in real-time, with varying levels of accuracy. Reference Funk, Camacho, Kucharski, Eggo and Edmunds21,Reference Chretien, Riley and George22 While efforts have been made to increase data availability in the midst of outbreaks, 23,Reference Yozwiak, Schaffner and Sabeti24 one challenge to forecasting is that epidemiological data are typically not shared in formats that are easily analyzed by agencies involved. Other information necessary for forecasting, such as the population distribution and density, and – crucially – the population mobility patterns that will spread disease, is often lacking at the scale, format, and timeliness needed to be integrated into models. What data are available can often be on the wrong spatial resolution.
Exacerbating these data availability issues, the modeling itself requires substantial expertise that is generally found among researchers in academic institutions and covers more than one area of expertise (eg, geographic information systems, mapping, and infectious disease modeling). Health practitioners, and even academic medical or public health researchers, may not have the modeling literacy or familiarity to quickly interpret the model or understand its limitations and generalizability, limiting their ability to translate findings to response decision makers. Academics often do not have access to responding agencies and do not know the relevant policy questions. Thus, the data, human capacity, and appropriate communication channels are often lacking for rapid response to a potential or emerging outbreak. These issues in information management, trusted relationships, and transdisciplinary and trans-practice team communication skills create compounded collaboration challenges.
There is a clear distinction to be made between data sets that are already available and need only be compiled on the right spatial scale for a particular location, and real-time data that emerges in the course of an outbreak. The first data sets are amenable to curation and storage in central repositories, and there have been efforts to make these available through WorldPop (Southampton, England), Facebook, the Humanitarian Data Exchange (OCHA), and other groups.Reference Tatem 25 – 27 The second category of data sets, which are much more important – the timing, location, and number of disease cases, for example – are much more difficult to generate and curate on the time-scale of an outbreak. The agencies that collect such data often do so in difficult conditions where data collection and dissemination in the formats needed for modelling are simply not a priority. As a result, if they are reported publicly at all, these data are likely to be reported as a sporadically updated pdf document that is not immediately amenable to further analysis.
Furthermore, articulating the policy decisions that need to be made in a way that is amenable to a modeling framework is challenging, particularly as most agency workers and humanitarian health responders are not trained in the design or interpretation of epidemiological models. For example, the question of which districts to prioritize for vaccination efforts to avoid the spread of cholera is a reasonable modeling question, but the specific village targets and where to put treatment centers may not be. Similarly, models can provide insight into relative risks and compare different intervention scenarios, but they rarely make useful predictions about absolute numbers of cases. This mismatch between the need to make concrete decisions about the allocation of limited resources, and the potential value and limitations of modeling, can paralyze efforts on both sides to translate findings to the field. Previous literature has called for advances in transdisciplinary knowledge domains between researchers across disciplines and practitioners to make sense of empirical knowledge.Reference Lawrence and Gatzweiler 28 This study forecasting the spread of cholera described here supports the need for advancements in the analytical pipelines for rapid disease forecasting, and a focus on building networks of interdisciplinary teams for crisis response.Reference Rivers, Chretien and Riley 29
There are two aspects from this study that are particularly important; first, the modeling team was embedded in an academic environment that facilitated broad engagement with domain-specific experts across a range of fields, and at other institutions (in this case Justin Lessler and other cholera experts at Johns Hopkins University [Baltimore, Maryland USA]). Academics are well-positioned to conduct this work because they are at the forefront of the science of forecasting and infectious disease epidemiology. Second, the involvement of experts at agencies like Direct Relief and NetHope (McLean, Virginia USA), and a hybrid team member from NetHope and Northwestern University (Evanston, Illinois USA) that understood the methods and value of modeling, allowed for constant feedback with the WHO, Health Cluster, and others on the ground, and importantly, for well-formulated, policy-relevant modeling questions to be relayed to the modeling team, and model results to be communicated back to policy makers.
A recurring issue for the sustainability of an approach like this is that of incentives. Currently, many actors responding directly to a crisis may not see enough value in modeling that they are willing to change current practice and invest time during an emergency to collect and curate data and absorb information from risk maps. Academics are not incentivized to respond to outbreaks, and in fact in many cases, they are obliged not to, because they are funded on grants which dictate how they use their time. Since the turn-around time for grants is lengthy, outbreaks are often over before any rapid grant mechanism could possibly take effect. Despite the enormous pool of expertise available for modeling and analysis, therefore, only flexible funding that supports participation in such teams can provide sustainable academic engagement. As forecasting methods continue to develop and improve, there is a need to systematically incorporate modeling into outbreak response and to better understand the types of data and human logistics that need to be organized in sufficient time, and with sufficient connection to the relevant response networks, that such modeling might influence operational strategy.
Conclusion
This study was an example of how a small, flexible team of researchers and implementing humanitarian responders can work together to produce forecasts in near real-time, before and during an outbreak. In the aftermath of two devastating cyclones, simple modeling techniques produced accurate predictions of the emergence and spread of cholera that had the potential to guide decisions in the response. Using a transdisciplinary approach, co-design and co-production occurred 30 regularly during the effort among academics, non-academics, and hybrid team members with both roles. This experience and the lessons learned from it can inform an important template that could be replicated and scaled in the future.
Conflicts of interest
none