The food habits developed in early childhood influence future food preferences (into adulthood)(Reference Ventura and Worobey1), growth and development, as well as the risk of chronic disease in adulthood(Reference Anjos, Altmäe and Emmett2–Reference Spence, Campbell and Lioret6). Dietary and feeding guidelines for young children have been designed to ensure that young children meet their unique nutrition needs due to rapid growth and development(7). However, global research has shown that toddlers’ food intakes do not meet vegetable, total sugar and discretionary food recommendations(Reference Spence, Campbell and Lioret6,Reference Ahluwalia, Herrick and Rossen8–Reference Gibson and Sidnell12) , which may increase their risk of diet-related diseases(Reference Anjos, Altmäe and Emmett2–Reference Pearce and Langley-Evans4). Recent research has also reported that a diet high in ultraprocessed (UP) foods is associated with an increase in overall energy intake and consequent weight gain and risk of obesity(Reference Hall, Ayuketah and Brychta13,Reference Rauber, Steele and Louzada14) , as well as an increased risk of CVD(Reference Srour, Fezeu and Kesse-Guyot15), stroke and even mortality(Reference Rico-Campà, Martínez-González and Alvarez-Alvarez16) in adults.
The availability of food within the broader food environment has been shown to be a driver of obesity(Reference Thornton, Crawford and Lamb17), and food industry plays a pivotal role in helping to create food environments. Presently, many young children are exposed to an obesogenic food environment, which is characterised by heavy marketing of foods low in nutritional quality(Reference Chapman, Nicholas and Banovic18–Reference Hickey, Mandelbaum and Bloom20). Within the retail food environment, marketing comprises the four main P’s of marketing (product, place, promotion and price)(Reference Greisen, Siegel and Sager21) with promotion including claims and messages(Reference Besler, Buyuktuncer and Uyar22–Reference Sylvetsky and Dietz26). These claims and messages influence parental food purchases(Reference Berry27–Reference Harris, Thompson and Schwartz30) and ultimately the toddler diet.
There has been substantial growth in the number of ready-to-eat, processed food products for toddlers (children aged 12–36 months), globally over the last 10 years(Reference Dunford, Louie and Byrne31,Reference Harris, Fleming-Milici and Frazier32) , which have increased in popularity due to their convenience(Reference Harris, Fleming-Milici and Frazier32–Reference Reiley38), as well as marketing(Reference Hickey, Mandelbaum and Bloom20,Reference Harris, Fleming-Milici and Frazier32) . These food products have been found to be high in total sugar and salt as well as UP(Reference Harris, Fleming-Milici and Frazier32,Reference Crawley and Westland35,Reference Crawley and Westland39) . In addition, many of these food products do not meet dietary recommendations for nutrient composition (such as sugar, salt and energy), texture and processing(Reference Harris, Fleming-Milici and Frazier32,Reference Crawley and Westland35,Reference Crawley and Westland36,Reference Crawley and Westland39–42) . Exposure to a range of food textures in early childhood (late infancy and early toddlerhood) has been shown to be key in the development of appropriate muscles required for mastication of foods as well as the acceptance of a range of food textures(Reference Coulthard, Harris and Emmett43,Reference Nicklaus44) . There is also recent evidence linking high intakes of UP foods in young children to cardiometabolic risks(Reference Elizabeth, Machado and Zinöcker45,Reference Leffa, Hoffman and Rauber46) , asthma(Reference Elizabeth, Machado and Zinöcker45), overweight and obesity(Reference Costa, Del-Ponte and Assunção47), lower consumption of minimally processed (MP) foods(Reference Karnopp, Vaz and Schafer48) and lower overall diet quality(Reference Vandevijvere, De Ridder and Fiolet49). There is also evidence reporting an association between a lower intake of UP foods and higher rates of continued breast-feeding from birth to 24 months(Reference Marçal, Mendes and Fragoso50).
Paralleling this expansion in the toddler food market is the market for toddler milks. These are marketed for consumption by children aged 12–36 months and are an UP food product containing powdered milk, vegetable oils, sweeteners and vitamins and minerals. While the total kilojoules provided are nearly equivalent, the nutrient contributions differ between cow’s and toddler milks(Reference Harris, Fleming-Milici and Frazier32) and they frequently have comparable total sugar levels with that of soft drinks(Reference Bridge, Lomazzi and Bedi51). Since their introduction in the 1980’s, both global sales of toddler milk(Reference Baker, Smith and Salmon52) and toddler milk product diversity within Australia(Reference Mintel53–Reference Mintel56) have increased steadily. This increase is occurring despite the WHO stating that toddler milks are unnecessary for optimal child growth and development, something that safe and nutritious complimentary foods can achieve(57,58) .
Infant (baby) and toddler food product audits have previously been conducted in Australia(Reference Dunford, Louie and Byrne31), the USA(Reference Harris, Fleming-Milici and Frazier32) and the UK(Reference Crawley and Westland35,Reference Crawley and Westland36,59) . Results from these audits highlight that the number and variety of foods and milk products for young children are vast and that there is poor alignment with dietary recommendations(Reference Harris, Fleming-Milici and Frazier32,59,60) . Regular monitoring of this rapidly evolving market is essential to inform policy and practice, and it is timely to update Australian data, last collected in 2013. The present study provides a contemporary and comprehensive snapshot of the retail toddler food and milk environment in Australia. The aim of this cross-sectional study was to investigate and describe the nutrition content, claims and messages of all commercially available toddler foods and milks within the Australian retail food environment.
Methods
Data collection
Two Melbourne suburbs formed the sampling frame for this study, which was conducted in November 2019. Retail premises to be audited comprised those most likely to provide foods and milks for toddlers. This included the four supermarket chains – Coles, Woolworths, Aldi and IGA – who collectively constitute 80 % of the Australian supermarket share(61), and one pharmacy – Chemist Warehouse, known to represent close to 25 % of the total pharmacy share in Australia(Reference Dickson62). Two suburbs, each with flagship stores (largest stores with the most stock) for Coles and Woolworths (personal communication with both companies) (J McCann, unpublished results), were chosen to increase product capture. An internet search for toddler food products was also conducted via Coles and Woolworths online. Given online options may vary by location, multiple flagship stores (at least two in each state or territory) were included in the online search to maximise product representation (J McCann, unpublished results). Online searches were also undertaken for all brands of toddler foods that had been identified by the supermarket in-store and online audits to capture products and varieties that could only be ordered online directly from manufacturers or third-party websites. To ensure all toddler foods and milks (foods and milks/formula specifically marketed for children aged 1–3 years, or 12–36 months) were audited, products within the baby food aisle, the freezer aisles, as well as the refrigerated and health food aisles were checked for the inclusion criteria listed below. Toddler foods and milks were relatively easy to identify from the product packaging, as most often the age was listed on the front or back as described below.
Inclusion criteria
The following inclusion criteria were applied when selecting products for the analysis.
Products targeted to toddlers 12–36 months were identified by examining each product for the words baby, infant, toddler or tots or by an age range between 12 and 36 months on the packaging or advertising. Products labelled infant or baby were assessed by checking the label for an age indication, to ensure they were targeted to >12 months.
Products with the words ‘child’, ‘children’ or ‘kids’ were also visually inspected and then assessed as above to ensure they were targeting children <36 months.
Products with a listed age which crossed over the age range of 12–36 months were assessed individually for inclusion (e.g. 1–4 years, 1–5 years). Products which were labelled as suitable for both infants and toddlers (marketed from 6 months+) were included only if the nutrition information panel (NIP) included reference to a % daily amount for children above 12 months, and within the 12–36-month age range of interest. Products that were labelled as suitable for toddlers and older children (above 3 years) were evaluated on a case by case basis and were included if the majority of the age range was within the age range (12–36 months) of interest for this study.
For in-store data collection, a smartphone was used to photograph all product marketing from all sides of products. Photos were transferred onto a computer and visually examined by J.M. Data were then extracted and collated into a spreadsheet. For online searches, the URL was recorded and screenshots of the product/s were taken and data were extracted from the online information and product images. All data were manually entered into an excel spreadsheet for further analysis. A random sample of 20 % of product data was cross-checked by a second person (J.W.) against the photos. This data collection methodology has been used in similar research(Reference Dunford, Louie and Byrne31). Any missing information was confirmed via company websites or by contacting companies directly for more information.
Data extracted included brand name, nutrition information per 100 g, serve size, stated texture, ingredients, unregulated claims and messages (e.g. taste, convenience, environmental, organic and other messages, which included messages from the company founder, recipe ideas, cross-promotion of other products and other messages such as ‘just as good as homemade’) and regulated claims (e.g. nutrition content, general and high-level health claims). Where product lines were available in several different flavours, all flavours and varieties were identified and counted as separate products. Exact duplicates (same product and size) from multiple stores were cross-checked and entered as one item only.
Product categorisation
All products were categorised as follows.
All products were first categorised as a food or a milk product. Foods were then further categorised as a meal or a snack food. All meals were classified as savoury, snack foods were classified as sweet or savoury, as reported by Garcia et al. (Reference García, Raza and Parrett63), and snack foods (sweet and savoury) were classified into sub-categories based on main ingredients and aligned with the classification proposed in a 2019 WHO report(42) (Fig. 1).
Foods were also categorised according to their dominant texture, which was based on either the texture as stated on the packaging (as determined by the manufacturer) or by visually inferring from the product image on the pack. The Australian Dietary Guidelines (ADG)(7) and the Australian Bureau of Statistics discretionary food list and descriptions(64) were used to classify all food as either five food group foods (referred to as core foods hereafter) or discretionary foods. Discretionary foods, according to the Australian Guide to Healthy Eating(Reference Spiteri, Olstad and Woods65), are products which are high in sugar, salt and/or fat and include cakes, biscuits, ice cream, fast food and lollies and chocolates. Note that the recommended serve size for discretionary foods for toddlers aged 2–3 years is 7–10 g(7) and, for reference, one standard plain biscuit weighs approximately 18 g. All foods were also classified according to their processing level (MP, processed or UP), based on the NOVA classification system(Reference Monteiro, Cannon and Levy66,Reference Monteiro, Cannon and Moubarac67) . Discussion and consensus from all four researchers were sought for those products that were difficult to classify.
Claims and messages were classified according to Food Standard Australia New Zealand Standard 1.2.7(68); claims defined in this Standard were termed “regulated claims’ for the purposes of this study and were categorised as nutrition content claims and general and high-level health claims. All other claims or messages were referred to as ‘unregulated claims’ and were sub-classified as taste/convenience, child-specific messaging, health-related ingredient claims (e.g. no added preservatives), natural, organic or environmental and other messages (e.g. messages or advice from company founder).
Nutrient content was derived from the NIP for all foods and milks. Where missing values for nutrients were encountered (toddler milks only, n 5), values were imputed using other data. For example, on toddler milks where total sugar was not displayed, the corresponding carbohydrate value was used (as most milks had values for sugars and carbohydrate that were equivalent).
Data analysis
All analyses were conducted using SPSS (version 26, IBM Corp.). Descriptive statistics were used to report the proportion of foods in each category and sub-category, ADG and NOVA classification, sweet or savoury snack foods, age, texture, and claims and messages. Tests for normality on the nutritional values of foods were performed and confirmed that data were not normally distributed; therefore, non-parametric testing was undertaken. Median and interquartile range values for nutritional information were calculated from the NIP. Results were stratified by product type (meal or snack food), ADG and NOVA classification where appropriate. Mann–Whitney U tests were conducted for testing nutrient differences and type of claims and messages frequency between core and discretionary foods, and Kruskal–Wallis tests were performed to test for differences in levels of nutrients and type of claims and messages frequency between NOVA groups (tested at a 5 % significance level).
Results
Toddler foods
General characteristics
In total, there were 154 unique foods (including all distinct varieties and flavours) identified (Table 1), from twenty-two different manufacturers. Snack foods represented 80 % of all foods. Of the snack foods, 81 % were classified as sweet. Core foods represented 60 % of products, and 85 % of all foods were UP. Seventy-one percentage of all products were labelled specifically for the toddler years (12–36 months age range). The majority of foods identified required some mastication, which corresponded to the reported textures of chewy, chunky, crispy and crunchy accounting for 75 % of all products. Sweet cereal-based finger foods such as fruit-based cereal or snack bars were the most predominant snack food type. The most common core foods were yoghurts, meals and sweetened rice biscuits, while fruit-based cereal and snack bars and extruded puffs were the most common discretionary foods. The most common MP foods were fruit-based ‘raw’ ingredient balls, while meals were the most common processed food. Fruit-based cereal and snack bars were the most common UP food identified, followed by yoghurts. When classified according to both ADG and NOVA, yoghurts and meals were the most common core UP foods, while fruit-based cereal and snack bars were the most common discretionary UP food.
Table 1 Proportion of toddler foods by sub-category or classification
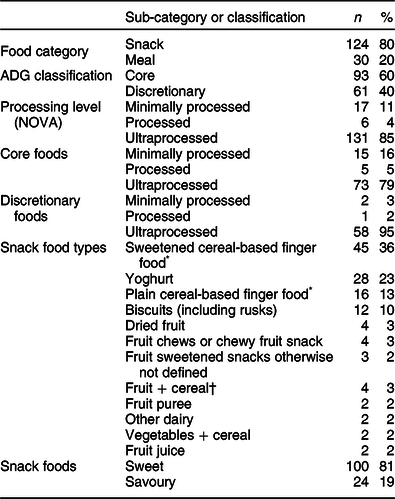
* Cereal is the main ingredient.
† Fruit is the main ingredient.
Nutrition characteristics
There was a wide variation in the nutrition information when analysed between product category, ADG and NOVA classification, as can be seen in Tables 2-4, respectively. Analysis of the nutrition information per 100 g for meals and snacks found snack foods to have significantly higher values for energy, fat, carbohydrate and total sugar (P < 0·001), while meals were found to have significantly higher values for Na (P < 0·001) (Table 2).
Table 2 Median (interquartile range) nutrition information per 100 g for meals and snacks
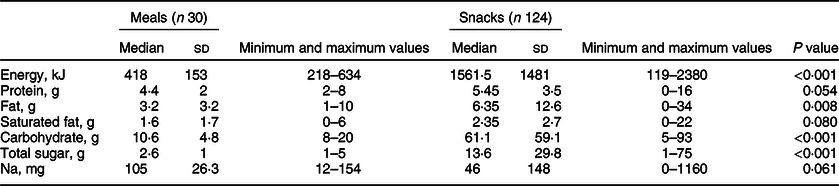
Table 3 Median (interquartile range) nutrition information per 100 g for core and discretionary foods
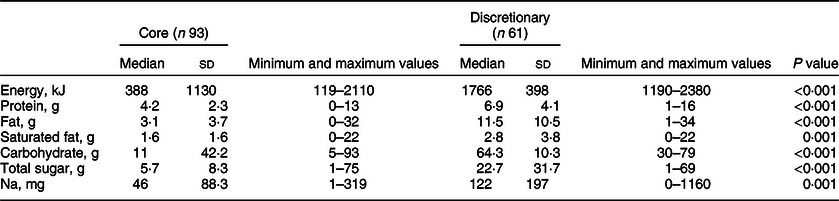
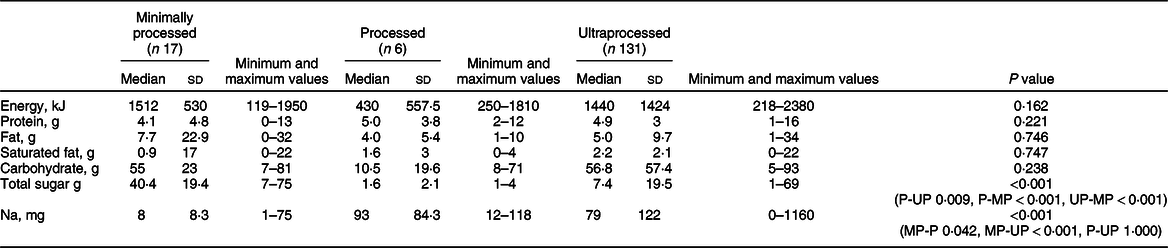
Table 4 Median (interquartile range) nutrition information per 100 g for foods across NOVA groups
Total sugar represents a combination of intrinsic sugars (for fruit and yoghurts) and those sugars added to products (extrinsic sugars). Sixty-six percentage (n 101) of all foods had some form of added sugar. Added sugar in the form of fruit pastes, purees or concentrates was found in 31 % (n 40) of snacks and 70 % (n 21) of meals (no other forms of added sugar were found in toddler meals). In addition, 19 % (n 23) of snacks had only sugars, such as maltodextrin, sugar or syrups added.
Per 100 g, discretionary foods were found to have higher values for energy, protein, fat, saturated fat, carbohydrate, total sugar and Na levels than core foods (P < 0·001). Analysis of NOVA groups was more complex and was compounded due to the low number of products in both MP and P categories. Analyses for significance of all pairwise combinations for all nutrition values as per the NIP per 100 g were conducted for NOVA groups. Results showed that when comparing MP foods with UP foods, total sugars were significantly higher (P < 0·001) and Na significantly lower (P < 0·001) in MP foods. In addition, significantly higher levels of total sugar (P < 0·001) and lower levels of Na (P = 0·014) were found in MP compared with processed foods. There were no significant differences found between medians for energy, protein, total fat, saturated fat and carbohydrates. As it would be expected that UP foods would be higher in energy, total fat and saturated fat as well as carbohydrates and total sugars than MP foods, further exploration of the sample of MP foods was undertaken and seven foods (raw ingredient bars and balls) were identified that had high levels of energy, protein, total fat and sugars due to the use of vegetable oils (mainly coconut oil), nuts, seeds and dried fruits. In addition, four products were dried fruit, which had high carbohydrate and total sugar levels, and two products were fruit drinks, which had very low levels of nutrients when compared with the other products in the MP category. These results demonstrate the highly variable sample within the MP category. There were no other statistically significant nutrition results found between NOVA groups.
Claims and messages
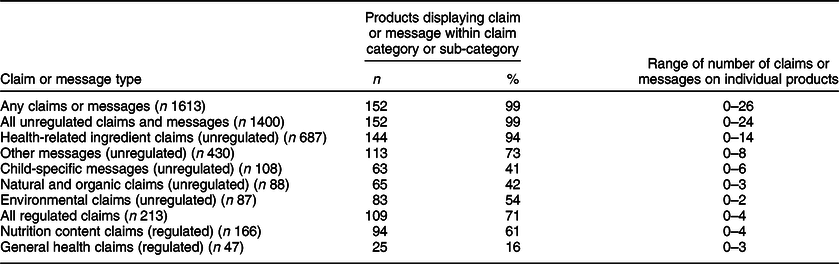
Nearly, all food products (99 %) had some messages or claims on the packaging, with the total number of claims or messages per product ranging from zero to twenty-six (Table 5). Products with high numbers of messages and claims (such as the product with twenty-six) often had many allergen messages/claims on the package such as free from gluten, nut, dairy, soy and even shellfish, as well as kosher, halal and organic messages. Unregulated claims and messages such as lack of additives, preservatives, colours and flavours were more common than regulated claims such as low sugar or gluten-free.
Table 5 Number (%) and range of claims and messages on toddler foods
n (%) = Frequency of claims or messages.
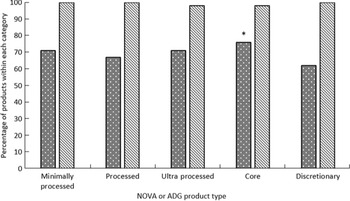
Core foods had a slightly higher mean number of claims and messages (of any type) than discretionary foods. Core foods had significantly more regulated health claims than discretionary foods (P = 0·001) (Fig. 2), with no significant difference in total unregulated claims and messages between core and discretionary foods. However, there were significant differences when claims and messages within sub-categories were analysed by core or discretionary foods. Discretionary foods displayed more child-specific messages (P < 0·001) and organic or natural messages (P = 0·028), while core foods had more taste claims (P = 0·009), general level health claims (P < 0·001) and environmental claims and messages (P = 0·003). The distribution of the number of claims and messages between NOVA groups was non-significant and is also shown in Fig. 2.
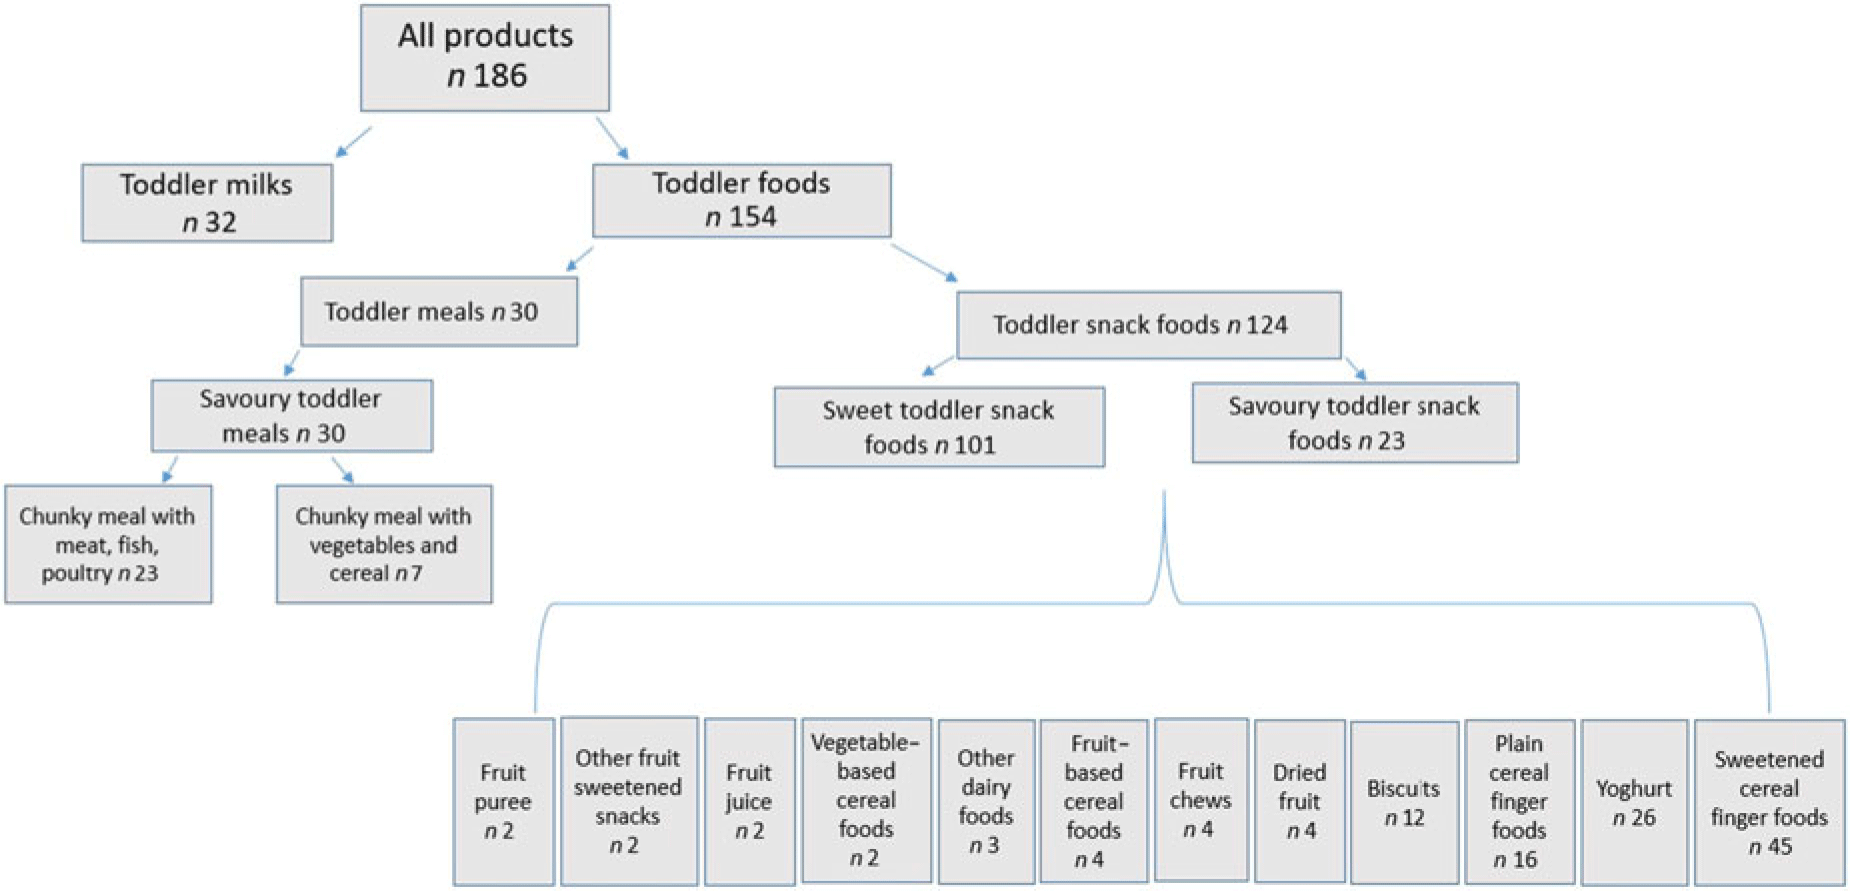
Fig. 1 Product categorisation
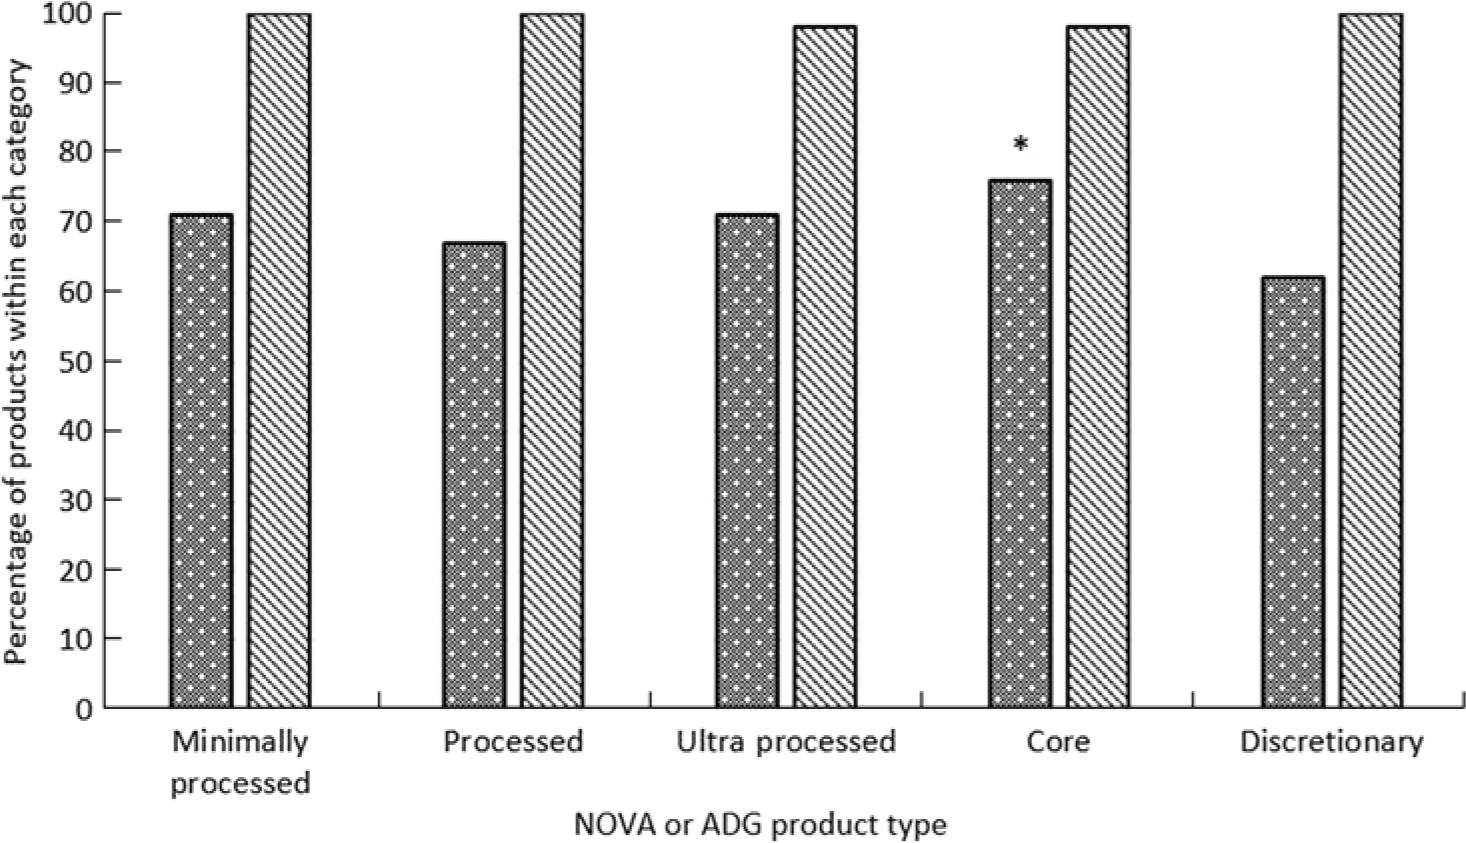
Fig. 2 Percentage of products with claims and messages by Australian Dietary Guidelines and NOVA, *P = 0·001. ![]() , Regulated claims;
, Regulated claims; ![]() , unregulated claims and messages
, unregulated claims and messages
Toddler milks
General characteristics
In total, there were thirty-two toddler milks identified from fifteen different brands. The most common age listed on the product packaging was targeted at toddlers aged 12 months or 1 year and above (65 %), then 1–3 years or 12–36 months (25 %) followed by 2 years and above (10 %).
Nutrition characteristics
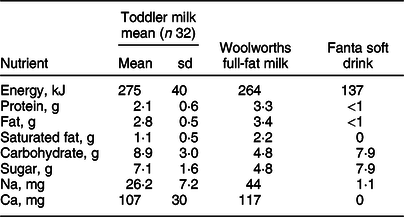
Per 100 ml, compared with full-fat cow’s milk, the mean energy content of toddler milk was higher, while the mean protein, total fat and saturated fat levels were lower (Table 6). Additionally, the mean carbohydrate and total sugar levels in toddler milk were almost double that of cow’s milk, and mean Na and Ca levels were found to be lower in toddler milk than cow’s milk. Compared with Fanta soft drink (Australia)(69) (which was used to compare total sugar content, as per previous research)(Reference Bridge, Lomazzi and Bedi51), toddler milks were found to be higher in total energy and carbohydrate, with nearly as much total sugar. Added sugars (such as maltodextrin, glucose syrup and added lactose) were present in 90 % (n 29) of toddler milks. Of note, six milks had missing values for either total sugar or saturated fat on the NIP (which is non-complaint with Food Standard Australia New Zealand standard 1.2.8)(70).
Table 6 Mean nutrition value (sd) of toddler milk compared with cow’s milk and soft drink, per 100 ml
Claims and messages
Claims and messages were present on all toddler milks, ranging from two to twenty-six claims (Table 7). Unregulated health-related claims and messages (e.g. no artificial colours or flavours, partially hydrolysed whey protein, added probiotics) were found on all toddler milks, while other messages (e.g. dental care, recipe ideas, cross-promotion of other products) were found on 81 % of milks. Regulated claims were found on 91 % of all toddler milks, with nutrition content claims such as high levels of vitamins or minerals being common, and general level health claims such as Zn for immunity and Fe for energy were identified on 75 % of milks. Both regulated and unregulated claims were heavily used (around fourteen claims, with an average of six unregulated and eight regulated claims per product) in the Australian toddler milk market. This can be further broken down into an average of five general level health claims (regulated), three nutrition content claims (regulated), two health-related ingredient messages (unregulated), one child-specific message, one environmental message or claim and two other messages (unregulated) per toddler milk.
Table 7 Number (%) and range of claims and messages on toddler milks, n 32
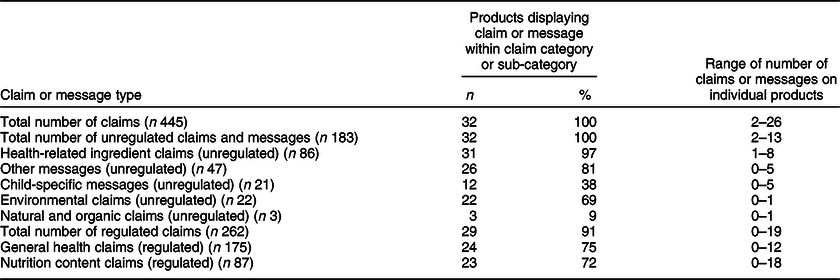
n (%) = Frequency of claims or messages.
Discussion
This study extends a 2013 analysis of the toddler food and milk environment for Australian children, providing a more nuanced and detailed evaluation of the contemporary commercial food and milk environment targeting this age group in 2019(Reference Dunford, Louie and Byrne31). Results demonstrate that the toddler food environment in Australia is comparable with that of other countries in terms of the high prevalence of snacks (80 %), as well as the predominance of sweetened foods(Reference Dunford, Louie and Byrne31,Reference Harris, Fleming-Milici and Frazier32,Reference García, Raza and Parrett63) .
Currently, NIP labels in Australia are only required to state the total sugar content, with no differentiation between added and naturally occurring (intrinsic) sugars. In addition, there is no adequate definition of added sugar available in Australia; however, work is currently underway to develop this for labelling purposes. Added sugar (determined by the ingredient list using international standards(42,71,72) ) was present in 66 % of all foods, with sources such as fruit pastes, purees or concentrates being the predominant form of added sugar. These results are similar to the research conducted in the USA(Reference Elliott and Conlon73). Recommendations from the US study called for policy action on added sugar in toddler foods, which is echoed in the results from the present study. The present study also demonstrates that more than half of all toddler foods in the Australian retail food environment are core foods (60 %), as well as the vast majority (85 %) are UP, with 79 % of core foods classified as UP. This misalignment of the ADG and NOVA classification may potentially be causing adverse health outcomes in children as many core foods are being promoted through the ADG as healthy, yet are UP, which have been associated with adverse health outcomes(Reference Hall, Ayuketah and Brychta13–Reference Rico-Campà, Martínez-González and Alvarez-Alvarez16). Further, the retail market for toddler milks has been expanding globally, and this study found that, in the Australian context, a diverse range of manufacturers are competing in the sector, with thirty-two toddler milks from fifteen different brands identified.
Analysis of the nutrient information per 100 g from toddler foods showed a wide range of energy for snack foods. This was due to the large variety in the types of snack foods with fruit and cereal bars, biscuits, dried fruit and raw bars and balls having higher energy content than other snack foods such as extruded puffs and rice crackers.
Our results clearly demonstrated that discretionary foods were of poorer nutritional quality than core foods, which is not surprising, as discretionary foods are not part of the ADG five food (core) groups due mainly to their nutrient composition(7). Analysis of nutrition quality between NOVA groups was not straightforward, and the outcomes of analysis were not as expected. Per 100 g, total sugar was significantly lower and Na was significantly higher in UP foods when compared with MP foods, as well as between processed and MP foods, respectively. There were no significant differences in other nutrients between each of the NOVA groups. This was unexpected, as studies of population diets have shown that high energy consumption from UP foods is associated with higher intakes of sugar(Reference Elizabeth, Machado and Zinöcker45). UP sugars were present in many of the foods in this audit, which, when added during processing, classify the product as UP(Reference Monteiro, Cannon and Moubarac67). Of note was that many of the MP foods contained coconut oil, nuts, seeds and dried fruit. The use of dried fruit as an ingredient can explain the high sugar results observed in these foods. Despite dried fruit being considered a core food within the ADG, there are recommendations to limit intake, as well as coconut oil being specifically identified as being inconsistent with ADG recommendations due to its high saturated fat content(7). This suggests that further regulatory efforts may be needed to curb the heavy reliance on dried fruits and vegetable oils in these types of toddler foods. Considerable research into the health outcomes and marketing of UP foods has begun to emerge; however, no previous research has conducted these types of analyses on toddler foods.
Toddler milks were found to have similar levels of total energy, and nearly twice the levels of carbohydrates and total sugar, than full-fat cow’s milk, and higher levels of carbohydrates and nearly as much sugar as the Australian formulation of Fanta soft drink which has around 7·9 g of sugar per 100 ml. This aligns with international research on infant and follow on formulas, which reported that many toddler milks have high total sugar levels, some nearly double the sugar levels of the UK formulation of Fanta Orange (UK) (which has around 4·6 g of sugar per 100 ml)(Reference Bridge, Lomazzi and Bedi51). Added sugars (extrinsic sugars) were present in 90 % of toddler milks, which was only evident by carefully reading the ingredient list, with two toddler milks had maltodextrin and lactose as the two main ingredients. These levels of nutrients (with the exception of added sugar) may be appropriate for toddlers who genuinely need toddler milk as a supplement; however, they are not appropriate nor recommended, for healthy toddlers, as identified by the WHO(74,75) . In Australia, toddler milks are present in the general food supply as they meet the requirements for a supplemental product(76), which means they are meant to be used in special circumstances and to address certain health conditions, and are not intended for use by the healthy toddler population. Toddler milks are, however, currently marketed as being necessary for the general toddler population in Australia and elsewhere(Reference Berry27,Reference Berry, Jones and Iverson77–80) .
Also of note from the present study was that >50 % of all foods had some form of added sugar. This was mainly in the form of fruit, namely pastes, purees or concentrates (31 % of snacks and 70 % of meals). This parallels previous research from the USA(Reference Harris, Fleming-Milici and Frazier32) which found not only that over 80 % of snack foods for toddlers are sweetened, but also that 53 % of bite-sized meals for toddlers had added sweeteners (non-specific if fruit based or other). The widespread use of sweetening ingredients in these foods will mask any inherent bitter or sour tastes present(Reference Murray81) (e.g. from vegetables) and lead to a predominance of sweet taste across the product range. Although children are innately predisposed to like sweet foods and dislike bitter or sour tasting food, taste preferences are modifiable through repeated and diverse sensory exposures(Reference Mennella82) such that with repeated exposure to bitter and sour tastes, which are often found in vegetables and some fruits, children can develop a greater liking of them, and this is associated with their greater consumption(Reference Mennella82,Reference Boesveldt, Bobowski and McCrickerd83) . The predominance of sweetened products in the toddler food environment is therefore of concern as children who consume high amounts of these foods will be given less of an opportunity to learn to like a wide range of tastes(Reference Boesveldt, Bobowski and McCrickerd83). Furthermore, research has reported that preferences and dietary intake patterns formed in infancy and early toddlerhood track into later toddlerhood(Reference Spence, Campbell and Lioret6,Reference Skinner, Carruth and Houck84) . This reaffirms the importance of acceptance of a variety of foods (flavours and textures included) in the first few years of life – something that the current mix of toddler foods is not supporting.
The development of healthy eating behaviours, including acceptance of a range of foods which align with dietary guidelines, requires children to be repeatedly exposed to foods that vary in their sensory qualities(Reference Birch, Savage and Ventura85) which includes not only taste and flavour but also texture. Exposure to a variety of food textures in early childhood has been shown to be important to support the development of appropriate chewing muscles required for mastication of foods as well as the acceptance of foods of varying textures(Reference Coulthard, Harris and Emmett43,Reference Nicklaus44) . Yoghurts, while contributing essential vitamins and minerals to the toddler diet, comprised 20 % of foods from the present study and were found to be smooth in texture as well as sweet. Repeated exposure to sweet foods with smooth textures has been reported to delay or inhibit the development of healthy eating behaviours(Reference Nicklaus44,Reference Birch, Savage and Ventura85,Reference Norton and Raciti86) . The majority of products (76 %) in this study were found to have textures which required mastication; however, package descriptions were used to identify texture rather than an objective measure of texture.
In the present study, there were significantly more unregulated health-related ingredient claims on UP compared with MP foods and more unregulated other messages on MP compared with UP foods. There were no other significant differences in the type or total number of regulated or unregulated claims or messages between processing levels of foods found. Core foods were found to have significantly more taste, environmental and general level health claims and regulated claims overall than discretionary foods, while discretionary foods were found to have significantly more child-specific and organic or natural messages than core foods. However, as previously mentioned, 43 % of core foods were also classified as UP. These findings could suggest that manufacturers of core foods are attempting to differentiate them from discretionary or junk foods by including more regulated health claims to appear ‘better for you’ or ‘healthier’. On the other hand, in an effort to differentiate, discretionary foods may be more likely selling their organic and child-specific attributes, both of which are unregulated, without overselling their health attributes(Reference Pulker, Scott and Pollard87). Examining how on-pack marketing influences consumer choice when choosing food for young children needs to be a focus for this age group, as it will contribute to policy considerations relating to toddler food and drink marketing.
Many of the claims and messaging present on toddler milks have little scientific evidence to support them such as DHA to support brain development or prebiotics to support digestion(Reference Harris, Fleming-Milici and Frazier32,Reference Harris and Pomeranz88,Reference Timmons89) . Our results are similar to results from the USA, which demonstrated that toddler milk labels included an average of four nutrition-related and three child-developmental messages per product (not including environmental, organic or other unregulated claims)(Reference Harris, Fleming-Milici and Frazier32). Claims and messages are an important tool for marketing toddler milks to parents in a market where it is hard to differentiate products due to regulations around formulations. This result highlights that the policy void around unregulated claims may be creating an unintended marketing opportunity that may further confuse parents and put young children’s health at risk. This is another area for future research.
Understanding the correlates of toddler’s food intakes and food preferences is central to informing our understanding of the opportunities to shape these behaviours. This study demonstrated not only that foods and milks specifically for toddlers are commonplace in the Australian retail context but also that the toddler food environment is abundant with products which contradict the ADG nutritionally and also by processing level(90). Results from this study and previous research have shown that there is considerable information displayed on toddler food product packaging. Previous research has also demonstrated that consumers use product packaging to make decisions about which foods to purchase. More information, specifically relating to toddler products, is needed about how these packaging attributes are influencing different types of consumers, to inform strategies for (1) assisting consumers to make health promoting choices, such as through education; and (2) changing food regulation to determine permitted product attributes on food packaging. Overall, our results show that this situation is not isolated to Australia. With the results from the present study, there is now a solid body of work which demonstrates that the global toddler food environments are problematic in terms of promoting unhealthy diets and food habits.
Public health messages supporting and educating parents and caregivers to create healthier meals and snacks for toddlers, and how to read on-pack information may help them evade the plethora of unhealthy and unnecessary foods and milks being targeted to this age group. In addition, further regulatory approaches, similar to those for infant foods and formulas, such as limiting ingredients and claims, and ensuring that toddler milks are clearly labelled as a supplementary food not intended for general use could reduce consumer confusion and result in UP toddler foods being replaced by less processed, more core food-based alternatives.
Strengths and limitations
An important strength of this study is that it has comprehensively audited the toddler food environment in Australia, including a range of stores and locations, replicating previously used methodology. In addition, this is the first study to also classify toddler food products against the NOVA classification, providing another perspective on this product category. To our knowledge, this is the only study which has applied both the ADG and the NOVA classification to toddler foods. Both the NOVA classification system and the ADG are appropriate for assessing toddler foods as evidence is emerging on the health implications of UPF(Reference Hall, Ayuketah and Brychta13–Reference Rico-Campà, Martínez-González and Alvarez-Alvarez16,Reference Elizabeth, Machado and Zinöcker45,Reference Leffa, Hoffman and Rauber46,Reference Marçal, Mendes and Fragoso50) , and through the results of this study, it is clear that many foods which are highly processed are being encouraged through our current ADG. This misalignment is potentially causing harm.
In addition, this is the only Australian audit inclusive of toddler milks. Previous research in this area has focused on the Health Star rating and nutritional profiles(Reference Dunford, Louie and Byrne31,Reference García, Raza and Parrett63) of a combination of baby (infant) and toddler foods and milks. By undertaking a comprehensive audit of the toddler retail food environment, a baseline for future research has been established. In addition, the findings from the present study can be useful in policy discussions, as well as consumer education and health promotion interventions around early childhood obesity prevention.
Limitations include the cross-sectional nature of this study, lending itself to one time point only, as well as products potentially being missed due to unavailability at the time of data collection. This could be mitigated through ongoing monitoring of the food supply. Misclassification of foods as core or discretionary may have occurred as the Australian Food and Nutrient Database (AUSNUT) 2011–2013 database is not an accurate depiction of the current food supply. In addition, other research(Reference Dickie, Woods and Lawrence91) has also recognised the problematic nature of applying the NOVA classification to the AUSNUT database of foods for two main reasons. The first is that the AUSNUT 2011–2013 database is not reflective of the current food supply, and second, as there are many additives and processes which are used to manufacture foods, some judgement must be used when applying the NOVA classification for some food products. The NOVA system, however, still remains the most relied upon classification system for information on the relationships between health outcomes and level of food processing(Reference Kelly and Jacoby92).
Conclusion
Child nutrition is fundamentally important for growth, development and a child’s future health. This study found that there are a large number of toddler-specific foods and milks present in the Australian food retail environment, with 83 % of foods available for toddlers being sweet, UP snack foods. There is no specific regulation in Australia relating to toddler foods, and whilst toddler milks do fall under Food Standard Australia New Zealand standard 2.9.3, the intended consumers of these milks do not necessarily represent the actual consumers, due to misleading marketing through compelling media promotion and on-pack attributes. On-pack claims and messages were many and varied across the spectrum of products audited, which may make it difficult for consumers to accurately evaluate the healthiness of toddler food and milk products. This then creates a situation in which consumers may struggle to make informed choices about food purchases for their young children, which then raises the question as to whether changes to regulation would make this choice easier for consumers. The frequent use of both regulated and unregulated claims across the spectrum of available foods in tandem with the high proportion of foods being classified as both core and UP could mean that identifying a healthier choice may be difficult for consumers. The results of this study provide important substrate for policy and practice in the Australian context.
Acknowledgements
Acknowledgements: None. Financial support: This research received no specific grant from any funding agency, commercial or not-for-profit sectors. Conflict of interest: There are no conflicts of interest. Authorship: J.M. conceptualised the study, conducted the data collection and analysed the data. G.R., K.C. and J.W. provided input into the study design and methods. G.R. and J.W. provided input into the analyses of the data. J.W. conducted the data checks. All authors read and approved the final manuscript. Ethics of human subject participation: Exemption for ethics was approved by the Deakin University Human Research Ethics Committee (2020-117), as the study involved no human participants.