


The literature shows that parents have a crucial role in children’s eating habits and health(Reference Power, Johnson and Beck1–Reference Nowicka, Sorjonen and Pietrobelli4), highlighting how parental feeding practices in the early years contribute to the development of children’s eating in terms of quantity and quality of daily energy intake, especially during mealtime(Reference Berge, Rowley and Trofholzl5). Observational studies have shown that parent–child feeding interactions could clarify the trajectory of early development of eating behaviours and obesity risk(Reference Berge, Rowley and Trofholzl5,Reference Berge, Wall and Bauer6) . Specifically, parents’ excessive use of feeding control seems to affect children’s food preferences and the ability to self-regulate food consumption, such as eating in the absence of hunger and satiety responsiveness, which increases the risk of children being with overweight or with obesity(Reference Frankel, Hughes and O’Connor7–Reference Birch10).
Over the last 20 years, one of the most well-known and used self-report measures to evaluate parental feeding beliefs, attitudes and practices is the Child Feeding Questionnaire (CFQ(Reference Birch, Fisher and Grimm-Thomas11)), which assesses parental feeding practices (e.g. monitoring, restriction and pressure to eat) and perceptions and concerns about child’s weight. The CFQ has been translated and validated in several countries (i.e. (Reference Nowicka, Sorjonen and Pietrobelli4,Reference Corsini, Danthiir and Kettler12–Reference Geng, Zhu and Suzuki19) ). As stated by Schmidt et al. (Reference Schmidt, Richter and Brauhardt20), and empirically assessed by Somaraki et al. (Reference Somaraki, Eli and Sorjonen21), parental feeding practices vary across cultures. However, there is a paucity of research on European countries, and, subsequently, further research on this topic is needed. Particularly, scant attention has been given to parental feeding practices in Mediterranean diet countries, where the CFQ has been validated only in Spain(Reference Canals-Sans, Blanco-Gómez and Luque22).
In addition to cultural issues, findings on the CFQ psychometric properties have led to inconsistent results concerning CFQ reliability and structural validity. Referring to internal consistency, previous works have shown most of the CFQ subscales as reliable, with the exception of Restriction, Pressure to Eat and Perceived Parent Weight(Reference Schmidt, Richter and Brauhardt20). Looking at structural validity, Birch et al. (Reference Birch, Fisher and Grimm-Thomas11), in their first study on the CFQ, reported a marginal fit for the original seven-factor structure. To improve the fit, composite scores (i.e. for items belonging to the Restriction subscale), error covariances (i.e. for items belonging to the Perceived Parent Weight subscale), removal of selected items (i.e. items belonging to the Restriction subscale) and/or creation of an additional factor (i.e. Food as Reward) were performed (e.g. (Reference Nowicka, Sorjonen and Pietrobelli4,Reference Corsini, Danthiir and Kettler12,Reference Kong, Vijayasiri and Fitzgibbon14,Reference Geng, Zhu and Suzuki19) ). Per Corsini et al. (Reference Corsini, Danthiir and Kettler12), the eight-factor solution has been shown to be the most accurate model(Reference Kong, Vijayasiri and Fitzgibbon14,Reference Liu, Mallan and Mihrshahi18,Reference Schmidt, Richter and Brauhardt20) , with the Food as Reward subscale consisting of two items from the Restriction subscale.
Furthermore, the CFQ scores have been shown to vary according to child’s age, gender, weight, ethnicity and with parents’ weight and socio-economic status (see Ref. (Reference Schmidt, Richter and Brauhardt20) for further details). However, few studies have been carried out on its measurement equivalence/invariance, although it is a relevant step for group comparison (e.g. Ref. (Reference Byrne, Shavelson and Muthén23)). Thus far, the CFQ measurement invariance has been confirmed across Black and Hispanic populations(Reference Kong, Vijayasiri and Fitzgibbon14,Reference Anderson, Hughes and Fisher16) , boys and girls(Reference Schmidt, Richter and Brauhardt20) and between children aged 2–5 and 6–9 years as well as between 6–9 and 10–13 years of age(Reference Schmidt, Richter and Brauhardt20). Nevertheless, none of these studies was devoted to assessing the CFQ measurement invariance across child BMI categories. Finally, with few exceptions, most of the previous papers enrolled small- to medium-size samples (<500 participants) and none of them considered child weight categories, thus leaving unexplored if the CFQ measures the same construct across underweight, normal-weight, overweight and obesity categories in children. The lack of research on this issue might have contributed to use the CFQ mainly as a tool for the assessment of parental feeding practices in children who are classified with overweight or with obesity(Reference Birch, Fisher and Grimm-Thomas11) rather than with normal weight, and/or with other weight problems(Reference Galindo, Power and Beck24,Reference Evans, Seth and Smith25) .
Since no Italian CFQ validation study has been made to date, the main purpose of the current paper was to evaluate the psychometric properties of the CFQ in a large community sample of Italian mothers of 6-year-old children. The choice of focusing on mothers of this specific age was given by the changes linked to entry into elementary school, a major milestone for children. Following the suggestions of Hendy and Williams(Reference Hendy and Williams26), entry into school represents a core change in environment for most children and is when a child’s ‘weight and diet become far more public than during preschool years’ (p. 710), and children’s food preferences and choices become more autonomous and clear (e.g. during recreation and lunch breaks). Moreover, Hendy and Williams(Reference Hendy and Williams26) reported a drop in child BMI% scores when entering elementary school and changes in mothers’ feeding practices with a reduction in fatty foods, ‘Insistence on Eating’, ‘Positive Persuasion’, ‘Use of Rewards’ and ‘Preparation of Special Meals’ (p. 715).
The specific aims of this study were as follows: (1) to evaluate the construct validity of the CFQ Italian version, in line with previous studies(Reference Corsini, Danthiir and Kettler12,Reference Schmidt, Richter and Brauhardt20) , where it has been hypothesised that the eight-factor model with the addition of the Food as Reward scale showed the best fit; (2) to assess, for the first time in the CFQ Italian version, measurement invariance across child BMI categories (i.e. children with underweight, normal weight, overweight and obesity) and to confirm invariance across gender(Reference Schmidt, Richter and Brauhardt20); no hypothesis was developed referring to structural invariance of the CFQ across BMI categories due to the lack of previous studies; (3) to evaluate the reliability of the CFQ scales, it was expected that there would be adequate internal consistency for most of the CFQ scales as previously reported by Schmidt et al. (Reference Schmidt, Richter and Brauhardt20). The last aim (4) was to investigate how maternal feeding practices vary according to child BMI categories and gender. In line with the literature(Reference Schmidt, Richter and Brauhardt20), we hypothesised that Restriction and Monitoring mean scores increased from children with underweight to children with obesity while Pressure to Eat decreased. Finally, we expected no or marginal differences between boys and girls, which is in line with most previous studies that administered the CFQ(Reference Anderson, Hughes and Fisher16,Reference Schmidt, Richter and Brauhardt20) .
Materials and methods
Participants and procedure
Participants were 2239 6-year-old Italian children (50·5 males) attending 1st grade and their mothers (mean age = 37·85 years; sd = 5·17). Inclusion criteria were (a) to be enrolled in first grade; (b) to take part in the Region Umbria Prevention Plan 2014–2018 project, ‘Improving Umbrian kids’ healthy lifestyle’, which followed the C.U.R.I.A.Mo lifestyle approach for kids; (c) to provide mothers’ written informed consent to participate in the study and (d) to complete both children’s and mothers’ assessments (i.e. anthropometric measures and survey questionnaire, respectively). Thanks to the help of teachers, students were asked to bring a sealed envelope to home for their mothers. Inside the envelope was their survey. Mothers were instructed to put the form back into the envelope and to seal it upon completion. Then, students brought the sealed envelope back to their head teachers within 10 d. On the eleventh day, research assistants went to schools and collected all materials. In the meantime, children’ height and body weight were measured by trained staff following standardised procedures(Reference Lohman, Roche and Martorell27) during regularly scheduled classes.
Children were grouped into four BMI categories according to the classification of the WHO(Reference Onis, Onyango and Borghi28,29) (https://www.who.int/childgrowth/standards/bmi_for_age/en/): 9·51 % were with underweight (n 213); 61·23 % were with normal weight (n 1371); 15·54 % were with overweight (n 348) and 13·72 % were with obesity (n 307). These percentages were in line with data from the Surveillance System of Italian National Institute of Public Health ‘OKkio alla salute’(Reference Nardone, Spinelli and Buoncristiano30).
Since large imbalance might affect the results of factorial invariance, and, specifically, its violations might not be detected due to this bias, we randomly selected a similar number of participants from the large group for the small group(s) and used the selected subsets of participants for analysis(Reference Yoon and Lai31). Therefore, from the largest sample, all children who were classified with underweight, overweight and obesity were selected, while a similar number of children with normal weight were balanced by gender, and mothers’ age was randomly selected.
The final sample included 1253 mothers (mean age = 38·22 years; sd = 4·89) and their children (53·9 % males; 17 % underweight, 30·7 % normal weight, 27·8 % overweight and 24·5 % with obesity).
Measures
CFQ(Reference Birch, Fisher and Grimm-Thomas11) consists of thirty-one items measured using a five-point Likert-type scale from 1 (never/disagree) to 5 (ever/agree). The thirty-one items of the original version assess seven factors. Three scales measure different feeding practices: Restriction (eight items) (e.g. I have to be sure that my child does not eat too much of her favourite foods), Pressure to Eat (four items) (e.g. My child should always eat all of the food on her plate) and Monitoring (three items) (e.g. How much do you keep track of the high-fat foods that your child eats?). The remaining four subscales assess parents’ perceptions of parental and children weight status and their concerns about it: Perceived Responsibility (three items) (e.g. When your child is at home, how often are you responsible for feeding her?), Parent Perceived Weight (four items) during her/his lifespan (e.g. Your adolescence), Perceived Child Weight (six items; according to participants’ age, the last three items were excluded) (e.g. Your child during the first year of life) and the last three items assess Parents’ Concerns about Child Weight (e.g. How concerned are you about your child eating too much when you are not around her?). The final score of each subscale is represented by the mean value of the items. The translation of the CFQ into Italian was carried out following the guidelines developed by the International Test Commission for back translations(Reference van de Vijver and Hambleton32). According to these guidelines, the CFQ was translated into Italian by a native English speaker and a native Italian speaker, separately. These two versions were independently backtranslated into English by two Italian expert scholars in English language and psychology. Discussion of differences in these four versions resulted in no changes. The final version was pilot-tested on thirty-five mothers of 6-year-old children. No specific problems emerged.
Anthropometrics measurements were recorded to the nearest 0·1 cm (heights) and 0·1 kg (weights). Two height and weight measures were averaged for each child. Age- and gender-specific BMI scores for each child were calculated and were classified as underweight, normal-weight, overweight and obesity categories using WHO standard criteria(29).
Statistical analyses
A confirmatory factor analysis (CFA) was performed to evaluate the factorial structure of the CFQ. Three different models were assessed referring to previous studies: (a) a seven correlated factors model in which all items were analysed (model 1); (b) a seven correlated factors model with composite items on the Restriction factor as suggested in the original work of Birch et al. (Reference Birch, Fisher and Grimm-Thomas11) (model 2). The composite items were computed by averaging item scores (RST1A, RST1B and RST1C into RST1; RST3A and RST3B into RST3; and RST4A and RST4B into RST4) and (c) an eight correlated factors model consisting of items RST3A and RST3B belonging to Reward factor, which was originally part of Restriction subscale (model 3). The eight-factor model was initially proposed by Corsini et al. (Reference Corsini, Danthiir and Kettler12) and was successfully confirmed by Schmidt et al. (Reference Schmidt, Richter and Brauhardt20). The significant change of the χ 2 (Δχ 2), the Root-Mean-Square Error of Approximation, the Comparative Fit Index and the Tucker–Lewis Index was used to judge the model’s goodness of fit. Value of Root-Mean-Square Error of Approximation lower than 0·08 and values of Comparative Fit Index and Tucker–Lewis Index higher than 0·90 were considered indicative of adequate fit(Reference Schermelleh-Engel, Moosbrugger and Müller33). Factor loading ≥0·30 was considered acceptable(Reference Brown34). Correlation effect sizes were interpreted according to Cohen(Reference Cohen35) with coefficients of 0·10, 0·30 and 0·50 representing small, medium and strong effect sizes, respectively.
After having found the model that fit the data better than the other models, in order to verify if the model was invariant across child BMI categories and gender, a Multi-Group CFA (MGCFA), namely, the analysis of measurement invariance of latent constructs, was carried out. By establishing whether factor loadings, thresholds and residual variances are equivalent in a factor model that measures a latent concept, we can assure that comparisons that are made on the latent variable are valid across groups. Establishing measurement invariance involves running a set of increasingly constrained structural equation models, and testing whether differences between these models are significant. Configural, weak (equal loadings), strong (equal loadings + thresholds) and strict (equal loadings + thresholds + residuals) invariances were sequentially tested(Reference Van de Schoot, Lugtig and Hox36,Reference Germani, Delvecchio and Li37) . Invariance was established when ΔComparative Fit Index < 0·010 and ΔRoot-Mean-Square Error of Approximation > 0·015(Reference Chen, Sousa and West38). To run CFA and MGCFA, a robust weighted least squares estimator and the theta parameterisation were used because the data were ordinal(Reference Millsap and Yun-Tein39).
Internal consistency was calculated based on Cronbach’s alpha(Reference Cronbach40). As reported by Vaske(Reference Vaske41), alpha values between 0·65 and 0·80 are often considered ‘adequate’ for scales adopted for research on human dimensions.
Multivariate ANOVA was performed with gender and BMI categories as between-subjects variables. Effect size was measured using partial eta-squares in which small, medium and large effects were 0·0099, 0·0588 and 0·1379, respectively(Reference Cohen42). Post hoc comparisons with Bonferroni’s method were carried out. In all analyses performed, significance requires P value < 0·05.
RStudio (version 1.0.143) and Statistical Package for Social Science (IBM SPSS version 21) were used for data analysis. Measurement invariance was carried out using the lavaan R-package(Reference Rosseel43).
Results
Confirmatory factor analysis
Table 1 shows goodness-of-fit indices comparing the three models. Although model 2(Reference Birch, Fisher and Grimm-Thomas11) and model 3(Reference Corsini, Danthiir and Kettler12) showed acceptable indices, model 3 outperformed both of the other models (Δχ 2 = 93·19; P < 0·001; 90 % CI Root-Mean-Square Error of Approximation < 0·080). Thus, model 3 was used in subsequent analyses. All items were loaded on the expected directions and were significant at P = 0·05. Most items displayed medium to high loadings ranging from 0·63 to 0·93. The lowest loading was found for item 25 (‘My child should always eat all of the food on his/her plate’ – Pressure to Eat), which was 0·37. Most of the correlations between factors were significant and of small to large size |0·06 < r > 0·54|.
Table 1 Factorial validity of Child Feeding Questionnaire (n 1253)
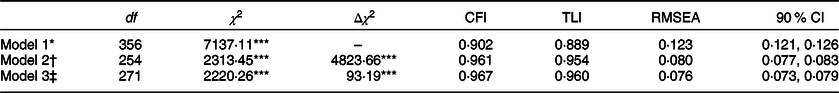
Δχ 2, change in χ 2 statistic between model and comparison model in the row above; CFI, Comparative Fit Index; TLI, Tucker–Lewis Index; RMSEA, Root-Mean-Square Error of Approximation.
* Seven correlated factors model in which all items were analysed.
† Seven correlated factors model with composite items on the Restriction factor.
‡ Eight correlated factors model consisting of items RST3A and RST3B belonging to Reward factor.
*** P < 0·001.
Multi-group confirmatory factor analysis
MCFA on model 3 confirmed the configural, weak, strong and strict invariances across BMI categories (underweight, normal weight, overweight and obesity) and gender (Table 2). Specifically, the configural model (M1) showed good fit indexes, suggesting that the factorial structure of the construct may be equivalent across groups. Weak invariance (M2) suggested that item loadings were not significantly different across groups. Strong (M3) and strict (M4) invariances indicated that thresholds and residual variances (i.e. errors) were similar across groups.
Table 2 Multiple group confirmatory factor analyses to test the measurement invariance of the Child Feeding Questionnaire across gender and across BMI categories (n 1253)
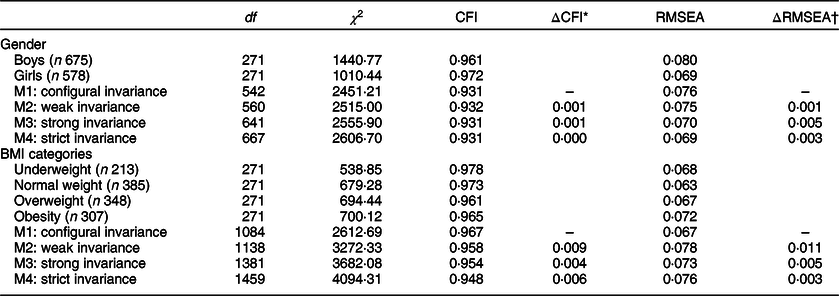
CFI, Comparative Fit Index; ΔCFI, Change in Comparative Fit Index between model and comparison model in the row above; RMSEA, Root-Mean-Square Error of Approximation; ΔRMSEA, Change in Root-Mean-Square of Approximation between model and comparison model in the row above.
* ΔCFI < 0·010.
† ΔRMSEA > 0·015 indicates invariance.
Internal consistency
Cronbach’s alpha for the CFQ was adequate for most of the subscales ranging from 0·65 to 0·87 (Table 3). Non-adequate (<0·65) values were found for the Pressure to Eat (0·50) and Restriction (0·53) subscales. Regarding the Pressure to Eat subscale, data showed an increase in Cronbach’s alpha (0·63) with the exclusion of item 28 (‘If I did not guide or regulate my child’s eating, he/she would eat much less than he/she should’). Looking at the Restriction subscale, internal consistency was reduced by the use of the three composite items, shifting from 0·53, (RST1: average of RST1A, RST1B, RST1C; RST2; and RST4: average of RST4A and RST4B) to 0·70 (RST1A, RST1B, RST1C, RST2, RST4A and RST4B).
Table 3 Means and standard deviations and internal consistency scores of the Child Feeding Questionnaire subscales
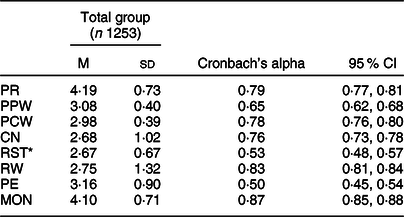
PR, Perceived Responsibility; PPW, Parent Perceived Weight; PCW, Perceived Child Weight; CN, Concerns About Child Weight; RST, Restriction; RW, Food as Reward; PE, Pressure to Eat; MON, Monitoring.
* Restriction subscale did not include the Food as Reward items.
Multivariate ANOVA
Multivariate ANOVA revealed a significant multivariate main effect for BMI categories (Wilks’ λ = 0·661, F (24,3591·18) = 22·96, P < 0·001, ŋ p 2 = 0·129) but not for gender (Wilks’ λ = 0·993, F (8,1238) = 1·02, P = 0·422, ŋ p 2 = 0·007) or for their interaction (Wilks’ λ = 0·980, F (24,3591·18) = 1·03, P = 0·426, ŋ p 2 = 0·007). The mean and standard deviation and the univariate main effects for BMI categories and gender are shown in Tables 4 and 5, respectively.
Table 4 Univariate main effects of BMI categories with means and standard deviations scores of the Child Feeding Questionnaire and associational estimates
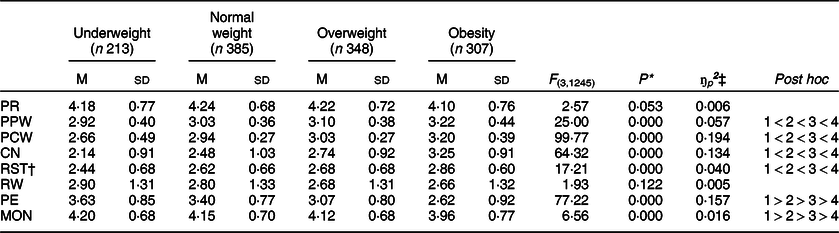
PR, Perceived Responsibility; PPW, Parent Perceived Weight; PCW, Perceived Child Weight; CN, Concerns About Child Weight; RST, Restriction; RW, Food as Reward; PE, Pressure to Eat; MON, Monitoring.
† Restriction subscale did not include the Food as Reward items.
‡ ŋ p 2 = partial eta-squares in which 0·0099 = small effect size; 0·0588 = medium effect size; 0·1379 = large effect size.
* P < 0·05 indicates significant differences among BMI categories.
Table 5 Univariate main effect of gender with means and standard deviations scores of the Child Feeding Questionnaire
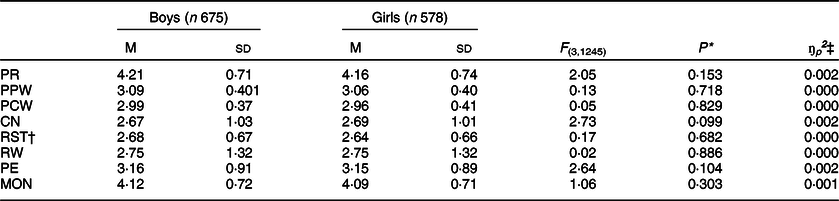
PR, Perceived Responsibility; PPW, Parent Perceived Weight; PCW, Perceived Child Weight; CN, Concerns About Child Weight; RST, Restriction; RW, Food as Reward; PE, Pressure to eat; MON, Monitoring.
† Restriction subscale did not include the Food as Reward items.
‡ ŋ p 2 = partial eta-squares in which 0·0099 = small effect size; 0·0588 = medium effect size; 0·1379 = large effect size.
* P < 0·05 indicates significant differences among BMI categories.
Looking at univariate main effects of BMI categories on CFQ variables, there were significant main effects for all the variables, with the exception of Perceived Responsibility and Food as Reward. Specifically, the effect size of these significant differences was as follows: small for Parent Perceived Weight, Restriction and Monitoring; medium for Concerns About Child Weight and large for Perceived Child Weight and Pressure to Eat.
Post hoc comparisons indicated that there were significant differences between the BMI categories for all the aforementioned CFQ variables. Specifically, Perceived Child Weight, Parent Perceived Weight, Concern and Restriction mean scores increased significantly throughout the four categories (i.e. from children with underweight to children with obesity). On the other hand, mean scores for Pressure to Eat and Monitoring increased from mothers with children with obesity throughout child BMI categories.
In line with Multivariate ANOVA results, no significant univariate main effect for gender was found (Table 5).
Discussion
The current paper sought to evaluate the psychometric characteristics of the CFQ in a large community sample of Italian mothers to add information regarding its structural validity and reliability. Moreover, for the first time, the CFQ measurement invariance across child BMI categories was shown. Furthermore, confirmation of the CFQ invariance across gender was obtained.
Regarding the factor structure of the CFQ, findings confirmed the eight-factor model with the Reward scale as the most accurate to fit the data. Our result was consistent with the model introduced by Corsini et al. (Reference Corsini, Danthiir and Kettler12) and replicated by Schmidt et al. (Reference Schmidt, Richter and Brauhardt20), advocating for the need to consider the Food as Reward as an eighth scale. However, although the current paper adds validity on its adequacy, as suggested by Corsini et al. (Reference Corsini, Danthiir and Kettler12), caution is required in its interpretation. Food as Reward includes only two items; thus, it might appear below the minimum threshold required for being considered a factor(Reference Kline44). The item PE25, belonging to the Pressure to Eat subscale, showed the lowest loading (PE25 = 0·37). Kong et al. (Reference Boles, Nelson and Chamberlin15) found similar results for African-American mothers (PE25 = 0·29). Furthermore, PE25 has been reported as the item less representative of the factor Pressure to Eat by several authors (e.g. Refs. (Reference Nowicka, Sorjonen and Pietrobelli4,Reference Birch, Fisher and Grimm-Thomas11,Reference Corsini, Danthiir and Kettler12,Reference Anderson, Hughes and Fisher16,Reference Liu, Mallan and Mihrshahi18)).
Although the CFQ was used to compare differences in child BMI levels (e.g. Refs. (Reference Schmidt, Richter and Brauhardt20,Reference Canals-Sans, Blanco-Gómez and Luque22)), to the best of our knowledge, none of them has been conducted to examine its measurement invariance across child BMI categories, despite that this step is necessary before cross-group comparison (e.g. Refs. (Reference Byrne, Shavelson and Muthén23,Reference Cheung and Rensvold45,Reference Vandenberg and Lance46)). This study is the first evaluating the CFQ factorial full-uniqueness invariance across child BMI categories involving a large and well-balanced number of children ranging from underweight to obesity. The CFQ was invariant across child BMI categories; these findings shed new light on the use of the CFQ. Birch et al. (Reference Birch, Fisher and Grimm-Thomas11) designed the CFQ mainly ‘to assess parents’ perceptions and concerns regarding child obesity’ (p. 202). However, findings from the current study provided evidence that the items were valid indicators of the underlying constructs and the factor structure was also the same in parents of children with underweight and with normal weight. Thus, the results allowed researchers to compare mean scores of different BMI categories confidently. Moreover, the eight-factor model measurement invariance across gender was replicated in the Italian sample, suggesting that the CFQ scales have the same meaning for boys and girls(Reference Schmidt, Richter and Brauhardt20).
In line with previous studies, the CFQ appeared as a reliable tool, with adequate levels of internal consistency for most of the scales(Reference Schmidt, Richter and Brauhardt20,Reference Canals-Sans, Blanco-Gómez and Luque22) . Pressure to Eat and Restriction showed no adequate Cronbach’s alpha. Focusing on Pressure to Eat, internal consistency increased after removing PE28. Although the translation of the CFQ into Italian followed the international guidelines and the pilot study did not evidence specific problems, this item included a double negative, which may make the translation unclear and less understandable. Therefore, before considering the exclusion of this item, further studies should be run. In addition, the inclusion of PE25 in this scale might also affect the internal consistency. Regarding Restriction, it reached acceptable value when the three composite items were excluded and replaced with the original ones, in line with Birch et al. (Reference Birch, Fisher and Grimm-Thomas11) and Schmidt’s et al. (Reference Schmidt, Richter and Brauhardt20) suggestions. The lower Cronbach’s alpha with the composite items could be explained by the fact that internal consistency is sensitive to the number of items per scale. The average inter item correlation per scale is a direct measure of internal consistency or cohesion(Reference Tang, Cui and Babenko47). Therefore, cohesion could be reduced because of the use of composite items. However, reliability of those two scales has already been recognised as problematic in previous studies, advocating for further research(Reference Kong, Vijayasiri and Fitzgibbon14,Reference Boles, Nelson and Chamberlin15) .
Referring to maternal feeding practices and child weight status, multivariate analyses of the CFQ scales confirmed the association between measured and perceived weight status with mothers reporting increased score on Perceived Child Weight according to child’s BMI categories(Reference Nowicka, Sorjonen and Pietrobelli4,Reference Birch, Fisher and Grimm-Thomas11,Reference Corsini, Danthiir and Kettler12,Reference Anderson, Hughes and Fisher16–Reference Liu, Mallan and Mihrshahi18,Reference Schmidt, Richter and Brauhardt20,Reference Canals-Sans, Blanco-Gómez and Luque22,Reference Kaur, Li and Nazir48) . Moreover, the current finding adds to Perceived Child Weight scale criterion validity(Reference Schmidt, Richter and Brauhardt20). Concern about Child Weight increased with child’s weight, in line with the literature(Reference Nowicka, Sorjonen and Pietrobelli4,Reference Birch, Fisher and Grimm-Thomas11,Reference Kong, Vijayasiri and Fitzgibbon14,Reference Canals-Sans, Blanco-Gómez and Luque22) . Mothers were likely to be more sensitive to present and future adverse effects on health linked to overweight and obesity in childhood. Furthermore, higher score on Perceived Parent Weight was found in mothers of children with higher weight status. Restrictive feeding practices were used more often by mothers of children with obesity, whereas Pressure to Eat was more frequent in mothers of children with underweight. Our findings replicated previous cross-sectional(Reference Camci, Bas and Buyukkaragoz17,Reference Schmidt, Richter and Brauhardt20,Reference Canals-Sans, Blanco-Gómez and Luque22,Reference Lorenzato, Cruz and Costa49) and longitudinal(Reference Afonso, Lopes and Severo50–Reference Haszard, Russell and Byrne52) studies that highlighted a link between specific controlling feeding practices and child BMI. Both the current and previous findings are far from explaining the causal direction of this relationship. Indeed, parents could not only implement specific feeding practices as a response to children’s weight status but also vice versa as suggested by Mitchell et al. (Reference Mitchell, Farrow and Haycraft53). Both types of excessive use of feeding control have been considered risk factors in the development of children’s problematic eating behaviours. As hypothesised by Jansen et al. (Reference Jansen, Roza and Jaddoe54), specific control feeding practices (i.e. Restrictive and Pressure to Eat practices) could influence children’s ability to self-evaluate and self-regulate hunger and, consequently, they could affect eating behaviours and child BMI. Future in-depth longitudinal studies on the goodness of the above-mentioned feeding practices in relation to obesity and underweight health risks are needed.
The current findings suggested that mothers of children with obesity referred more to Monitoring feeding practices than other mothers(Reference Geng, Zhu and Suzuki19,Reference Canals-Sans, Blanco-Gómez and Luque22) . In contrast with Schmidt et al. (Reference Schmidt, Richter and Brauhardt20), which showed the same levels of Monitoring for children with obesity and overweight children, in our study, mothers of children with overweight showed lower score in Monitoring than mothers of children with obesity, and similar levels to children with normal weight and with underweight. One possible explanation may be found in the underrepresentation of children with overweight compared with children with normal weight and obesity in Schmidt et al. (Reference Schmidt, Richter and Brauhardt20). The generalisability of characteristics of children with overweight might be incomplete in that study. A further reason may lie in the different age range considered since Monitoring practice was associated with child age(Reference Jansen, Tharner and van der Ende55). Focusing on 6-year-old children might be of core interest since it is between the ages of 5 and 6 years that Monitoring showed the strongest effect on child BMI(Reference Eichler, Schmidt and Poulain56). Before and after that time frame, it was child BMI that predicts Monitoring and there are stronger effects.
Regarding gender, the current study showed no significant differences between boys and girls. The findings replicated previous research on the topic, which showed no or marginal gender differences of parental feeding practices(Reference Anderson, Hughes and Fisher16,Reference Schmidt, Richter and Brauhardt20,Reference Kaur, Li and Nazir48) , but this finding was in contrast with that of Burton et al. (Reference Burton, Wilder and Beech57), which showed a gendered approach to caregiver feeding practices. Although Costanzo and Woody(Reference Costanzo and Woody58) emphasised the role of gender in the relationship between parental feeding practices and child BMI, as due to sociocultural pressure and body image ideals in girls, the current study did not confirm previous evidence about the interaction of gender and child BMI on parental feeding practices(Reference Corsini, Danthiir and Kettler12,Reference Mulder, Kain and Uauy59) . Italian mothers did not use specific feeding practices according to gender and child BMI categories.
The current study is not without limitations. The major concern is the sample. The data referred to a single source (mother reported) and surveys were collected only in 1st grade elementary schools in Central Italy. The generalisability of results is limited, and replication studies with different samples are highly recommended for future research, also taking into account some factors that might shape parents’ perceptions and parental feeding practices as suggested by several studies(Reference Birch10,Reference Camci, Bas and Buyukkaragoz17,Reference Anzman, Birch and Rollins60) , such as parental weight status, culture/ethnicity, educational and socio-economic levels, and psychological factors. Thus, despite the above-mentioned limitations, this is the first validation of the CFQ assessing its structural validity and reliability in the Italian population. A major strength of the current work is the evaluation of measurement invariance of the CFQ across four categories of child weight, which has never been carried out before. Moreover, this study allowed confirmation of the CFQ measurement invariance in boys and girls. Other study strengths encompass the objectively measured child BMI category (i.e. underweight, normal, overweight and obesity) and the inclusion of balanced weight and gender samples. The present study might inform professionals and researchers on the use of the CFQ as a valid and reliable tool, which is able to distinguish different feeding practices according to child’s weight not only in overweight and obesity but also in mothers of children with underweight and normal weight. Considering the bidirectional relationship between parental feeding practices and child BMI and that feeding practices are modifiable, this instrument may be a measurement tool to assess these parental factors, which seem to expose children to developing unhealthy feeding patterns during their first years with consequent risk of developing weight problems in later years. Thus, the CFQ may be used to implement targeted interventions in both clinical and preventive care.
Acknowledgements
Acknowledgements: The authors are extremely grateful to Dr Roberto Pippi, Dr Claudia Ranucci and all the professionals for their help in data collection. Moreover, the authors wish to thank all families who have taken part at the Region Umbria Prevention Plan 2014–2018 project ‘Improving Umbrian kids’ healthy lifestyle’. Financial Support: This research received no specific grant from any funding agency, commercial or not-for-profit sectors. Conflict of interest: The authors declare no conflict of interest. Authorship: L.B. and C.M. were involved in all stages of the project and supervised the data collection. L.B. and E.D. conceptualised the research question and drafted the manuscript. E.D. and A.G. performed data analysis and wrote the Method and Results section. C.M. provided critical review of the manuscript. All authors reviewed and contributed to the intellectual content of the manuscript, read and approved the final manuscript. Ethics of human subject participation: This study was conducted according to the guidelines reported in the Declaration of Helsinki, and all procedures involving study participants were approved by the by the Bioethical Committee of The University of Perugia (CEAS Umbria Region, HREC n. 1/10/1633). Written informed consent was obtained from all subjects/patients.


