


Self-reporting (e.g. electronic or paper-and-pencil food diary, 24 h dietary recall, FFQ) is the most common method of dietary assessment( Reference Block 1 – Reference Subar, Crafts and Zimmerman 5 ). Although this approach is used widely in large cohort studies, its accuracy is limited by its dependence on the willingness of the participant to report and his/her ability to estimate accurately the amount of food consumed( Reference Rumpler, Kramer and Rhodes 6 – Reference Barrett-Connor 8 ). To improve assessment accuracy, various portion size measurement aids are employed, including pictures (two dimensions) or realistic models (three dimensions) of objects of known sizes (e.g. a life-size picture of a tennis ball or a real tennis ball)( Reference Cypel, Guenther and Petot 9 – Reference Byrd-Bredbenner C & Schwartz 12 ). With the help of portion size measurement aids, an individual's ability to estimate portion size can be improved significantly, especially after training( Reference Arroyo, de la Pera and Ansotegui 13 – Reference Slawson and Eck 16 ). However, the ability of portion size measurement aids to improve accuracy varies with food models, training methods, food type and study population( Reference Arroyo, de la Pera and Ansotegui 13 – Reference Foster, Adamson and Anderson 25 ). For example, Lanerolle and co-workers developed models specifically for Asian foods (e.g. rice, noodles)( Reference Lanerolle, Thoradeniya and de Silva 21 , Reference Thoradeniya, de Silva and Arambepola 22 ). Yuhas et al. compared estimation accuracies among solid foods, liquids and amorphous foods using portion size measurement aids. They concluded that errors were smallest in solid foods and largest in amorphous foods( Reference Yuhas, Bolland and Bolland 23 ). Foster et al. showed the importance of using age-appropriate food photographs for studies in children( Reference Foster, Matthews and Nelson 24 , Reference Foster, Adamson and Anderson 25 ). Regardless of these findings, the accuracy of dietary assessment methods still highly depends on the individual's ability to estimate portion size accurately.
Recently a picture-based method for dietary analysis has been reported that uses camera-enabled mobile phones or tablet computers to record pictures of consumed foods and beverages. Pictures are acquired by the participant before and after meal and snack consumption. Food volume is then estimated from the pictures, and converted to energy and nutrient values using a nutritional database( Reference Subar, Crafts and Zimmerman 5 , Reference Martin, Kaya and Gunturk 26 – Reference Zhu, Bosch and Woo 31 ). Compared with the method of employing portion size measurement aids, the picture-based method provides more objective estimation of portion size. However, it requires the willingness of the participant to take pictures at each eating event. Hence, the food intake record may be incomplete if the participant forgets or ignores picture taking, especially when a meal involves multiple courses of foods and when picture taking disrupts his/her normal social interaction during eating. To resolve this issue, we developed a wearable device (‘eButton’) that automatically takes pictures at a pre-set rate without interrupting the participant's eating behaviour. eButton is convenient to use, since the wearer only needs to turn it on and off. However, an important question is whether eButton pictures (which are two-dimensional) can provide accurate food volume (i.e. three-dimensional (3D)) estimates. In the present study we therefore compared food volumes estimated from eButton pictures with actual volumes measured using a seed displacement method( Reference Sahin and Sumnu 32 , Reference Cauvain and Young 33 ). A few picture-based studies have attempted to analyse volume measurement error, but the food samples used in these studies were limited to those with standard volumes or volumes that could easily be measured by water displacement (e.g. solid fruits)( Reference Zhu, Bosch and Woo 31 , Reference Jia, Yue and Fernstrom 34 ). In this experiment, we studied real foods prepared or purchased by study participants and consumed at lunch break in the lab (see Fig. 1). The volume of each food item was first measured using the seed displacement method (see ‘Experimental methods’ section and online supplementary material) and then calculated using a software program from eButton images acquired during lunch. Different from water displacement, seed displacement involves no liquids and thus permits volume measurements of a wide variety of foods. For example, an airtight waterproof enclosure is required for measuring hamburgers with water displacement; yet controlling the amount of sealed air appropriately is more difficult. To validate further the accuracy of our software for volume estimation, we recruited three human raters to estimate the volume of each food sample by observing the same eButton-acquired pictures.

Fig. 1 (colour online) (a) eButton Prototype; (b) a person wearing an eButton during eating
Experimental methods
Overview
The study was approved by the University of Pittsburgh Institutional Review Board and conducted in our laboratory. Participants were recruited from members of the laboratory. Trials were run on weekdays between noon and early afternoon, when lab members ate lunch. There were no restrictions on the types of food, except for those that could not be measured accurately using seed displacement or changed shape quickly (e.g. leafy salad, ice cream). Before each trial, the volume of each food item was measured by the seed displacement method( Reference Sahin and Sumnu 32 ) and then placed on a provided plate. The food items were then returned to participants who ate lunch normally while wearing an eButton pinned chest-level on the shirt (Fig. 1).
Recording device: eButton
The eButton was constructed in our laboratory and used to obtain objective information about the wearer's food intake( Reference Jia, Yue and Fernstrom 34 – Reference Yue, Jia and Sun 46 ). By adjusting the tilt angle of the camera on the device, it can easily capture the wearer's eating activity under common eating environments. The devices used in the present experiment took pictures every 2 to 4 s. Recorded images were automatically saved to a micro SD (Secure Digital) card in the device and later uploaded to a computer (in the same manner as uploading images from a digital camera). Food items in the images were then identified manually and their volumes calculated by software( Reference Chen, Jia and Li 39 , Reference Jia, Yue and Fernstrom 40 ).
Participants
Seven lab members (five males and two females, age 27–37 years) were recruited as participants. They received instruction on how to operate the eButton before the study. There were no inclusion/exclusion criteria.
Food samples
Food items were purchased or prepared at home. Purchased foods were obtained from fast-food restaurants or grocery stores, while the home-prepared foods were made according to the participant's habit. The cost of the purchased foods was reimbursed to the participants. After the food consumption, if there was significant leftover (in the present study, more than one-third of the original amount), it was measured again using seed displacement and considered as a new food sample. To minimize repetitive use of the same foods, a list of the foods studied was posted and updated every day. Participants were asked to choose foods based on this list. If several foods were included in one meal, each item was placed on a separate plate, measured and consumed separately.
One hundred and five real food samples, including Asian and Western foods, were examined. Of these samples, five were excluded from analysis, because only part of the food was captured in the images or the food's shape was altered during experimental handling. The details of the foods are listed in Tables 1 and 2. Seventy-eight foods were amorphous in shape, while twenty-two were solid. Liquids were not included in the present study.
Table 1 Details of Western foods in the present study
Table 2 Details of Asian foods in the present study
Study protocol
Before each measurement, the food sample was wrapped with self-clinging plastic food wrap (Kirkland Signature, Costco) and its volume measured using a validated seed displacement method (see online supplementary material). The seed used in our study was millet seed, a hard, tiny yellow seed with a nearly spherical shape. Wrapping prevented small seeds from becoming trapped in the food, and was as tight as possible. After volume measurement, foods were unwrapped and returned to the participant. He/she wore an eButton on his/her chest while eating the food(s). The eButton was programmed to take a picture every 2 s. As a result, a sequence of pictures was acquired as each food sample was consumed (e.g. 300 pictures for a 10-min eating episode).
Computer-calculated food volume from eButton pictures
After an eating event was completed, eButton images were uploaded to a desktop computer. A self-developed algorithm was then executed to evaluate the quality of the pictures; blurred images were removed automatically( Reference Li, Wei and Sclabassi 41 ). The remaining pictures were manually reviewed using a finger-operated browser on a 22-inch multi-touch screen. One picture was selected for portion size estimation of the food sample. In general, 10 s or less was required to identify a good picture from the acquired image sequence (since a good image was usually found in the first several pictures examined). A self-developed image undistortion algorithm was then applied to the selected picture( Reference Li, Sun and Chen 42 ). The undistortion procedure was necessary because the distance between the food on the table and the chest-worn eButton could be very short (15 cm or less was not unusual when the participant was seated at the table; see Fig. 1(b)). To capture complete food images at such a short distance, a wide-angle lens was required, but produced significant image distortion. The undistortion algorithm corrected this distortion.
Once food pictures were selected and undistorted, a virtual shape method was utilized to measure portion size (volume)( Reference Chen, Jia and Li 39 , Reference Zhang 43 ). In this method, a shape model library was developed that contained common food shapes (e.g. an ellipsoid/sphere, a cap of an ellipsoid/sphere, a cuboid, a truncated cone, a sector of cylinder, a half-tunnel, an irregular 3D shape that could be defined interactively (see the selection menu in Fig. 3)). During measurement, a particular 3D shape model was manually chosen from this library and adjusted in location and size over the image displayed on the computer screen until the model covered the food item as closely as possible. A user-friendly interface for manipulating shape models and estimating food volumes was developed to facilitate this task (see Figs 2 and 3 ( Reference Chen, Jia and Li 39 , Reference Chen, Jia and Yue 44 )). The volume of the food item was then estimated by a computer program using the volume of the fitted model. The process from choosing a model to finish fitting usually takes less than 15 s.
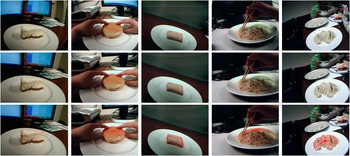
Fig. 2 (colour online) First row: typical food pictures acquired by eButton; second row: pictures after undistortion; third row: food items fitted with wire meshes. The shape model in each picture (from left to right) is a sector of cylinder, a cylinder, a cuboid, a spherical cap and an irregular shape, respectively
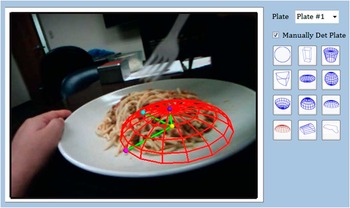
Fig. 3 (colour online) Part of the software interface for portion size estimation. The wire frame in the picture represents the selected shape model and the four dots represent the control points that can be dragged to adjust the size and location of the model. The right part of the menu shows the shape model library
A referent placed into the imaging field is necessary to obtain the actual size of the object being photographed. Black-and-white checkerboards of known dimensions have typically been used as referents in image-based dietary studies( Reference Subar, Crafts and Zimmerman 5 , Reference Weiss, Stumbo and Divakaran 27 , Reference Lee, Chae and Schap 30 , Reference Zhu, Bosch and Woo 31 ). However, such referents are inconvenient, because the participant must remember to place it next to the food(s) being imaged. Since a circular plate or bowl is commonly used at home and in restaurants, we developed a method using a circular dining plate as a referent( Reference Jia, Yue and Fernstrom 40 , Reference Yue, Jia and Fernstrom 45 ). In this case, the dimensions of the plate or bowl (diameter and depth) provide the information to calculate a food's dimensions in the image. Plate dimensions can be obtained before or after the dietary study. With the plate size known, its deformed shape in the picture (usually an ellipse) can be utilized to estimate the 3D localization of the food with respect to the position of the camera. Based on such estimates, the correspondence between the real-world spatial points and picture points (pixels in the image) can be established mathematically( Reference Yue, Jia and Fernstrom 45 , Reference Yue, Jia and Sun 46 ) and allows food volume to be determined. Strictly speaking, this determination is only an estimate, since, by theory, a single picture does not provide complete 3D information. However, an estimate is possible when the shape of a 3D object is assumed, which is provided by the 3D shape models described above.
Visually estimated food volume from eButton pictures
Three raters (one dietitian, one volunteer and one lab member) were recruited to estimate the portion size of each food sample via observing the same eButton pictures used by the computer to estimate volume. Raters were not familiar with the study and were unaware that food volumes in the images had been estimated by other procedures. Two Excel® spreadsheets showing the 100 food pictures were sent to each rater by email. The parameters (diameter, depth) of the plate present in each picture were included in one spreadsheet, but not the other. The raters were asked to first provide volume estimates from the pictures without parameters and then re-estimate with parameters. They estimated the volume in either cups or cubic centimetres according to their own preference. Actually the dietitian used cups while the other two raters used cubic centimetres.
Data analysis
In the present study, for each food item, the measured volume using seed displacement was considered as the gold standard against which to compare the accuracy of computer-based and human estimation. Statistical comparison of these methods was performed using MedCalc version 9·5·0·0 assuming that each picture was independent of the others.
For each food sample, besides the actual volume measured with seed displacement, its volume was also estimated using our computer software and visual inspection of the images by the raters. Because each rater estimated volume both with and without knowledge of plate size, six estimates were generated for each sample (hence, a total of eight measurements for each sample). The relative error of each estimate was defined as the difference between the estimated value relative to the gold standard, i.e. [(estimated – gold standard)/gold standard] × 100 %. The relative error for all the food samples formed a test set. Totally seven test sets were obtained and compared. For each set, mean, standard deviation and other statistical parameters of all relative errors were calculated as measures of accuracy. The box-and-whisker plot was used to qualitatively illustrate the difference of the relative errors among different sets without making any assumptions on the underlying statistical distributions of the errors. The Bland–Altman plot was also used to further examine the agreement between each test set and the gold standard. The horizontal axis of the Bland–Altman plot represents the average of the volumes measured using seed displacement and the test method. The vertical axis represents the difference between these two measurements expressed as percentages of values on the horizontal axis, i.e. [(estimated – gold standard)/(estimated/2 + gold standard/2)] × 100 %.
Results
In the present study, the food samples were consumed at seven locations in our laboratory, including offices, cubicles, a conference room table, and a dining table in the common area of a mini kitchen. The mean of all true food volumes was 294 (sd 153) cm3 (range: 30 cm3 to 740 cm3). Six plates were chosen, with diameter ranging from 23 cm to 27·9 cm. The distance between the camera and the centre of the plate was calculated using our software. The average distance was 14·5 (sd 2·2) cm, ranging from 9·6 cm to 24·9 cm. Two raters estimated the volumes of 100 food samples, but one rater (R1 in Table 3, Figs 5 and 6) only estimated ninety foods.
Table 3 Comparison of relative error between the different measurement methods
*Score: (the number of food items with less than 30 % error)/(the total number of estimated foods).
†R1, R2 and R3 represent the three raters, respectively.

Fig. 5 (colour online) Box-and-whisker plot of relative errors for all the test sets. On each box, the central line represents the median of the relative errors over all the food samples. The bottom and top edges of the box are respectively the first and third quartiles, which is the interquartile range (IQR). The extreme regions (with a greater distance from the median than 1·5 times the IQR) are the ends of the lines extending from the IQR. Points outside this region are plotted individually as asterisks, representing potential outliers. R1, R2 and R3 represent the three raters. R1 provided estimates for ninety foods, while R2 and R3 provided 100 estimates

Fig. 6 (colour online) Bland–Altman plots showing the percentage difference between the gold standard and test methods. Please note that ordinate scales differ among the plots. Computer-calculated volumes and the volumes estimated by three raters (R1, R2 and R3) with/without known plate parameter are compared with the seed displacement method (gold standard). The horizontal axis represents the average of the volumes measured by seed displacement and the test method in cubic centimetres. The vertical axis represents the difference between these two measurements expressed as percentages of the values on the horizontal axis. The two dotted lines close to the mean are the 95 % confidence interval of the mean percentage difference. The two outer dashed lines are the limits of agreement, which are defined as the mean difference plus and minus 1·96 times the standard deviation of the difference
Table 3 compares the mean and sd of the relative error and 95 % CI of the mean for each test set. For the computer-based method, the mean relative error over all of the samples was −2·8 % (95 % CI −6·8 %, 1·2 %) with sd of 20·4 %. The score listed in Table 3 represents the number of foods whose volume estimates fell into the range of (−30 %, 30 %). When compared with the score of the computer-calculated group (85 %), the scores of other groups were smaller. Figures 4(a) and 4(b) show the relative errors for the Western and Asian foods, respectively. It can be seen from Fig. 4 that the foods with volumetric errors larger than 30 % include nine Western foods and six Asian foods, such as steak, pork rib, potato salad, chicken tenders or nuggets, spring roll and dumpling.
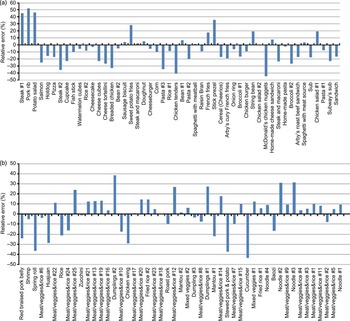
Fig. 4 (colour online) Calculated volumetric errors of: (a) Western food samples arranged in the ascending order of volume; (b) Asian food samples arranged in the ascending order of volume. The number of food items is fifty for Western food and Asian food samples, respectively
Figure 5 depicts the distributions of the relative errors for the seven sets using box-and-whisker plots. The central line is the median, and the top and bottom edges of the box show the first and third quartiles, defined as the interquartile range. The computer-calculated set has the median value closest to zero and the narrowest interquartile range, indicating that this estimation method has the least variability.
To compare these different methods further, Bland–Altman plots were used to calculate the mean difference (i.e. bias and limits of agreement) between the estimated volume from each method and the gold standard (i.e. seed displacement). The mean difference in the Bland–Altman plot for computer-based measurements was −5·0 % (95 % CI −9·2 %, −0·79 %) with sd of 21·1 %. The mean of the best estimation from the raters was −15·5 % (95 % CI −23·7 %, −7·3 %) and the sd was 41·4 %. The worst mean was −78·8 % (95 % CI −89·0 %, −68·7 %) with sd of 51·2 %. From these Bland–Altman plots, it can be observed that the computer-based method has the least bias and best agreement with the gold standard (see Fig. 6).
Discussion
It is generally accepted that accurate dietary assessment under free-living conditions is a challenging problem. In our study, we developed a semi-automatic data analysis method for estimating food portion size from the images acquired by a wearable camera. Images of 100 food samples (fifty Western and fifty Asian foods) were collected when participants wore the camera while eating lunch in our laboratory and processed. These images were also sent to three raters who visually estimated food volume in each picture. Seed displacement was utilized as the gold standard to physically measure food volume and compared with image-based measurements. Our results demonstrated that, for most samples studied, food volumes can be calculated from images with a much improved accuracy compared with visual estimates. Therefore, our eButton and virtual shape-based method provide a more objective and accurate measure of food quantity with much reduced respondent burden on research participants.
There are two critical issues in image-based dietary assessment. One is accurate portion size estimation, addressed in this work; the other is correct identification of foods. Despite recent advances in automatic food identification, the complexity of most prepared foods renders their correct identification and ultimate composition problematic. In many cases, it is impossible to determine a food or beverage from an image. Fortunately, participants can usually identify recently ingested foods when a picture is presented with the time/location information. A recent study has demonstrated that, even for adolescents, familiar foods can be correctly identified with the help of an image of their meal up to 14·5 h postprandial( Reference Schap, Six and Delp 47 ). Thus, it appears necessary for participants to be involved in a portion of the food identification process (after the fact). With current mobile technology, eButton pictures can be easily sent to the participant's mobile phone or displayed at a website. Thus the time demand for food identification is minimal. This approach should thus provide a very reliable approach for accurately assessing food intake.
A direct comparison of the accuracy between our work and that of other studies is not appropriate, since the gold standard and error calculation methods vary among studies. For example, in Martin's studies( Reference Martin, Correa and Han 29 , Reference Martin, Han and Coulon 48 ), participants were trained to take food pictures with mobile phones at a specific distance and angle. By observing these pictures, trained dietitians estimated the portion size of each food by comparing it to a large database of food pictures with standard portion. Then, the weight, energy and nutrient contents were calculated based on a dietary database. Next, the calculated energy intake was compared with an objective measurement (e.g. weighing or doubly labelled water method). In another study, each participant was asked to keep a detailed food diary for one day while wearing SenseCam, a wearable camera developed by Microsoft. The SenseCam images were then reviewed together with the participant to modify his/her diary. The energy intakes based on the food diary alone and the food diary in conjunction with SenseCam were compared( Reference O'Loughlin, Cullen and McGoldrick 49 ). Still other studies used images of food replicas or real foods with simple shapes that were obtained under well-controlled environmental conditions (e.g. optimal distance, absence of motion, good lighting). Unlike these strategies, we focused on portion size estimation only and compared food volumes as estimated by computer, human rater and seed displacement.
In our study, the error calculated by the computer software was still large for some food items (see Fig. 7 for examples). After studying this problem carefully, we found a number of possible causes, such as an unfavourable observation angle which did not allow a full observation of the food shape, a lighting environment that created artifacts and/or shadows, and a complex food shape that cannot be fit by any of the available shape models. Many of these causes may be eliminated or alleviated by utilizing a sequence of images recorded by eButton instead of a single snapshot image and by improvements of the image processing algorithms. We are currently investigating these possibilities.

Fig. 7 (colour online) Examples of food pictures with relatively big errors
When eButton and computer-calculated volume estimation are applied in a dietary study, two practical problems must be considered. First, a reference has to be present in the picture to provide a scale for volume estimation. When a circular plate is not available, other objects with known shape and size (e.g. food tray, rectangular-shaped container) can be used as a reference. Second, for a great number of foods, a volume-to-weight conversion must exist in the database employed (e.g. Nutrients Database for Dietary Studies (FNDDS)) to obtain energy and nutrients( 50 ). Currently, the energy and nutrient contents of approximately 75 % of the foods in FNDDS can be retrieved according to volume measures (e.g. cup, teaspoon, tablespoon, cubic inch). Another 20 % of the foods have countable measures (e.g. one roast beef sandwich). It is expected that the percentage of foods reported in volume units will increase as image-based dietary studies become more popular.
In addition to portion size estimation, applying the wearable eButton to dietary studies can also provide information about overall daily eating behaviour. With additional sensors (e.g. motion, light, global positioning system sensors) within eButton, the participant's eating environment can be recorded. Since each eButton picture and sensor data are continuously recorded with a time-stamp, this approach will provide information about when, where and how the individual consumes foods and beverages as a part of his/her normal daily activities. As such, it may be useful in gaining a better understanding of the role of eating behaviours in the aetiology of diet-related diseases( Reference Yuasa, Sei and Takeda 51 – Reference Mayer 54 ).
Acknowledgements
Sources of funding: This work was supported by National Institutes of Health (NIH), grant numbers U01HL91736 and R01CA165255. NIH had no role in the design, analysis or writing of this article. Conflicts of interest: None to declare. Ethics: This study was approved by the University of Pittsburgh Institutional Review Board. Authorship responsibilities: W.J. was responsible for data collection, analysis and drafting of the study. H.-C.C., Y.Y. and Z.L. contributed to the algorithms and interface for data analysis. Y.B. and C.L. designed and constructed the prototype of the eButtons used in this experiment. J.F. supervised the experiment design and data analysis. M.S. designed the experimental method and provided guidance for the experiment procedure. M.S., J.F. and W.J. contributed to final editing of the manuscript. Acknowledgements: The authors gratefully acknowledge the helpful comments on experimental design from Dr Lora E. Burke and Leah M. McGhee. The authors would also like to acknowledge the participants and experimental result evaluators for their significant contributions to this research study.


