


South Africa is a country that is characterised by a wide diversity of cultures and a vast range of public health issues. Such health issues are associated with infectious and chronic diseases, rapid urbanisation, lifestyle factors and the adoption of a Western type of diet(Reference Bradshaw, Groenewalt and Laubscher1, Reference Charlton, Brewitt and Bourne2). Furthermore, many South Africans do not know how to choose the right type and quantities of food to satisfy their nutritional requirements(Reference Spowart3). Therefore, there is a need to help South African consumers make better food choices during food purchasing.
The food label forms an integral part of the consumers’ decision-making processes, as it provides nutritional information that could assist them in making healthy food choices(Reference Charlton, Brewitt and Bourne2, Reference Jones and Richardson4). Prior exposure to food labels also limits consumers’ information searching and consequently saves them time during food purchase(Reference Grunert and Wills5). Previous research has found that consumers tend to read the information that is supplied on food labels without really understanding it, which limits the effective use of food labels(Reference Higginson, Rayner and Draper6).
At present, although food labels offer consumers more complete, useful and accurate information than ever before(7), some research studies state that food labels contain too much information, which makes it difficult for consumers to understand them(Reference Jones and Richardson4). In addition, food labels are also viewed by consumers as mere marketing ploys, rather than a means by which to communicate the quality of, or nutritional information about, the product(Reference Coveney8). At the time of the present study, the food-labelling regulations(9) of South Africa (in terms of the Foodstuffs, Cosmetic and Disinfectant Act 54 of 1972) were being reviewed. Such regulations are aimed at preventing the provision of false or misleading information on food labels(Reference De Villiers10). Such a measure is intended to regulate the precise conditions that control the wording to be used on food labels, as well as to mandate which information, such as the name, the use-by date, the ingredient list and the possible causes of allergies, should be included on the labels(Reference De Villiers10). The draft food-labelling regulations have been viewed by consumer groups and dietitians as indicating the progress that has been made towards encouraging a healthier nation(Reference Comins11). However, food labelling can only assist in guiding consumers in making appropriate food choices and does not, by itself, ensure a better understanding of nutritional principles or skills which would facilitate the use of the information provided(7, Reference Levy and Fein12, Reference Alfieri and Byrd-Bredbenner13).
In order to ensure effective food choices, consumers need to understand the information that is supplied on food labels. However, several studies have found that consumers tend to experience difficulties with understanding the nutritional information supplied on labels, especially due to the relatively complex terminology that is used in the wording of such labels(Reference Shine, O’Reilly and O’Sullivan14–Reference Peters-Texeira and Badrie17). Such a problem was also found to exist in South Africa in a study that investigated consumers’ perceptions of food labels and how such perceptions influenced their purchasing behaviour(Reference Klein18). The participants were recruited mainly from selected supermarkets in Potchefstroom, which is located in the North West Province of South Africa. The consumers interviewed were found not to understand the terms and abbreviations used on food labels, and showed their need to be educated regarding the reading and interpretation of information on food labels(Reference Klein18).
Previous studies also found that those consumers who frequently use food labels tend to be educated women(Reference Cowburn and Stockley16, Reference Neuhouser, Kristal and Patterson19, Reference Satia, Galanko and Neuhouser20) of a relatively high socio-economic class(Reference Cowburn and Stockley16, Reference Wang, Fletcher and Carley21, Reference Hess, Yanes and Jourdan22), who have a greater awareness of health than do other consumer groups(Reference Cowburn and Stockley16, Reference Neuhouser, Kristal and Patterson19, Reference Satia, Galanko and Neuhouser20, Reference Szykman, Bloom and Levy23, Reference Nayga, Lipinski and Savur24). Female consumers’ use of food labels has been the focus of many previous studies, as such consumers were, in the past, generally considered to be the gatekeepers of the household’s food choices and purchases(Reference Alfieri and Byrd-Bredbenner13, Reference Anderson and Coertze25, Reference Wiles26). However, over the years, changes in gender roles and household responsibilities have become evident(Reference Nayga, Lipinski and Savur24, Reference Fuller27), leading to the need to include consideration of how male consumers understand and use information on food labels in food-labelling studies.
To illustrate consumers’ understanding and use of information on food labels, the conceptual frameworks of Balasubramanian and Cole(Reference Balasubramanian and Cole28), Drichoutis et al.(Reference Drichoutis, Lazaridis and Nayga29) and Gracia et al.(Reference Gracia, Loureiro and Nayga30) were adopted. Such frameworks were used to develop a decision-making framework for use in the present study (Fig. 1). Consumers’ decision making entails the processes that influence their product choices when multiple options are available, and how the information that is available for each alternative choice might affect their product choice(Reference Schiffman and Kanuk31). Therefore, when consumers experience a specific need, or are motivated to purchase a certain food product, both the information that is given on the food label and the consumer’s evaluation thereof are likely to influence their decision to purchase the product. The higher the consumer’s perceived health risk that is associated with the use of the product, the more involved the consumer is likely to be in the search for, and evaluation of, product information(Reference Schiffman and Kanuk31). This implies that consumers differ in their motivation to search for or to use the information that is supplied on food labels.
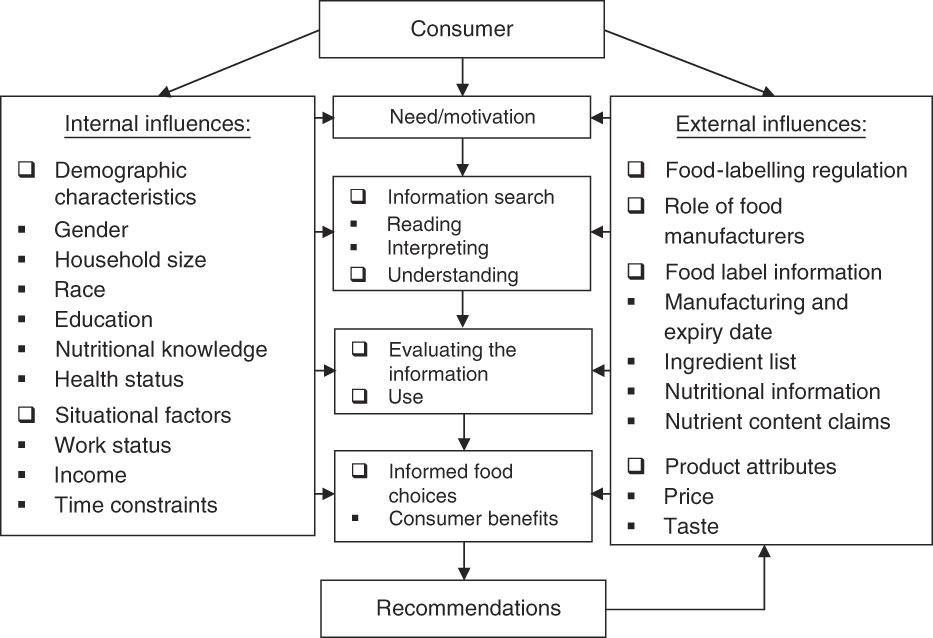
Fig. 1 Conceptual framework of consumers’ understanding and use of information on food labels, as derived from Balasubramanian and Cole(Reference Balasubramanian and Cole28), Drichoutis et al.(Reference Drichoutis, Lazaridis and Nayga29), Gracia et al.(Reference Gracia, Loureiro and Nayga30) and Schiffman and Kanuk(Reference Schiffman and Kanuk31)
Consumer searching for information on food labels could either be active or accidental(Reference Grunert and Wills5), although such searching is affected by the extent to which they understand the information. The extent to which consumers understand the information that is supplied on food labels is dependent on their cognitive abilities to read and interpret the information on the concerned labels(Reference Cowburn and Stockley16). However, the subjective and objective understanding of consumers differs. In contrast to subjective understanding, which is the consumers’ own perception of the meaning of information, objective understanding refers to the consumers’ interpretation of the information in relation to what was intended by the sender(Reference Grunert and Wills5). Nevertheless, consumer understanding of the information provided determines how, and whether, the information on food labels is used when choosing which food products to purchase. Furthermore, consumer use of food labels specifically refers to their reading, interpretation and evaluation of the information that is supplied on food labels, which also helps to determine the importance that consumers accord to such information.
Both the external influences (in terms of the food-labelling regulation, the role of food manufacturers, the food label information and the product attributes) and the internal influences (in terms of the demographic characteristics and situational factors) on the understanding and use of information on food labels are included in Fig. 1. The external influences were included due to their role in determining the information provided on food labels(Reference Balasubramanian and Cole28), and internal influences that lie within the consumer were also considered. Both the external and internal influences directly affect consumers’ understanding and use of food label information, as well as, ultimately, their ability to make informed food choices.
The present study investigated adult consumers’ understanding of the information on food labels, and determined whether such consumers use the information on food labels to choose which food products to purchase. Despite the need for such research, little has been undertaken in South Africa into such an issue. Such a need exists, especially in the light of the scant knowledge among consumers about how to make healthy food choices(Reference Spowart3), and given the draft amendment to the current food-labelling regulations. Therefore, the study’s objectives were to identify which information supplied on food labels is used by consumers and what difficulties such consumers experience when using food labels, after which their reasons for not using food labels were explored. The relationship between consumers’ understanding of the information supplied on food labels and their ability to make informed food choices was also investigated. Identifying difficulties in consumers’ use and understanding of food labels is essential for making appropriate recommendations to food label regulators and manufacturers regarding consumers’ needs in terms of food labels.
Methods
Research design and sampling
A cross-sectional and descriptive research approach was followed in the present study. The study was conducted in two neighbouring cities, Klerksdorp and Potchefstroom, which are located in the North West Province of South Africa. Potchefstroom is known for its academic environment, while the community in Klerksdorp is associated more with mining(32). The use of these two cities increased the socio-economic diversity of the target population. A stratified and judgemental sampling method was used to choose a representative sample, consisting of male and female consumers of African descent, as well as Caucasian consumers, who were ≥18 years of age. Only those consumers who purchased household food products were included, as such consumers were exposed to food labels when purchasing food.
A proportional stratified sample was obtained by formulating stratum fractions according to location, race and gender (Table 1), using census data provided by Statistics South Africa(33). The sample contained the following profiles: 28 % (amounting to forty-nine respondents) and 72 % (amounting to 125 respondents) of the respondents were drawn from Potchefstroom and Klerksdorp, respectively (Table 2).
Table 1 Outcomes of census of Potchefstroom and Klerksdorp, according to location, gender and race(33)
Table 2 Demographic details of respondents from Potchefstroom and Klerksdorp included in the sample
Data collection
Supermarkets were chosen as the appropriate site for data collection, since the consumers who buy from such stores tend to encounter food labels during the purchase of food products(Reference Shine, O’Reilly and O’Sullivan14). Specifically, three different supermarket chain stores were used, as such supermarkets comprise 80 % of the supermarket sector in South Africa(Reference Weatherspoon and Reardon34). A telephone directory was used to compile a list of all such supermarkets that were located in the Potchefstroom and Klerksdorp regions. The managers of the supermarkets were approached in connection with the study, as their permission was required for conducting the study.
Data were collected throughout the days and week in which the study was conducted, during non-peak hours (between 09.00 and 12.00 hours and between 14.00 and 16.00 hours), by means of questionnaires which were completed during face-to-face encounters. Due to the relatively low level of literacy of the South African population, such a data collection method is widely used in South Africa(Reference Babbie and Mouton35). The researcher was assisted by a seTswana-speaking fieldworker, who explained and/or translated the questions for those respondents who were not fluent in English or Afrikaans. A table and chairs were placed at the entrance to the supermarket for the researcher and the respondents to use for the duration of data collection.
Before completing the questionnaires, the respondents were fully informed of the aim of the research, of their right to withdraw from the study at any point and of their anonymity in relation to the study. They were also assured of the confidentiality of the data gathered for the study. Each of the respondents received a pamphlet that provided them with additional information on food labels, in order to encourage them to use the information on food labels before purchasing food products. The study was approved by the Ethics Committee of the North-West University, Potchefstroom Campus, no. NWU-0056-08-S1.
Questionnaire development
The questionnaire contained thirty-five items, consisting of both open- and closed-ended questions. The process of setting the questions and of formulating the statements was initiated by means of a review of the relevant literature used in previous studies relating to consumers’ understanding and use of information on food labels(Reference Levy and Fein12, Reference Peters-Texeira and Badrie17, Reference Klein18, Reference Satia, Galanko and Neuhouser20, Reference Szykman, Bloom and Levy23, Reference Anderson and Coertze25, Reference Wiles26). Experts in the field of consumer behaviour and statistical research methods evaluated the questionnaire to ensure the face and content validity thereof(Reference Neuman36, Reference Babbie37). The reliability of the method of data collection was confirmed by the potential of the method to yield consistent results each time it was applied, as suggested by Babbie(Reference Babbie37). To further strengthen the reliability of the study, the questionnaires were administered by one interviewer to those consumers who were both willing to participate in the study and also responsible for purchasing household groceries.
The questionnaire, which was organised in three different sections, took approximately 15 min to complete. Section A contained relevant demographic and food-purchasing behaviour questions to ensure the recruitment of respondents in line with the study’s aim. Section B focused on the first three objectives of the study, which were to determine the respondents’ use of information on food labels, to identify difficulties which they might have experienced when using food labels and to explore reasons why they did not use specific types of information on food labels. Section C of the questionnaire aimed to determine the respondents’ understanding of the information contained in food labels. The respondents were asked to perform labelling tasks in relation to three label samples. The samples tested their ability to perform the following tasks: (i) to use the ingredient list; (ii) to associate food nutrients with a food product, when presented with a food label; and (iii) to compare the nutritional information of different food products. The responses to the latter were marked. Scores were awarded based on the level of correctness of the responses concerned, with points being awarded for correct answers and no points being awarded for either an incorrect answer or a ‘don’t know’ response.
The questionnaire was carefully translated from English into Afrikaans by a person proficient in both languages in order to ensure that the translated questionnaire reflected the same meaning as was conveyed by the original text. The twenty members of a small group of respondents, who closely represented the target population, were also asked to pilot test the questionnaire before the main study. The pilot study took place under exactly the same conditions as were required in terms of the research methodology. Such a replication of conditions assisted the researcher in evaluating the clarity of all the questionnaire items(Reference Rubin and Babbie38), as well as to ensure that the length of the questionnaire did not discourage the respondents from completing it in full.
Data analysis
The closed-ended questions were analysed with the help of the Statistical Consultation Services of North-West University, Potchefstroom Campus. These questions were pre-coded and analysed by means of the SPSS version 17·0 (SPSS Inc., Chicago, IL, USA) and the S-Plus (TIBCO Software Inc., Palo Alto, CA, USA) statistical software packages. The following statistical methods were used.
1. Descriptive statistics, which included summary statistics (e.g. the mean and sd), frequency tabulation and contingency tables. Bar charts and boxplots were used for graphical representation.
2. Testing relationships in contingency tables was computed by means of the effect size w. The effect size is defined as
 , which was interpreted as: a small effect, w = 0·1; a medium effect, w = 0·3; and a large effect, w = 0·5(Reference Ellis and Steyn39). A relationship with w ≥ 0·5 is considered to be of practical significance.
3. The effect size used to compare group means was
, where are the sample means of the two groups, and s max = max(s 1, s 2), in which s 1 and s 2 are the sample sd of the group. Ellis and Steyn(Reference Ellis and Steyn39) give the following guidelines for interpretation: d = 0·2 (a small effect); d = 0·5 (a medium effect); and d = 0·8 (a large effect). A large effect size indicates a difference of practical significance among the groups.
The open-ended questions were analysed by means of content analysis in order to analyse and organise the questions within the ambit of the study. As described by Denscombe(Reference Denscombe40), the analysis was performed by reading the responses to the open-ended questions and then by identifying the categories relevant to the study. The categories that were identified were analysed in terms of their relationship with each other(Reference Denscombe40) and then used to the describe responses to the questions concerned.
Results and discussion
Demographic characteristics of the sample
A total of 174 respondents participated in the present study. The respondents were primarily under the age of 45 years (74·9 %), with 33·7 % coming from the 25–34-year-old age group. Food purchase was found to be largely undertaken on a weekly basis, with between 30 and 60 min usually being spent inside the store. Most (40·6 %) of the households spent between R500 and R999 on food purchases per month, with only 25·7 % spending <R500/month and 33·9 % spending >R1000/month. The average annual household income of Potchefstroom and Klerksdorp is R60 918(33), of which 15 % is spent on food purchases(41). Furthermore, high blood pressure and obesity were the most frequently observed health conditions among 54·9 % of the sample who reported a diet-related health condition. About 30 % of the respondents had a grade 10 or lower level of education, whereas 70·7 % had a grade 12 or higher level of education. Of the sample, 45·7 % were employed on a full-time basis. Only 6·9 % of the represented households consisted of people who lived alone, with 57·7 % consisting of two to four household members and 34·8 % consisting of five or more such members.
The frequency of label reading was determined by splitting the respondents into three different groups, in terms of those who ‘always’, ‘sometimes’ and ‘never’ read food labels. The results obtained showed that 24·7 % of the respondents indicated they ‘always’ read the information on food labels, whereas 42·0 % of the respondents only ‘sometimes’ read food labels, with 33·3 % of the respondents indicating that they ‘never’ read information on food labels. Such results are verified by other studies(Reference Cowburn and Stockley16), which indicate that most consumers claim to look at food labels often or, at least, sometimes. For the purpose of the current discussion, the ‘always’ group will be referred to as group A, the ‘sometimes’ group as group B and the ‘never’ group as group C.
The effect size was used to quantify the relationship between the frequency of label reading of the three respondent groups, their demographic characteristics and situational factors. The only relationship found to be important was that existing between educational level and frequency of label reading, which was found to have a medium effect (w = 0·299). Such a finding implies that the lower the respondent’s level of education, the less frequently they were found to read food labels. Of those respondents with a grade 10 or lower level of education, 54·9 % were found ‘never’ to read food labels (Fig. 2).
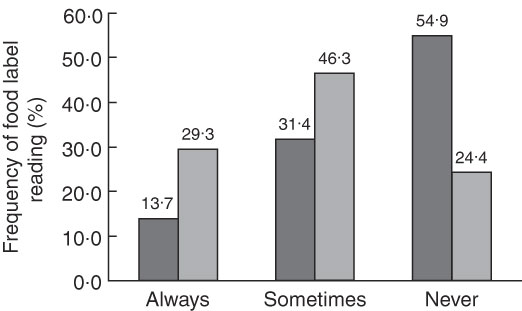
Fig. 2 Relationship between respondents’ frequency of food label reading and educational level (![]() , grade 10 or less, n 51;
, grade 10 or less, n 51; ![]() , grade 12 or higher, n 123
, grade 12 or higher, n 123
Those respondents with an educational level lower than grade 10 were found more likely ‘never’ to read food labels, compared with those respondents with a grade 12 or higher educational level, who were found most likely to read food labels. Such findings could result from the respondents’ awareness of nutrient content, which tends to increase in tandem with the number of years of education acquired(Reference Drichoutis, Lazaridis and Nayga29). The positive relationship found between the frequency of reading of food labels and educational level is consistent with the findings of Satia et al.’s(Reference Satia, Galanko and Neuhouser20) study among African-American respondents and with Neuhouser et al.’s(Reference Neuhouser, Kristal and Patterson19) study which used mainly white respondents. Contrary to both these findings, however, the present study found no relationship between the frequency of label reading and gender.
Respondents’ motivations to read food labels
Consumers most likely have different motivations in searching for, or using, the information that is contained in food labels (Fig. 1). Such motivation tends to be determined, at least in part, by the perceived risk they associate with the use of the product. Therefore, the current researcher anticipated that the motivation of respondents who ‘always’ read food labels might differ from the motivation of respondents who only ‘sometimes’ read food labels. To evaluate the statement, the responses of groups A and B were compared, as the respondents in the two groups indicated that they read food labels. The results, as portrayed in Table 3, indicate that 92·8 % of group A ‘always’ read food labels to determine the nutritional content of the food product or when purchasing a food product for the first time. Conversely, 76·7 % of group B indicated that they ‘always’ read food labels when purchasing a food product for the first time.
Table 3 Respondents’ motivation for reading food labels, with questions ranked according to option 1 (‘Always’) and values expressed as a percentage of responses of groups A and B
Even though 26·2 % of group A and 28·8 % of group B were found ‘never’ to read the information on food labels at home, 92·8 % of group A and 76·7 % of group B indicated that they tended to read food labels before purchasing a food product for the first time (Table 3). Evidently, first-time food purchasing does have a significant influence on consumers’ motivation to read food labels(Reference Cowburn and Stockley16, Reference Peters-Texeira and Badrie17, Reference Anderson and Coertze25).
The comparison of those respondents who indicated that they read food labels, as represented in Table 3, clearly shows that group A has the strongest motivation, in terms of the reasons mentioned above, for reading food labels. In addition, the respondents in group A tend to be more involved in the search for, and evaluation of, information on the food label, due to the fact that they associate greater risk with the use of a product. The motivation that respondents might have to use food labels was further explored by asking an open-ended question, ‘Why do you read food labels?’ The responses to the question were then categorised according to product- and health-related factors (Table 4).
Table 4 Responses to the open-ended question: ‘Why do you read food labels?’
As is shown by the data relating to groups A and B, which are presented in Table 3, the respondents mentioned that they read food labels to determine the nutritional (especially the fat, vitamin and protein) content of the products. Information relating to the quality of the product was also found to be important in motivating respondents to read food labels (Table 4). Some respondents mentioned that health concerns motivated their food label reading, as such reading facilitated them in choosing nutritious food or food products that were appropriate for those with diet-related diseases. Those consumers who do not already read food labels should be sensitised to the health benefits that they can gain from doing so.
Identification of respondents’ use of specific label information
How important consumers see the reading of the expiry date, the ingredient list, the nutritional information and the nutrient content claims was determined by asking whether such information was regarded as ‘very important’, ‘moderately important’ or ‘unimportant’. As shown in Table 5, both groups, A and B, regarded the expiry date to be ‘very important’. Such results are consistent with the respondents’ motivations for using food labels to determine the quality of the product, as are presented in Table 4. Such information, therefore, can be seen to be regarded as important by the respondents in relation to their search for products with the longest shelf life, as the expiry date of a food product serves as an indication of its freshness(Reference Peters-Texeira and Badrie17). Consequently, food manufacturers should ensure that the expiry date appears clearly on all their food products(Reference Klein18).
Table 5 Respondents’ assignment of relative importance to specific information on food labels
MDR, minimum daily requirement; GI, glycaemic index.
Although 83·3 % of group A and 59·1 % of group B indicated that they read the ingredient list on food labels, only 48·7 % of them specified that they read such a list in order to avoid purchasing a product containing certain ingredients, such as additives and preservatives (13·1 %), tartrazine (10·3 %) and monosodium glutamate (6·3 %). Due to the low response rate recorded in asking the related question, the above-mentioned results were not included in Table 5. In general, consumers seemed either to be unconcerned about which ingredients were present in the food that they bought or failed to understand the terms used in the ingredient list.
In the present study, nutritional information, such as that relating to fat (81·4 %) and cholesterol (81 %) content, was regarded as ‘very important’ by the respondents in group A (Table 5). In contrast to the findings recorded for group A, the highest percentage of respondents of group B (72·6 %) indicated the information relating to vitamin and mineral content as ‘very important’, followed by that relating to cholesterol (56·2 %) and total fat (55·6 %) content. Lin et al.(Reference Lin, Lee and Yen42) reported that those respondents who attempted to maintain their weight and to follow a diet low in fat or cholesterol were more likely to read information on food labels. However, the primary interest expressed in the fat content of a product might indicate consumers’ lack of understanding about nutrients in general, leading to their inability to evaluate the nutritional value of the food product from the information presented on the food label(Reference Jones and Richardson4).
With regard to nutrient content claims, both groups, A and B, considered claims such as ‘low in fat’ and ‘low in cholesterol’ to be very important information to be presented on food labels. Although 80·9 % of group A indicated ‘low in cholesterol’ to be very important information to be presented on the label, 67·1 % of group B indicated ‘low in fat’ claims to be very important for inclusion on the label. The relatively low scores that were awarded to ‘low glycaemic index (GI)’ and ‘high in fibre’ claims can be taken as indicating that such claims are less important to both groups, when considered in comparison with fat and cholesterol nutrient content claims. The relative unimportance that respondents associated with the former type of information might be because of such information being less well known or less well understood by consumers(Reference Higginson, Rayner and Draper43).
Identifying difficulties that respondents encounter when using food labels and their reasons for not using food labels
A total of 67·5 % of the respondents who stated that they read food labels (in groups A and B) regarded the information to be consumer friendly or easy to use, with 65·8 % having no difficulty in finding specific nutritional information on the label (Fig. 3). The fact that 70 % of the respondents indicated that food labels did not include information regarding their diet-related health conditions is of concern, as sufficient information should be provided on food labels to facilitate food purchasing by such consumers. Minor difficulties were further experienced by groups A and B with regard to the font size used on food labels. The results indicated that 46·5 % of the respondents experienced difficulties using the information on food labels due to the size of the font used to convey such information, which was too small to read. The terms that were used in the ingredients' list were found to be confusing to 42·1 % of the respondents. Apart from such a difficulty, no other difficulties associated with the use of food labels were reported by either group A or B.
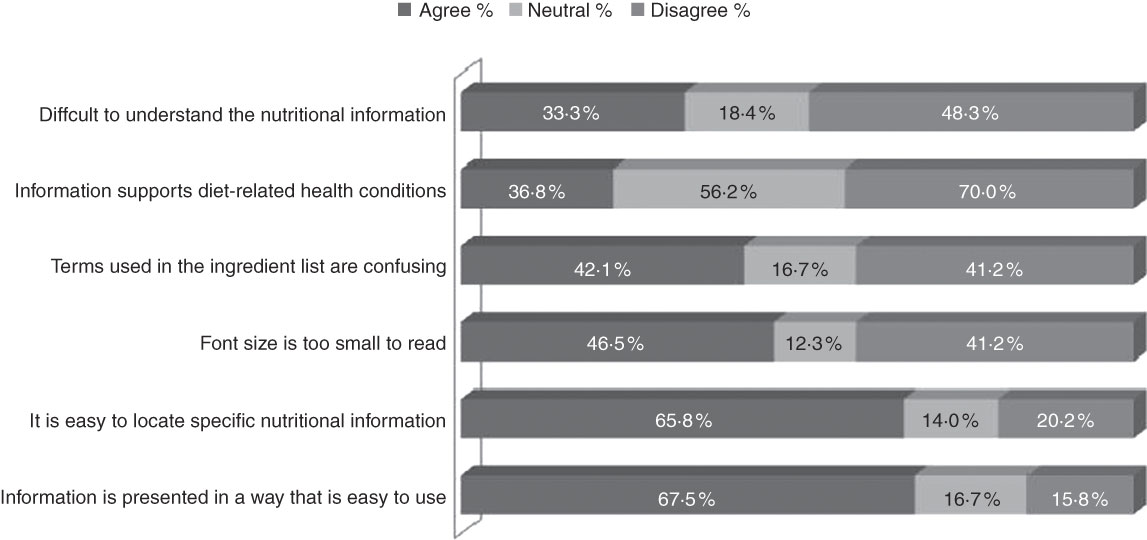
Fig. 3 Difficulties encountered by respondents in groups A and B (n 116) when using food labels, with questions ranked according to option 1 (‘Agree’)
The reasons why respondents do not read the information on food labels were determined by evaluating the responses of group C, as this group indicated that they ‘never’ read food labels. The responses of the said group are shown in Fig. 4. Of the respondents, 75 % indicated that they regarded the taste of the product as being more important than its nutritional content. Other reasons provided for never reading food labels were that 73·7 % of the respondents tended to purchase food products according to price and 73·2 % of the respondents tended to buy such products based on habit, whereas 71·9 % of the respondents felt that reading food labels was too time consuming. That the taste of a product was generally regarded as being more important than its nutritional content indicates either a lack of interest in the nutritional content of the purchased food or a belief that food of greater nutritional value might have an inferior taste(Reference Drichoutis, Lazaridis and Nayga29). Previous studies have also found that habitual shoppers tend not to use food labels and that they tend to be more concerned about the price of the food product concerned(Reference Anderson and Coertze25, Reference Gracia, Loureiro and Nayga30, Reference Signal, Lanumata and Robinson44). Therefore, those respondents who purchase specific food products out of habit have been found generally to be more price conscious than other consumers. However, buying out of habit could also be related to the time constraints that such consumers experience when purchasing food, which helps to explain why the respondents in the current study found food labels too time consuming to read.
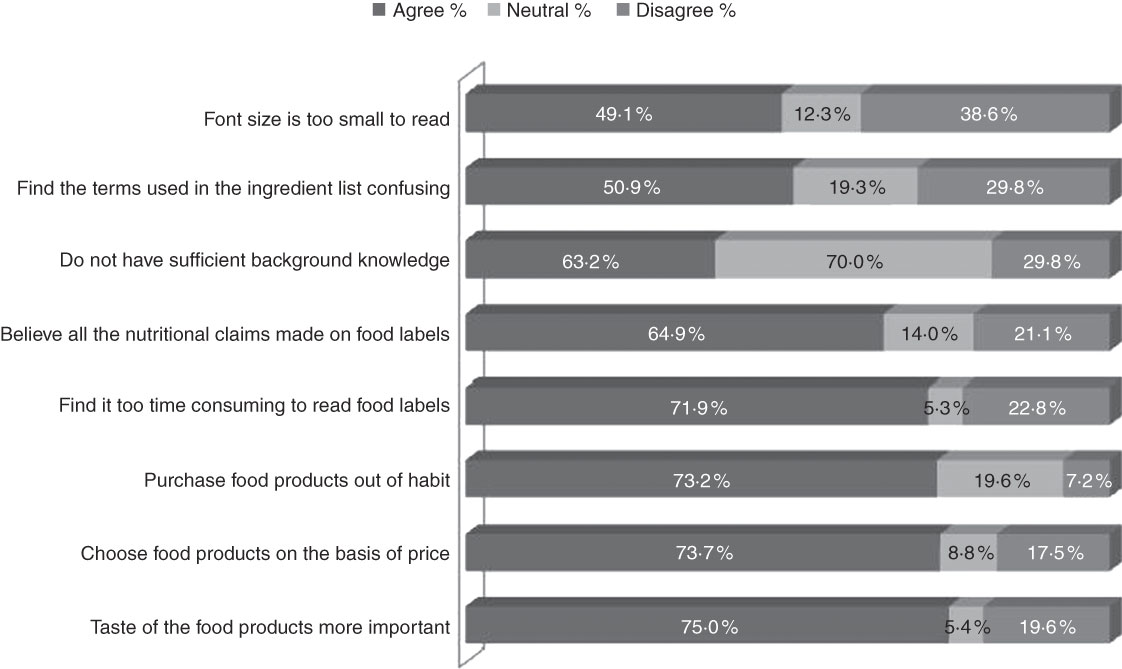
Fig. 4 Reasons why respondents in group C (n 58) do not read the information on food labels, with questions ranked according to option 1 (‘Agree’)
The reasons that respondents gave for not reading food labels were further explored by means of asking them the following open-ended question: ‘Why don’t you read food labels?’ (Table 6). Routine purchases, price considerations and time constraints were again mentioned as reasons for not doing so. Evidently, the price and affordability of food products influenced the respondents’ dietary choices(Reference Charlton, Brewitt and Bourne2, Reference Gracia, Loureiro and Nayga30). Some respondents also indicated that they avoided reading food labels due to their lack of interest in doing so, which might mean that such consumers are unaware of the relationship that exists between reading labels and the improvement of the quality of their diet(Reference Mannell, Brevard and Nayga45).
Table 6 Responses to open-ended question: ‘Why don’t you read food labels?’
Consistent with the information that is contained in Fig. 1, those external influences that are associated with product attributes, such as the taste and price of a product, were found greatly to influence the respondents’ use of food labels. Accordingly, consumers should be advised that more nutritious food products are not necessarily more expensive. In contrast to such external influences, internal influences, including such situational factors as the experience of time constraints, might also help to explain why routine food purchases are often undertaken without the purchaser considering the information provided on the label of the food product that is bought.
The reasons indicated by the respondents in the present study for not reading food labels included their relative lack of knowledge about the importance of not doing so, as well as their lack of ability to read the labels and their inability to interpret the information that is provided on the food label (Table 6). Such reasons, which are regarded as internal factors influencing the reading of food labels, are related to the demographic characteristics of the respondents (Fig. 1), specifically their level of education and nutritional knowledge. In support of such results, a New Zealand study found a lack of understanding of the nutritional information provided on food labels to be a barrier to obtaining information from such food labels(Reference Signal, Lanumata and Robinson44). Insufficient reading skills might explain why consumers tend to disregard nutritional information on food labels. The language, including the terminology, used on food labels has been found to directly affect consumers’ food choices(Reference Boehl46). Such results support the conceptual framework (Fig. 1), in terms of which consumers’ understanding of the information provided on food labels was found to depend on their cognitive abilities to read and interpret the information provided. Furthermore, such a finding emphasises the fact that education is the most important demographic characteristic influencing consumers’ understanding and use of information from food labels. Accordingly, the information that is provided on food labels should be presented in such a way as to assist those consumers with limited reading abilities to learn all necessary details about the labelled products.
Respondents’ understanding of the information that is provided on food labels
The respondents were then asked to perform labelling tasks concerning three label samples. The tasks tested the respondents’ abilities to do the following: (i) to use the ingredient list; (ii) to associate food nutrients with a food product when presented with a food label; and (iii) to compare the nutritional information of different food products. The outcome of such tasks is presented in Fig. 5, with the results being grouped according to the respondents who ‘always’ (group A), ‘sometimes’ (group B) or ‘never’ (group C) read food labels. The results from the statistical summary indicate that group A attained an average score of 55·5 %, in comparison to 44·1 % attained by group B and 36·3 % attained by group C.
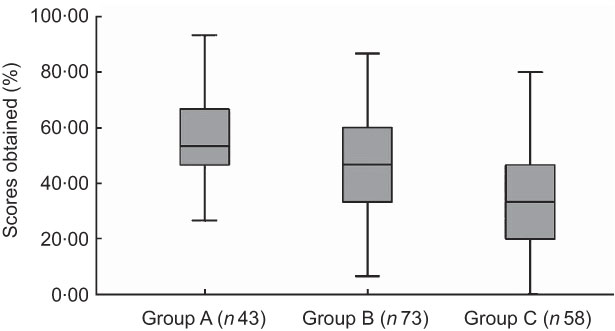
Fig. 5 Boxplot illustration of the scores for the label-reading tasks (effect size: groups A and B, d = 0·59; groups B and C, d = 0·36; groups C and A, d = 0·89)
The standard deviation spread among the three groups was also comparable (group A = 18·0; group B = 19·2; group C = 21·4). Effect sizes were used to measure the relationship between the respondents’ understanding of the information provided on food labels and their ability to use food labels in order to make informed food choices. A medium effect (d = 0·59) was found between groups A and B, compared with the small-to-medium effect (d = 0·36) which was found to exist between groups B and C. However, a large effect (d = 0·89) was found to exist between groups A and C. Such a finding means that those respondents who ‘always’ read food labels are more likely to achieve a relatively high score in the labelling tasks compared with the score that is obtained for respondents who only ‘sometimes’ or who ‘never’ read food labels. Therefore, as the respondents’ reading of food labels increased, so did their understanding of, and their ability to use, the information provided on food labels, allowing them to make more informed food choices. Such a finding is consistent with that of another South African study in this respect, which was conducted by Anderson and Coertze(Reference Anderson and Coertze25). However, in the present study, the low scores on the food label-reading tasks generally recorded suggest that the respondents lacked sufficient understanding of the information provided on the food labels to enable them to use it to make more effective food choices.
The effect of the respondents’ educational levels and demographic characteristics on the scores they attained in the label-reading tasks was quantified in terms of effect size means, using statistical analysis. The only effect that was found to be of any significance was that of the respondents’ level of education on their understanding of the information provided on the food labels concerned, as is shown in Fig. 6. Respondents with a grade 10 or lower level of education attained a mean score of 32·0 %, compared with the mean score of 49·0 % attained by respondents with a grade 12 or higher level of education. The d value in this case was 0·86, indicating a difference of practical significance between the groups concerned.
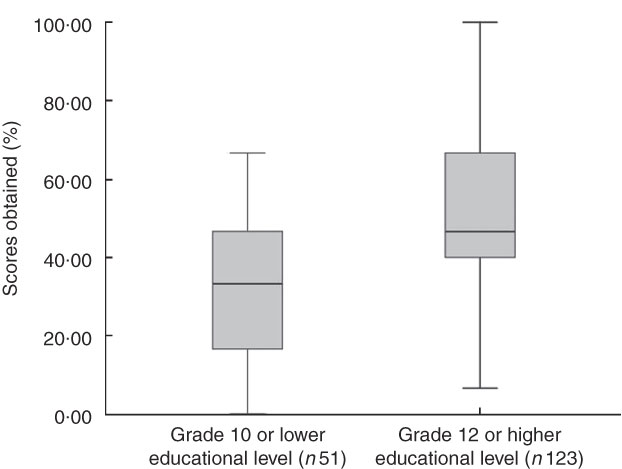
Fig. 6 Boxplot illustration of relationship between the scores for the label-reading tasks and the respondents’ educational level (effect size between education group: d = 0·89)
Such results indicate that, for the sample under discussion, those respondents with a higher educational level tended to understand more of the information provided on food labels. These findings are similar to those that were attained in a study conducted in Greece(Reference Drichoutis, Lazaridis and Nayga29). However, the findings are inconsistent with those obtained in Anderson and Coertze’s(Reference Anderson and Coertze25) study, in which age and level of income were found to have a significant influence on the respondents’ level of nutritional knowledge, whereas the level of education held by the respondents was not shown to have a significant influence. Such differences might be due to the fact that the typical demographic characteristics of the respondents in their sample were those of white middle-income consumers with a grade 10 level of education.
Recommendations for improving the quality of, and for better communicating, nutritional information on food labels
The respondents were next asked how they thought the quality of nutritional information on food labels could be improved and better communicated to consumers. A summary of their responses is presented in Table 7. Consistent with the findings of Klein(Reference Klein18), the respondents felt that the information would be easier to read if more colours, pictures, languages and a larger font size were to be used. Some respondents mentioned that the information, such as that relating to nutrients or terms, provided on food labels should be made more accessible and generally understandable. In a French study which was conducted in supermarkets using four different income categories, the respondents complained that nutritional information was written in print that was illegible due to its small size. Consistent with the findings of the present study, the respondents suggested that food labels could be improved by the designers of such labels using different coloured print, as well as by including an explanation of the nutritional terms and values used(Reference Mannell, Brevard and Nayga45).
Table 7 Responses to open-ended question: ‘Suggestions to improve and communicate the information on food label to consumers’
The following forms of consumer nutritional education activities were advocated, in order of frequency: schools, media (especially television) and in-store presentations by store personnel (Table 7). It was felt that specific target groups (such as consumers with diet-related diseases) should be informed by way of workshops on the importance of food labels. Similar sources of nutritional education were also identified in a study that was conducted among black urban women living in Pretoria and Cape Town. The study recommended that nutritional information should be provided consistently and disseminated in a practical and affordable way(Reference Charlton, Brewitt and Bourne2). Since the respondents in the present study also indicated that store personnel could be a source of nutritional information, the staff at food stores should be made aware of the importance of nutrition and be provided with the necessary skills in order to assist consumers in accessing information that is provided on food labels. Therefore, nutritional education on how to maximise the benefits to be gained from using food labels as a source of information on food products should be offered to learners at schools, as well as to the general public at the point of purchase in stores, and by means of appropriate information campaigns conducted in the media(Reference Anderson and Coertze25).
Conclusions
The study described in the present paper was aimed at investigating adult consumers’ understanding of the information provided on food labels, as well as at determining whether consumers use such information in choosing what food products they purchase. The results of the study showed that although a large proportion of the respondents indicated that they did, in fact, read food labels, the scores they attained on their performance in the labelling tasks showed they did not necessarily have an understanding of how to maximise the benefits to be gained from reading food labels. Furthermore, 33·3 % of the respondents reported not reading the labels on food products that they bought. A discrepancy was found between the respondents’ reading of food labels and their understanding of the information that was provided on such labels. Those respondents who stated that they ‘always’ read food labels were more likely to achieve relatively high scores on the labelling tasks in comparison with the scores obtained by respondents who stated that they only ‘sometimes’ or ‘never’ read food labels.
The respondents were found to have different motivations for reading food labels, although purchasing a particular food product for the first time was found to be the single most important motivation for reading its label. Such a finding serves to highlight the important role that food manufacturers play in ensuring that their food products are appropriately labelled, in compliance with South Africa’s legislated regulations. Furthermore, those respondents who stated that they read food labels reported they most often consulted the expiry date and ingredient list. They also reported often consulting any nutritional information provided which was related to the fat and cholesterol content of the product concerned. Such information usage might be due to weight- and diet-related disease concerns, and might also explain the high degree of interest shown in ‘low in fat’ and ‘low in cholesterol’ nutrient content claims. However, such interest, along with the relatively low degree of interest shown in the use of nutrient content claims, such as those related to ‘low GI’ and ‘high in fibre’ contents, might indicate that either (i) consumers tend to have an inadequate understanding of the nutritional information that is provided on food labels, or (ii) consumers tend not to know what food label information they should evaluate when choosing to purchase a particular food product.
Although food labels were generally regarded as easy to use, the respondents in the present study disagreed with the statement that the information provided on food labels is supportive of their diet-related health needs. The reasons given for not reading food labels were further found to be related both to internal and external influences. External influences on the use of food labels seem generally to be associated with product attributes, such as the taste and price of the product concerned. The importance placed on the price of the product might imply that a need exists to educate consumers regarding how they might best use the information provided on food labels to assist them in choosing food products with a relatively high nutritional value at a relatively low cost. Internal influences were associated with situational factors, such as experiencing time constraints, as well as with specific demographic characteristics, such as the level of education and the extent of nutritional knowledge held.
In order to strengthen the practical relevance of the present study, it is recommended that food label regulators and manufacturers use colour, pictures and different languages on food labels to facilitate consumers’ understanding of the nutritional value of their product. Such devices could help to overcome language barriers and the relatively low levels of functional literacy experienced in South Africa. To further assist in the understanding of food labels, additional information, such as explanations of nutritional terms, might be provided in-store.
Due to the relatively small sample size used in the present study, care should be taken when generalising its results to the wider population of South Africa. Accordingly, it is recommended that further research in the nutritional education field should be performed on a larger scale, in order to include more widely ranging consumers and supermarkets and a wider demographic area. It is also recommended that more objective methods of data collection, such as those involved in observation, should be implemented to determine how consumers use the information that is provided on food labels in real-life situations. Despite the relatively small size of the sample studied, the findings of the present study are of value to food-labelling regulators and manufacturers, with regard to the suggestions that have been made for improving food labelling in the country. In addition, guidelines have also been provided for those who are involved in the field of consumer education, as regards implementing an educational programme aimed at informing consumers how best they might use the information that is made available on food labels.
Acknowledgements
The present study was supported by the AUTHeR Research Unit (Africa Unit for Transdisciplinary Health Research) at the North-West University, South Africa. To the knowledge of the authors, there has been no conflict of interest related to the present study. S.A.J. was responsible for the literature collection and data, statistical analysis and text drafting; H.d.B. supervised the research during all the stages and reviewed the paper critically; M.L. performed the role as the co-supervisor to the research. The authors thank the AUTHeR Research Unit for the funding provided to perform the research reported on in the present paper and Dr G. Koekemoer for his help with the statistical analyses of the data.


