


Despite numerous past and ongoing public health prevention and intervention initiatives, childhood and adulthood overweight and obesity (overweight/obesity) remains one of the most significant global public health challenges( 1 ). The estimated annual global direct economic impact and worldwide investment to mitigate obesity is currently third only to smoking and armed conflict( Reference Dobbs, Sawers and Thompson 2 ). Within Australia, childhood overweight/obesity occurs in approximately one in four (27·6 %) children aged 5–17 years, while overweight/obesity is present in 63·4 % of adults( 3 ).
Early identification of overweight/obesity within infants and children is largely contingent on the screening behaviours of primary care clinicians (PCC)( Reference Klein, Sesselberg and Johnson 4 ). Currently in the USA and Australia, BMI percentile screening for overweight/obesity in children is recommended within primary care (age ≥6 years and age 2–18 years, respectively), its role being the detection of current overweight/obesity( Reference Grossman, Bibbins-Domingo and Curry 5 , 6 ). Yet, once overweight/obesity has developed in children and adolescents, the long-term success of intervention strategies is modest( Reference Hassink 7 ). Even with global recognition and recommendation for the use of BMI percentile screening within paediatric primary care, it is performed infrequently and inconsistently( Reference Klein, Sesselberg and Johnson 4 , Reference Barlow, Bobra and Elliott 8 ).
To maximise success in preventive health with currently available tools, the use of BMI as a predictor of future overweight/obesity has been considered( Reference Simmonds, Burch and Llewellyn 9 ). However, BMI has limited clinical efficacy in predicting future overweight/obesity; a large proportion of obese adults do not identify as obese in childhood( Reference Simmonds, Burch and Llewellyn 9 ). Therefore, the utility of BMI alone as an adequate tool to assess the risk of future overweight/obesity and potential co-morbidities is questionable.
Investigation into other anthropometric predictors of childhood and adulthood obesity has resulted in strong evidence for maternal pre-pregnancy weight status( Reference Zalbahar, Najman and McIntyre 10 , Reference Rath, Marsh and Newnham 11 ), low( Reference Hales and Barker 12 ) and high birth weight( Reference Yu, Han and Zhu 13 , Reference Evensen, Emaus and Kokkvoll 14 ) and rapid infant weight gain( Reference Ong and Loos 15 ) influencing obesity outcomes in childhood and adolescence. Additionally, non-anthropometric predictors have been identified, such as maternal smoking during pregnancy( Reference Ino 16 ), breast-feeding duration( Reference Horta, Loret de Mola and Victora 17 , Reference Scott, Ng and Cobiac 18 ) and parental education( Reference Birbilis, Moschonis and Mougios 19 , Reference Parrino, Vinciguerra and La Spina 20 ). To maximise the accuracy of overweight/obesity prediction, a combination of child anthropometric, maternal, environmental and socio-economic predictors is likely necessary.
Paediatric PCC are well-positioned to effect change for children and their families; they have the ability to influence weight-related behaviours themselves, or initiate referrals to appropriate health professionals or health services for further intervention if necessary( Reference Klein, Sesselberg and Johnson 4 ). The ability of PCC to discriminate low-risk and high-risk infants for future overweight/obesity may increase the preventive reach of the health-care system, as early interventions for high-risk infants can be prioritised before overweight/obesity develops.
The aim of the present review, therefore, was to assess the global availability of a prediction tool estimating the risk of developing overweight/obesity at any stage throughout infancy, childhood, adolescence or adulthood, and to compare their predictive validity and relevance to current clinical settings.
For the purposes of the review, all included questionnaires, equations, models, indices, evaluations or tools are collectively referred to as ‘tools’.
Methodology
The protocol for the present systematic review was published in PROSPERO prior to commencement (CRD42017071048; available at https://www.crd.york.ac.uk/PROSPERO/display_record.asp?ID=CRD42017071048).
Search strategy and identification of included articles
The databases PubMed, EMBASE, CINAHL, Web of Science and PsycINFO were searched for articles published since individual database inception until September 2017.
Key words were identified via literature scoping, group discussion and consultation with a research librarian. Identified key words were translated into a PICO (Population, Intervention, Comparison and Outcome)( Reference Aslam and Emmanuel 21 ) format and used as the template in searching for all relevant publications within each database (see online supplementary material, Table S1). The final strategy involved a combination of key words and controlled vocabulary, limited by abstract/title to achieve precise results. Two reviewers (O.J.C. and J.L.W.) independently screened all articles based on title and abstract. Full-text articles were then screened by two reviewers (O.J.C. and J.L.W.) based on the specified inclusion and exclusion criteria, with any discrepancies discussed and resolved by a third reviewer (R.L.). The reference lists of all included articles were also checked to identify additional articles of relevance. The PRISMA (Preferred Reporting Items for Systematic Reviews and Meta-Analyses)( Reference Moher, Liberati and Tetzlaff 22 ) guidelines were followed in preparing the review (see online supplementary material, Table S2 for the PRISMA checklist and Fig. 1 for the PRISMA flow diagram).
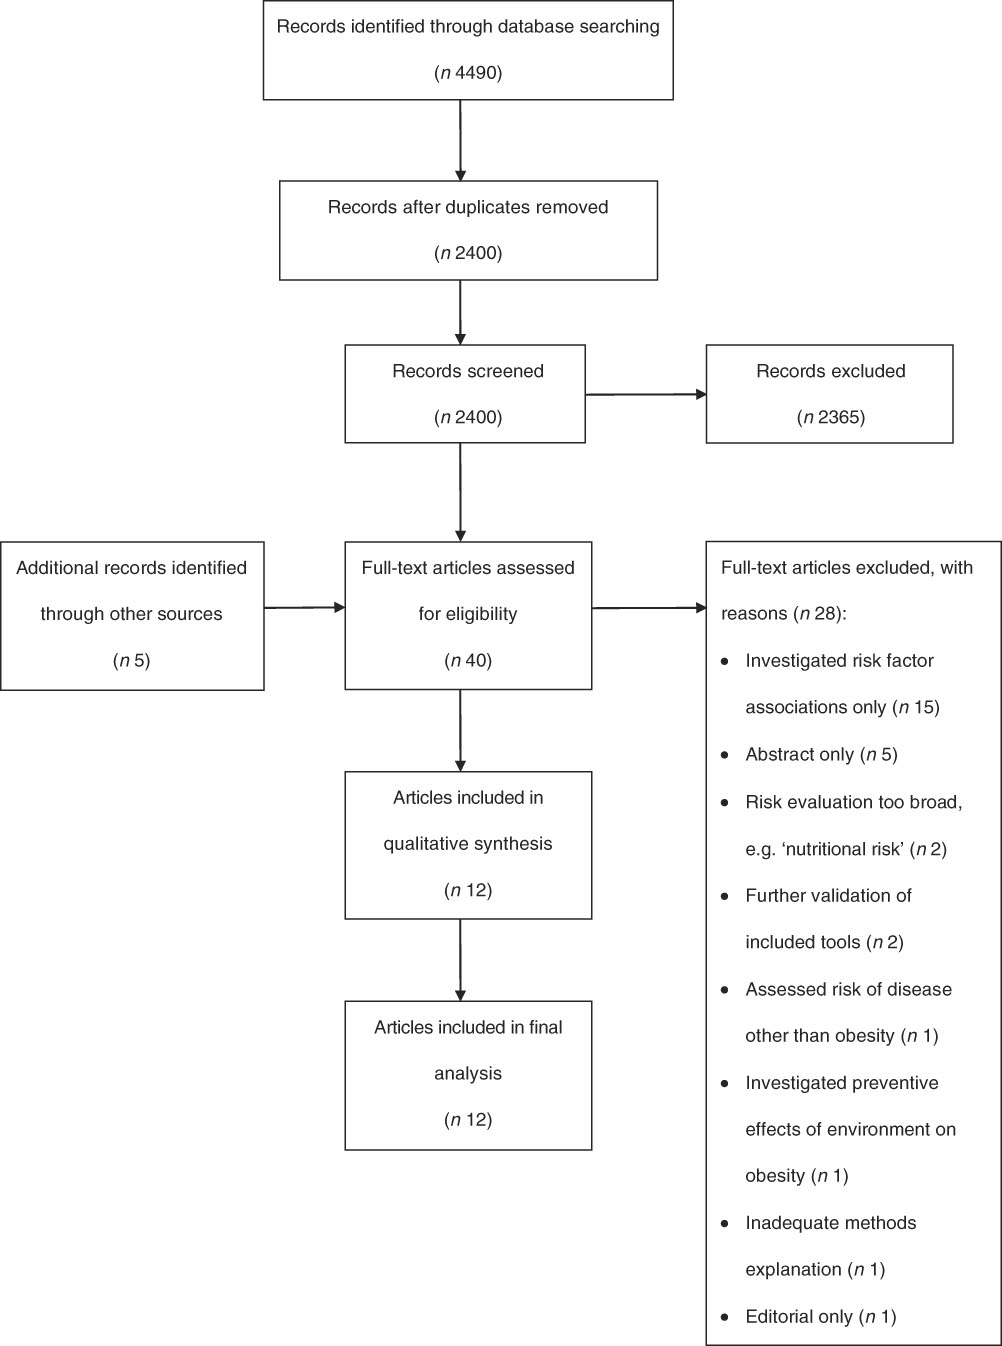
Fig. 1 PRISMA (Preferred Reporting Items for Systematic Reviews and Meta-Analyses) flow diagram of search strategy results for the present systematic review of tools to predict infant, childhood and adulthood obesity
Inclusion and exclusion criteria
Articles were included if they described the development of a prediction tool designed to predict overweight/obesity. Articles were required to meet the following inclusion criteria:
1. Tool was designed to be administered at any stage throughout gestation, infancy, childhood, adolescence and adulthood; and
2. Tool determined the risk of overweight/obesity onset at any stage throughout infancy, childhood, adolescence or adulthood, irrespective of study design; and
3. Tool employed a multicomponent approach, either through:
a. The use of more than one predictive variable in the final tool; or
b. If using only one predictive variable, the use of more than one time-point measurement of the same variable; and
4. Article described the risk output, which was accepted to be either of the following:
a. A percentage likelihood of overweight/obesity development; or
b. A numerical or qualitative score output specific to the tool; and
5. Article reported statistical analyses pertinent to prediction tool performance: calibration, discrimination and decision-curve analysis, i.e. calibration-in-the-large, calibration slope, goodness-of-fit (P value), receiver operating characteristic (ROC) curve analysis (area under the ROC curve (AUC)), sensitivity, specificity and the tool’s decision threshold. Positive predictive value (PPV) and negative predictive value (NPV) were also considered acceptable, as were odds ratio and/or relative risk analyses.
Exclusion criteria were any articles not published in English, those not published as full-text articles and any cohorts investigating the outcome within unwell children.
Data extraction and synthesis
The following characteristics of each article were extracted for qualitative synthesis: year of publication, country, study type, cohort description, outcome measure, outcome age and diagnostic criteria. The predictive variables of each tool were also extracted and, for ease of reporting, were classified into one of the groups: anthropometric; socio-economic/sociodemographic; and clinical. Clinical predictive variables were classified as those representing a clinical factor unrelated to anthropometric or socio-economic/sociodemographic elements. The following results of each article were extracted for quantitative synthesis: calibration outcome (e.g. calibration-in-the-large; calibration slope; and/or goodness-of-fit (P value)), AUC (%), sensitivity (%), specificity (%), PPV (%), NPV (%) and the decision threshold of the tool.
Prediction tool performance
The optimal predictive accuracy of a tool depends on the individual outcome being predicted, the costs of misclassification and the clinical pathway each individual will enter after risk assessment( Reference Eusebi 23 ). Therefore, there is no known standard definition for statistical predictive outcomes that justify a tool’s use in a clinical setting. Instead, prediction tool validity, and thus performance, may be estimated according to the Alpha, Beta, c-statistic and Decision-curve analysis (ABCD) framework, developed by Steyerberg and Vergouwe( Reference Steyerberg and Vergouwe 24 ), which considers the following indicators to assess overall prediction tool performance: calibration (calibration-in-the-large; calibration slope); discrimination (AUC); and decision-curve analysis (sensitivity; specificity). Indicators pertinent to the ABCD framework were extracted for each study and compared qualitatively. For the purposes of the present review, strength of discriminative accuracy was determined as: inadequate if AUC<70%; adequate if AUC=70–80 %; and excellent if AUC> 80%, as indicated by Lee et al.( Reference Lee, Bang and Kim 25 ).
Clinical relevance
The clinical relevance or usefulness of a prediction tool can be defined as its ability to generate a decision threshold, or a ‘cut-off’ point, to classify patients as low-risk or high-risk, to contribute to and enhance clinician decision making( Reference Steyerberg and Vergouwe 24 ); however, the strength of a prediction tool cannot be determined solely by statistical metrics( Reference Dent, Wright and Stephan 26 ) – practical factors also influence a tool’s immediate clinical relevance. To our knowledge, there are no available criteria to objectively assess a prediction tool’s immediate clinical applicability. Therefore, the authors defined factors relating to clinical relevance as the following:
1. Author mention, within the article, of tool translatability to current practice.
2. Ease of clinician accessing predictor variable information.
3. Defined action and/or referral pathway for individuals identified as ‘high-risk’.
Quality assessment and levels of evidence
Full-text articles included in the review were assessed for quality using the Academy of Nutrition and Dietetics’ Quality Criteria Checklist for Primary Research, located within the Evidence Analysis Manual (see online supplementary material, Fig. S1)( 27 ). Articles were designated a positive (+), neutral (Ø) or negative (–) quality rating, according to questions relating to each individual article’s relevance, validity and risk of bias (see Table 1).
Table 1 Quality rating and level of evidence results for studies included in the present systematic review of tools to predict infant, childhood and adulthood obesity

Each included article was then assessed against the National Health and Medical Research Council’s Levels of Evidence hierarchy( 28 ) (see online supplementary material, Fig. S2). The hierarchy classifies evidence into descending levels of strength (Level I, II, III-1, III-2, III-3, IV) based on robustness of the study design for a specific research question (see Table 1). This informs a study’s overall level of evidence quality.
Two reviewers (O.J.C. and J.L.W.) independently completed the quality checklist and Levels of Evidence hierarchy for each article and any inconsistencies were discussed with a third reviewer (R.L.) until an agreement was made.
Results
A total of 4490 articles were identified from the initial search. Following removal of duplicates, title and abstract screening was performed on 2400 articles, with forty subsequently full-text screened for eligibility. Of these, twelve articles describing the development of twelve tools were selected for inclusion in the review (see Fig. 1).
Quality rating and level of evidence
Table 1 presents a summary of all quality and level of evidence outcomes for each article. No articles were excluded due to poor quality. Eleven of the twelve included articles received a neutral rating (Ø), with only one article receiving a positive quality rating (+)( Reference Timpka, Angbratt and Bolme 29 ). Ten included articles were classified as Level II evidence( Reference Timpka, Angbratt and Bolme 29 – Reference Weng, Redsell and Nathan 38 ). One article was classified as Level III-1 evidence( Reference Seyednasrollah, Makela and Pitkanen 39 ), while the study by Druet et al.( Reference Druet, Stettler and Sharp 40 ) was classified as Level III-2 evidence.
Description of study cohorts
Table 2 presents the characteristics of included studies. The majority of articles utilised established prospective birth cohort samples (n 9)( Reference Timpka, Angbratt and Bolme 29 , Reference de Kroon, Renders and van Wouwe 31 , Reference Morandi, Meyre and Lobbens 33 – Reference Weng, Redsell and Nathan 38 , Reference Druet, Stettler and Sharp 40 ) to gather baseline and outcome data, then employed a retrospective approach to develop their tool. The size of cohorts used varied considerably, but was typically large: >10 000 participants (n 3)( Reference Potter and Ulijaszek 35 , Reference Weng, Redsell and Nathan 38 , Reference Druet, Stettler and Sharp 40 ); 5000–10 000 (n 1)( Reference Timpka, Angbratt and Bolme 29 ); 2000–5000 (n 4)( Reference Classen and Hokayem 30 , Reference Manios, Birbilis and Moschonis 32 – Reference Pei, Flexeder and Fuertes 34 ); 1000–2000 (n 3)( Reference Santorelli, Petherick and Wright 36 , Reference Steur, Smit and Schipper 37 , Reference Seyednasrollah, Makela and Pitkanen 39 ); and <1000 (n 1)( Reference de Kroon, Renders and van Wouwe 31 ). As a supplementary component to their meta-analysis, Druet et al. ( Reference Druet, Stettler and Sharp 40 ) employed a multivariate logistic regression approach within a sub-sample of cohorts (ALSPAC, SEYCHELLES and CPP; see Table 2) to develop their prediction tool.
Table 2 Characteristics of studies included in the present systematic review of tools to predict infant, childhood and adulthood obesity

NLSY79, National Longitudinal Survey of Youth; ALSPAC, Avon Longitudinal Study of Parents and Children; MRC HCS, Medical Research Council Hertfordshire Cohort Study; MRC NSHD, Medical Research Council National Survey of Health and Development; HAGUENAU, Haguenau Case–Control Study; SWEDES, Stockholm Weight Development Study; EUROAM, Formula-fed European Americans Cohort Study; CPP, Collaborative Perinatal Project; PBPP, Philadelphia Blood Pressure Project; SEYCHELLES, Seychelles Cohort; NFBC1986, Northern Finland Birth Cohort; GINIplus, German INfant Nutritional Intervention plus environmental and genetic influences on allergy development; LISAplus, Influences of LIfestyle-Related Factors on the Immune System and the Development of Allergies in Childhood plus Air Pollution and Genetics; NCDS, National Child Development Study; PIAMA, Prevention and Incidence of Asthma and Mite Allergy; CDC, Centers for Disease Control and Prevention; IOTF, International Obesity Task Force.
* Total number (n) of participants in each study indicates those who participated in the final development of the tool, rather than the initial cohort size.
Nine of the twelve included articles performed validation of their tool using internal or external methods, or both (see Table 2). Of these, five articles randomised a varying percentage of participants from their development cohort into a validation cohort( Reference Timpka, Angbratt and Bolme 29 , Reference Pei, Flexeder and Fuertes 34 , Reference Weng, Redsell and Nathan 38 – Reference Druet, Stettler and Sharp 40 ). Two articles performed validation externally using a different cohort( Reference Morandi, Meyre and Lobbens 33 , Reference Santorelli, Petherick and Wright 36 ). Internal validation using bootstrapping methods was completed for three articles( Reference de Kroon, Renders and van Wouwe 31 , Reference Santorelli, Petherick and Wright 36 , Reference Steur, Smit and Schipper 37 ). One article performed both internal validation using bootstrapping methods (1000 repetitions) and validation with an external cohort( Reference Santorelli, Petherick and Wright 36 ). Three articles( Reference Classen and Hokayem 30 , Reference Manios, Birbilis and Moschonis 32 , Reference Potter and Ulijaszek 35 ) did not perform internal or external validation.
Prediction tool design
All tools were designed to be administered post-gestation. Risk estimation within two tools could be performed solely by the administering PCC( Reference Timpka, Angbratt and Bolme 29 , Reference de Kroon, Renders and van Wouwe 31 ), with the remaining ten tools requiring variable input from both the administering PCC and mother( Reference Classen and Hokayem 30 , Reference Manios, Birbilis and Moschonis 32 – Reference Druet, Stettler and Sharp 40 ).
Outcome age
Outcome age is the age at which the tool predicts the likelihood of overweight/obesity onset (see Table 2). No tools were designed to predict overweight/obesity development in infancy and young childhood (≤2 years). The outcome age of one tool( Reference Santorelli, Petherick and Wright 36 ) was designated at 2 years; however, the outcome was only ‘risk for childhood obesity’ at a later, unspecified age. Nine of the included tools estimated the risk of overweight/obesity in childhood (age 2–12 years) across singular ages or age ranges: 3 years( Reference Weng, Redsell and Nathan 38 ); 3–6 years( Reference Seyednasrollah, Makela and Pitkanen 39 ); 7 years( Reference Morandi, Meyre and Lobbens 33 , Reference Druet, Stettler and Sharp 40 ); ≤8 years( Reference Classen and Hokayem 30 ); 8 years( Reference Steur, Smit and Schipper 37 ); 9–12 years( Reference Seyednasrollah, Makela and Pitkanen 39 ); 9–13 years( Reference Manios, Birbilis and Moschonis 32 ); ≥9 years( Reference Classen and Hokayem 30 ); 10 years( Reference Timpka, Angbratt and Bolme 29 , Reference Pei, Flexeder and Fuertes 34 ); and 11 years( Reference Druet, Stettler and Sharp 40 ). Only two tools estimated risk of overweight/obesity development in adolescence (age 13–18 years), at 15–18 years( Reference Seyednasrollah, Makela and Pitkanen 39 ) and 16 years( Reference Morandi, Meyre and Lobbens 33 ). Similarly, two tools measured risk of overweight/obesity development in adulthood (age ≥18 years), at 23 years( Reference de Kroon, Renders and van Wouwe 31 , Reference Potter and Ulijaszek 35 ), 33 years( Reference Potter and Ulijaszek 35 ) and 42 years( Reference Potter and Ulijaszek 35 ).
Outcome measure
Obesity was assessed as the single outcome in four tools( Reference Timpka, Angbratt and Bolme 29 , Reference Manios, Birbilis and Moschonis 32 , Reference Seyednasrollah, Makela and Pitkanen 39 , Reference Druet, Stettler and Sharp 40 ) (see Table 2). The combined outcome of overweight and obesity was assessed in seven tools( Reference Classen and Hokayem 30 , Reference de Kroon, Renders and van Wouwe 31 , Reference Morandi, Meyre and Lobbens 33 – Reference Potter and Ulijaszek 35 , Reference Steur, Smit and Schipper 37 , Reference Weng, Redsell and Nathan 38 ). One tool investigated the outcome ‘risk for childhood obesity’( Reference Santorelli, Petherick and Wright 36 ), defined as BMI > 91st percentile at 2 years of age in conjunction with a >1 centile band weight Z-score gain between birth and 2 years of age.
Risk output
Three articles adapted the output of their screening tools to present an estimated percentage likelihood risk of future obesity( Reference de Kroon, Renders and van Wouwe 31 – Reference Morandi, Meyre and Lobbens 33 ). A score output unique to the specific tool was developed within four articles, presented as either numerical or qualitative: Manios et al.( Reference Manios, Birbilis and Moschonis 32 ) (numerical score unique to tool translated into percentage risk of future obesity); Weng et al.( Reference Weng, Redsell and Nathan 38 ) (numerical); Santorelli et al.( Reference Santorelli, Petherick and Wright 36 ) (qualitative – high, medium, low); and Potter and Ulijaszek( Reference Potter and Ulijaszek 35 ) (qualitative – low-risk, fixed-risk, acute-risk, high-risk). Within six included tools( Reference Timpka, Angbratt and Bolme 29 , Reference Classen and Hokayem 30 , Reference Pei, Flexeder and Fuertes 34 , Reference Steur, Smit and Schipper 37 , Reference Seyednasrollah, Makela and Pitkanen 39 , Reference Druet, Stettler and Sharp 40 ), risk estimation was performed via a statistical equation without a score output.
Predictive variables
The mean number of predictive variables in all included tools was 4·92 (sd 3·06; range 1–13). Substantial variability existed between tool variables that largely depended on the type of baseline and outcome data available within each cohort. For a description of predictive variables included within each tool, refer to Table 3.
Table 3 Description of predictive variables within each tool included in the present systematic review of tools to predict infant, childhood and adulthood obesity

sd-score, standard deviation score; GWG, gestational weight gain; WGRS, weighted genetic risk score.
Anthropometric
All tools included at least one anthropometric variable, either from the child only (n 3)( Reference Timpka, Angbratt and Bolme 29 , Reference de Kroon, Renders and van Wouwe 31 , Reference Pei, Flexeder and Fuertes 34 ) or both the child and parent (n 9)( Reference Classen and Hokayem 30 , Reference Manios, Birbilis and Moschonis 32 , Reference Morandi, Meyre and Lobbens 33 , Reference Potter and Ulijaszek 35 – Reference Druet, Stettler and Sharp 40 ). The most common included variable was a maternal measure of weight (n 9), either pre-pregnancy (n 2)( Reference Manios, Birbilis and Moschonis 32 , Reference Weng, Redsell and Nathan 38 ) or current (n 7)( Reference Classen and Hokayem 30 , Reference Morandi, Meyre and Lobbens 33 , Reference Potter and Ulijaszek 35 – Reference Steur, Smit and Schipper 37 , Reference Seyednasrollah, Makela and Pitkanen 39 , Reference Druet, Stettler and Sharp 40 ). The most common child anthropometric variable included was birth weight (n 8), classified as kilograms( Reference Classen and Hokayem 30 , Reference Morandi, Meyre and Lobbens 33 – Reference Potter and Ulijaszek 35 , Reference Steur, Smit and Schipper 37 ), sd-score( Reference Druet, Stettler and Sharp 40 ), quintiles( Reference Weng, Redsell and Nathan 38 ) or Z-scores( Reference Santorelli, Petherick and Wright 36 ).
Socio-economic/sociodemographic
Seven tools included at least one variable of a socio-economic nature( Reference Classen and Hokayem 30 , Reference Manios, Birbilis and Moschonis 32 – Reference Pei, Flexeder and Fuertes 34 , Reference Steur, Smit and Schipper 37 – Reference Seyednasrollah, Makela and Pitkanen 39 ), while a sociodemographic variable was included within five tools( Reference Classen and Hokayem 30 , Reference Manios, Birbilis and Moschonis 32 , Reference Santorelli, Petherick and Wright 36 , Reference Steur, Smit and Schipper 37 , Reference Druet, Stettler and Sharp 40 ). Education level of either the mother( Reference Classen and Hokayem 30 , Reference Manios, Birbilis and Moschonis 32 ) or both parents( Reference Pei, Flexeder and Fuertes 34 ) was the most common socio-economic variable, as was a measure of income, either per household member( Reference Classen and Hokayem 30 ) or as a family( Reference Pei, Flexeder and Fuertes 34 , Reference Seyednasrollah, Makela and Pitkanen 39 ). In terms of demographics, five articles included sex as a tool variable, all associating female gender with a greater risk of overweight/obesity development( Reference Classen and Hokayem 30 , Reference Manios, Birbilis and Moschonis 32 , Reference Santorelli, Petherick and Wright 36 , Reference Steur, Smit and Schipper 37 , Reference Druet, Stettler and Sharp 40 ).
Clinical
Smoking status was the most commonly included clinical predictive variable (n 5), defined as maternal smoking during pregnancy (n 4)( Reference Manios, Birbilis and Moschonis 32 – Reference Pei, Flexeder and Fuertes 34 , Reference Weng, Redsell and Nathan 38 ), maternal smoking (n 1)( Reference Morandi, Meyre and Lobbens 33 ) or smoking in the parental house (n 1)( Reference Steur, Smit and Schipper 37 ). Breast-feeding history was included as a variable within two tools, categorised as either ‘ever breast-fed in first year’ (n 1)( Reference Weng, Redsell and Nathan 38 ) or ‘breast-fed partially or wholly’ (n 1)( Reference Potter and Ulijaszek 35 ).
Two tools( Reference Morandi, Meyre and Lobbens 33 , Reference Seyednasrollah, Makela and Pitkanen 39 ) attempted to enhance the predictive accuracy of anthropometric and socio-economic variables by including genetic variables associated with obesity. Seyednasrollah et al.( Reference Seyednasrollah, Makela and Pitkanen 39 ) derived genetic variables from a genome-wide association study, using significant SNP (n 19) to create a weighted genetic risk score (WGRS19) that was included within the final predictive tool. Morandi et al. ( Reference Morandi, Meyre and Lobbens 33 ) selected thirty-nine SNP related to obesity, creating a cumulative genotype score by summing the number of risk alleles.
Prediction tool performance
Table 4 details the predictive statistical outcomes of each included tool. Only two studies( Reference Morandi, Meyre and Lobbens 33 , Reference Steur, Smit and Schipper 37 ) provided all three metrics (calibration, discrimination and decision-curve analysis) pertinent to assessing predictive performance, as described by the ABCD framework( Reference Steyerberg and Vergouwe 24 ). Discrimination was more frequently reported, with nine out of twelve studies measuring AUC( Reference Classen and Hokayem 30 – Reference Morandi, Meyre and Lobbens 33 , Reference Santorelli, Petherick and Wright 36 – Reference Druet, Stettler and Sharp 40 ). For decision-curve analysis, ten out of twelve studies reported sensitivity and specificity values( Reference Timpka, Angbratt and Bolme 29 – Reference Pei, Flexeder and Fuertes 34 , Reference Santorelli, Petherick and Wright 36 – Reference Weng, Redsell and Nathan 38 , Reference Druet, Stettler and Sharp 40 ). Eight of twelve studies included PPV and/or NPV statistical outcomes( Reference Timpka, Angbratt and Bolme 29 , Reference de Kroon, Renders and van Wouwe 31 , Reference Morandi, Meyre and Lobbens 33 , Reference Pei, Flexeder and Fuertes 34 , Reference Santorelli, Petherick and Wright 36 – Reference Weng, Redsell and Nathan 38 , Reference Druet, Stettler and Sharp 40 ). Potter and Ulijaszek( Reference Potter and Ulijaszek 35 ) did not perform any statistical analyses related to predictive accuracy, instead calculating odds ratios and relative risks for the development of adulthood overweight/obesity within each risk group (low-risk; fixed-risk; acute-risk; high-risk). Due to the quantity of calculations and their heterogeneity to the other included articles, the results are not presented here.
Table 4 Predictive statistical outcomes, according to the ABCD frameworkFootnote *, of each tool included in the present systematic review of tools to predict infant, childhood and adulthood obesity

AUC, area under the receiver operating characteristic curve; PPV, positive predictive value; NPV, negative predictive value; WGRS, weighted genetic risk score.
* If internal or external tool validation was performed, only these quantitative outcomes have been reported, rather than also including the quantitative outcomes of the tool’s development phase. If validation was not performed, the quantitative values in Table 4 are outcomes of the tool’s development phase only.
† Strength of discriminative accuracy was determined as: inadequate if AUC<70 %; adequate if AUC=70–80 %; and excellent if AUC> 80%.
‡ Where predictive statistical analyses had been performed using multiple decision thresholds for each tool, quantitative data were extracted from the median cut-off point only and rounded up where appropriate. Where the author has not designated a decision threshold, this cell has been left blank.
§ Tool validation completed.
║ Tool is administered at ages: Equation 1 at 6 (sd 1·5) months; Equation 2 at 9 (sd 1·5) months; Equation 3 at 12 (sd 1·5) months.
¶ Tool is administered at the upper age threshold.
Calibration
The two studies( Reference Morandi, Meyre and Lobbens 33 , Reference Steur, Smit and Schipper 37 ) that reported calibration outcomes used the Hosmer–Lemeshow test for goodness-of-fit. Similar values were reported for Morandi et al. ( Reference Morandi, Meyre and Lobbens 33 ) and Steur et al. ( Reference Steur, Smit and Schipper 37 ), at P=0·33 and P=0·3, respectively. This indicates that their models’ predictions of weight outcome were consistently correct( Reference Hosmer, Lemeshow and Sturdivant 41 ). No studies reported the calibration outcomes of calibration-in-the-large or calibration slope as per the ABCD framework( Reference Steyerberg and Vergouwe 24 ).
Discrimination
Only three tools achieved an excellent( Reference Lee, Bang and Kim 25 ) AUC outcome or higher: Santorelli et al. ( Reference Santorelli, Petherick and Wright 36 ), at 85·8 % (Equation 1), 86·1 % (Equation 2) and 91·1 % (Equation 3); Morandi et al. ( Reference Morandi, Meyre and Lobbens 33 ) (obesity prediction tool only), at 85 %; and de Kroon et al. ( Reference de Kroon, Renders and van Wouwe 31 ) (boys aged 2–6 years only, predicting to age 23 years), at 83 %. As an example, in practice this means the tool of Morandi et al. ( Reference Morandi, Meyre and Lobbens 33 ) can accurately predict childhood obesity, at age 7–16 years, 85 % of the time. The highest discriminative accuracy outcome achieved for five of nine tools reporting AUC was adequate( Reference Classen and Hokayem 30 , Reference Steur, Smit and Schipper 37 – Reference Druet, Stettler and Sharp 40 ), with only Manios et al. ( Reference Manios, Birbilis and Moschonis 32 ) demonstrating inadequate discriminative accuracy (63·8 %) for their tool predicting obesity at age 9–13 years.
In tools that assessed discriminative accuracy outcomes for both obesity and overweight and obesity, the outcome of obesity was associated with stronger predictive performance. Morandi et al. ( Reference Morandi, Meyre and Lobbens 33 ) achieved an excellent AUC value (85 %) for their obesity prediction tool, but an adequate AUC value for their overweight and obesity tool (75 %). Classen and Hokayem( Reference Classen and Hokayem 30 ) demonstrated adequate discriminative accuracy for their obesity prediction tool, but inadequate discriminative accuracy for their overweight tool. The excellent AUC value of de Kroon et al.’s( Reference de Kroon, Renders and van Wouwe 31 ) model (83 %) (boys aged 2–6 years, predicting to age 23 years) could not be replicated among their other prediction models, with all others achieving adequate AUC values.
Decision-curve analysis
Morandi et al.( Reference Morandi, Meyre and Lobbens 33 ), Santorelli et al.( Reference Santorelli, Petherick and Wright 36 ) and Weng et al.( Reference Weng, Redsell and Nathan 38 ) reported the highest sensitivity values of all tools at 79 % (obesity tool), 77 % (Equation 3) and 76·9 %, respectively. Again, using Morandi et al. ( Reference Morandi, Meyre and Lobbens 33 ) as an example, their tool would predict childhood obesity, at age 7–16 years, correctly in 79 % of children initially assessed at baseline. The corresponding specificity for each of these tools was similarly strong for Morandi et al. ( Reference Morandi, Meyre and Lobbens 33 ) (75·5 %) and Santorelli et al. ( Reference Santorelli, Petherick and Wright 36 ) (85·2 %), while not as strong for Weng et al. ( Reference Weng, Redsell and Nathan 38 ) (66·5 %). In the tool of Morandi et al. ( Reference Morandi, Meyre and Lobbens 33 ), 75·5 % of children assessed at baseline would be correctly predicted to not develop childhood obesity. Of the ten studies reporting decision-curve analysis, two did not report a corresponding decision threshold related to the tool’s sensitivity and specificity values( Reference Timpka, Angbratt and Bolme 29 , Reference Pei, Flexeder and Fuertes 34 ), meaning it was unclear how the sensitivity and specificity values would be prioritised to inform clinical decisions.
Clinical relevance
The immediate translatability of the developed prediction tool to clinical practice was mentioned within five studies( Reference de Kroon, Renders and van Wouwe 31 – Reference Morandi, Meyre and Lobbens 33 , Reference Santorelli, Petherick and Wright 36 , Reference Steur, Smit and Schipper 37 ). Within three of these( Reference de Kroon, Renders and van Wouwe 31 , Reference Manios, Birbilis and Moschonis 32 , Reference Steur, Smit and Schipper 37 ), a risk graph or chart was developed for clinical use to provide an output of estimated risk. Morandi et al. ( Reference Morandi, Meyre and Lobbens 33 ) developed a spreadsheet-based risk calculator with an output of percentage estimated risk. Santorelli et al. ( Reference Santorelli, Petherick and Wright 36 ) integrated their prediction tool within an app, ‘Healthy Infant Weight?’; however, at the time of review, this app was not available for download.Footnote * Those studies that did not mention tool translatability to clinical practice developed a statistical prediction equation only( Reference Timpka, Angbratt and Bolme 29 , Reference Classen and Hokayem 30 , Reference Pei, Flexeder and Fuertes 34 , Reference Potter and Ulijaszek 35 , Reference Weng, Redsell and Nathan 38 – Reference Druet, Stettler and Sharp 40 ).
Predictor variable data collection was achieved by combined self-report and medical record access for five prediction tools( Reference Manios, Birbilis and Moschonis 32 – Reference Pei, Flexeder and Fuertes 34 , Reference Weng, Redsell and Nathan 38 , Reference Druet, Stettler and Sharp 40 ). Methods of only self-report and medical record access were appropriate within two prediction tools( Reference Potter and Ulijaszek 35 , Reference Steur, Smit and Schipper 37 ) and one prediction tool( Reference Santorelli, Petherick and Wright 36 ), respectively. Two prediction tools required only anthropometric measurement of the individual( Reference Timpka, Angbratt and Bolme 29 , Reference de Kroon, Renders and van Wouwe 31 ). One prediction tool required the collection of a genetic variable in the form of obesity-related SNP( Reference Seyednasrollah, Makela and Pitkanen 39 ). The tool of Classen and Hokayem( Reference Classen and Hokayem 30 ) included an indication of child depression and therefore required a clinical assessment component.
Only one prediction tool( Reference Santorelli, Petherick and Wright 36 ) provided a component beyond risk prediction, with the addition of relevant educational material and resource links for those identified as high-risk. No tool described a relevant referral pathway, to either a tertiary or primary care health service, or a community-based preventive or treatment programme, for individuals identified as high-risk.
Discussion
The current systematic review provides a comprehensive summary of known available tools designed to predict overweight/obesity via an estimation of risk. Twelve tools were developed within specific populations, with nine( Reference Timpka, Angbratt and Bolme 29 , Reference de Kroon, Renders and van Wouwe 31 , Reference Morandi, Meyre and Lobbens 33 , Reference Pei, Flexeder and Fuertes 34 , Reference Santorelli, Petherick and Wright 36 – Reference Druet, Stettler and Sharp 40 ) of these having been validated either using internal or external methods, or a combination of both. The prediction tools developed and validated by Morandi et al. ( Reference Morandi, Meyre and Lobbens 33 ) and Steur et al. ( Reference Steur, Smit and Schipper 37 ) were assessed as the strongest overall, secondary to: strong congruency with the ABCD framework for assessing prediction tool validity; adequate–excellent discriminative accuracy; internal( Reference Morandi, Meyre and Lobbens 33 , Reference Steur, Smit and Schipper 37 ) and external( Reference Morandi, Meyre and Lobbens 33 ) tool validation; and relevance to current clinical practice.
Prediction tool performance
Assessing the validity of a prediction tool does not solely rest with its applicability to multiple settings. Robust reporting of outcomes pertinent to predictive performance is crucial in the development of any prediction tool. Following the ABCD framework( Reference Steyerberg and Vergouwe 24 ) for assessing prediction tool validity, only two studies( Reference Morandi, Meyre and Lobbens 33 , Reference Steur, Smit and Schipper 37 ) were identified as having reported all outcomes necessary: calibration; discrimination; and decision-curve analysis. Despite this, the calibration metric described within these two studies has been demonstrated as inappropriate: the Hosmer–Lemeshow goodness-of-fit test is not recommended as P value outputs can vary by sample size and are thus deemed imprecise( Reference Steyerberg and Vergouwe 24 ). Instead, calibration-in-the-large and assessment of the calibration slope is recommended( Reference Steyerberg and Vergouwe 24 ). Poor methodological considerations and inadequate reporting of all measures necessary to assess prediction tool performance are consistent across multiple diseases and settings, not just overweight/obesity, as identified in a recent systematic review( Reference Bouwmeester, Zuithoff and Mallett 42 ).
Discriminative accuracy (AUC %) was the most commonly reported statistical outcome relevant to predictive performance. Excellent discriminative accuracy is expected in tools which predict overweight/obesity as a proximal outcome. Equation 3, a prediction tool of Santorelli et al. ( Reference Santorelli, Petherick and Wright 36 ) designed to be administered at 12 (sd 1·5) months to predict the risk of childhood obesity at 2 years of age, achieved the highest AUC value at 91·1 %. Notably, only the outcome of ‘risk for childhood obesity’ is associated with this prediction tool, rather than the actual outcome of obesity. No follow-up anthropometric data were collected at a later time point in childhood and no age range was specified for ‘childhood obesity’. Similarly, in their prediction of persistent childhood obesity (i.e. obesity at ages 7 and 16 years), Morandi et al. ( Reference Morandi, Meyre and Lobbens 33 ) produced an excellent AUC outcome (85 %), which is also expected considering the high likelihood of childhood obesity tracking into adolescence( Reference Evensen, Emaus and Kokkvoll 14 ).
In its mere classification of individuals who develop overweight/obesity compared with those who do not, discriminative accuracy is not a true indicator of clinical usefulness. When determining the overall goal of the tool, consequences secondary to false negative and false positive predictions also need to be considered( Reference Mallett, Halligan and Thompson 43 ). Designation of the decision threshold (cut-off point) is a subjective decision at the discretion of the end user, informed by the priority assigned to high or low sensitivity and specificity values. Consideration needs to be made for the tool’s overall impact on health service delivery; the decision threshold should be assigned based on characteristics of the health system in which the predictive tool is to be embedded( Reference Steyerberg and Vergouwe 24 ). For example, Timpka et al. ( Reference Timpka, Angbratt and Bolme 29 ) prioritised strong specificity in order to avoid unnecessary interventions, reducing health system burden and cost. Other end users may prioritise sensitivity to maximise the number of children identified who will go on to develop overweight/obesity and thus be highly eligible for preventive intervention. This approach, however, may be feasible only for health systems with access to an evidence-based preventive intervention.
Considering the low prevalence of weight discussion and overweight/obesity diagnosis in a paediatric clinical setting( Reference Campbell, Bryson and Wake 44 ), the availability of a structured, user-friendly and outcomes-based platform to a clinician may also simply encourage the discussion of weight with families and children. This action in itself improves clinical service delivery and may lead to appropriate intervention. Prior to the development of a clinically relevant prediction tool, clinicians can also begin to identify the strongest predictors for overweight/obesity as part of routine clinical practice. Predictors most commonly included in the tools of the present review, such as maternal overweight/obesity, high birth weight, low parental education and maternal smoking during pregnancy, can be assessed by the clinician to inform an overall, subjective risk assessment to influence preventive clinical decisions.
Two articles( Reference Morandi, Meyre and Lobbens 33 , Reference Seyednasrollah, Makela and Pitkanen 39 ) attempted to enhance their prediction tool with the addition of genetic risk factors derived from a genome-wide association study. The addition of a cumulative genetic score based on thirty-nine obesity pre-disposing SNP did not improve discriminative accuracy of Morandi et al.’s( Reference Morandi, Meyre and Lobbens 33 ) tool compared with using traditional risk factors alone and was excluded as a variable in the final tool. Conversely, Seyednasrollah et al. ( Reference Seyednasrollah, Makela and Pitkanen 39 ) reported that inclusion of a weighted genetic risk score based on nineteen SNP slightly improved the predictive accuracy of the tool compared with clinical factors alone (AUC 76·9 % v. 74·7 %) in both the development and validation cohorts for children aged 3–6 years. Globally, only limited added clinical value has been reported for the use of genetic factors in accurately predicting adulthood obesity( Reference Juonala, Juhola and Magnussen 45 ). Potential exists for genetic factors to add strength to prediction tools; however, the clinical utility of such tools is questionable, considering the timely process involved with obtaining, securing and analysing genetic data.
Clinical relevance
For the successful dissemination of a health service innovation within a clinical setting, a combination of quantitative and qualitative development, implementation and evaluation processes is necessary( Reference Damschroder, Aron and Keith 46 ). Five prediction tools( Reference de Kroon, Renders and van Wouwe 31 – Reference Morandi, Meyre and Lobbens 33 , Reference Santorelli, Petherick and Wright 36 , Reference Steur, Smit and Schipper 37 ) included within the review had been modified with the intention of integration into clinical practice, via a risk graph/chart, spreadsheet-based calculator or app. Despite this, there had been no known attempt by the authors to progress to widespread clinical uptake within the health-care sector. It remained unclear how the prediction tools may integrate with population electronic health systems, PCC practice management software or the Internet. While these tools could theoretically be used within current practice, issues remain, including: perceived usability; clinician awareness and uptake; clinician access to required child and maternal anthropometric data; potential need to upskill existing PCC and train new PCC; the effect on clinician behaviour change, including the tool’s influence on clinical decision making; as well as actual overweight/obesity outcomes for all children exposed to the tool.
In developing a clinically valid overweight/obesity prediction tool, the most appropriate outcome age for preventive success needs to be determined. Prediction during adolescence may be a suitable medium between childhood and adulthood. Within the analysis of their large-sampled longitudinal cohort (n 17 638), Potter and Ulijaszek( Reference Potter and Ulijaszek 35 ) identified that a large proportion of measured overweight/obese adults did not present as overweight/obese in childhood (aged 11 years). This is consistent with findings of a recent systematic review and meta-analysis( Reference Simmonds, Burch and Llewellyn 9 ), demonstrating that childhood weight status is a poor predictor of adulthood weight status: 70 % of obese adults were not obese as children. There is considerable evidence, however, supporting the association between adolescent overweight/obesity and adulthood overweight/obesity( Reference Guo, Huang and Maynard 47 – Reference Wang, Chyen and Lee 50 ). Additionally, adolescent overweight/obesity is strongly and consistently associated with adulthood morbidity, including CVD( Reference Llewellyn, Simmonds and Owen 51 , Reference Park, Falconer and Viner 52 ) and type 2 diabetes mellitus( Reference Llewellyn, Simmonds and Owen 51 , Reference Narayan, Boyle and Thompson 53 ). The outcome of adolescent overweight/obesity may be proximal enough to ensure adequate predictive accuracy, yet distal enough to encompass prediction of adulthood obesity and chronic disease in certain cases.
Prediction tool development needs to consider the optimal time point for tool administration. Tools that require the input of predictor variables in late childhood, such as those by de Kroon et al. ( Reference de Kroon, Renders and van Wouwe 31 ) (age 6 years) and Potter and Ulijaszek( Reference Potter and Ulijaszek 35 ) (age 11 years), arguably provide an estimation of risk that is too late to elicit a preventive benefit. Modifiable predictors within infancy, such as prolonged breast-feeding exclusivity and duration( Reference Horta, Loret de Mola and Victora 17 , Reference Owen, Martin and Whincup 54 , Reference Yan, Liu and Zhu 55 ), as well as appropriate timing of introduction to solids (approximately 6 months of age)( Reference Lin, Leung and Lam 56 , Reference Wang, Wu and Xiong 57 ), have been demonstrated as protective against future overweight/obesity. Additionally, the ability of a prediction tool to be administered at multiple time points is highly desirable, such as the tool of Santorelli et al. ( Reference Santorelli, Petherick and Wright 36 ). The variability of health service visits in the early years is high between individuals. It is unrealistic to expect all infants or young children to be assessed for overweight/obesity risk at exactly the same time point( Reference Santorelli, Petherick and Wright 36 ). A prediction tool validated only for administration at one time point may miss high-risk individuals who would have benefited from preventive intervention.
The concurrent availability of a cost-effective, evidence-based preventive intervention and/or referral pathway for individuals identified as high-risk is critical for a clinically embedded obesity prediction tool. Santorelli et al. ( Reference Santorelli, Petherick and Wright 36 ) developed the only prediction tool to incorporate a component beyond risk prediction, with the inclusion of generic, evidence-based recommendations for healthy eating, physical activity and positive parenting behaviours within their app. To embed an electronic tool within clinical practice creates capacity to integrate individualised recommendations based on risk output. Potential exists for further risk-determined customisation, perhaps providing a referral pathway for the clinician to action, a recommendation to emphasise positive early feeding habits or the encouragement of frequent anthropometric monitoring by the clinician.
Strengths and limitations of included articles
A number of limitations were seen as trends across all included articles. All studies were conducted in high-income countries. Multiple articles were restricted in their choice of tool variables. Depending on the cohort used to inform the prediction tool, only certain baseline variables and outcome measures were accessible, potentially limiting the accuracy and scope of the tool. None of the included articles measured body composition as indicators of overweight/obesity outcomes. In addition, there was considerable heterogeneity in each study’s justification for including its predictive variables, with most only extracting the strongest variables observed within a single cohort( Reference Timpka, Angbratt and Bolme 29 , Reference Manios, Birbilis and Moschonis 32 , Reference Morandi, Meyre and Lobbens 33 , Reference Santorelli, Petherick and Wright 36 , Reference Seyednasrollah, Makela and Pitkanen 39 ) and some providing no justification( Reference Classen and Hokayem 30 , Reference de Kroon, Renders and van Wouwe 31 ). A strength of all included articles was the large sample sizes commonly used within both the development and validation phases.
Limitations of review
The principal limitation of the present review was the inability to perform a quantitative synthesis of the tools’ predictive strength. The heterogeneity observed in each tool’s outcome measure, diagnostic criteria used, outcome age and chosen methods of statistical analysis suited a qualitative approach. While no articles were excluded secondary to a low quality rating, only one included article achieved a high quality rating, potentially subjecting the review to bias. Additionally, the review focused solely on studies detailing the development and validation of prediction tools and thus excluded any follow-up validation performed.
Conclusions
The current systematic review is the first of its kind aiming to determine the availability, clinical relevance and validity of tools to predict overweight/obesity development across the life course. Our findings indicate that further research should prioritise the following: optimising the predictive strength of currently available, population-specific tools; improving the immediate clinical applicability of existing prediction tools; and the methodologically robust development of new prediction tools in novel countries and settings. Following, investigation into the use of a validated prediction tool concurrently with an overweight/obesity preventive intervention for subjects identified as high-risk could be considered. Clinicians can act now to identify strong predictors, in infancy, for future overweight/obesity, such as maternal overweight/obesity and high birth weight. The successful integration of an overweight/obesity prediction tool within clinical practice may be a valid front-line preventive strategy to assist in decreasing overweight/obesity prevalence.
Supplementary material
To view supplementary material for this article, please visit https://doi.org/10.1017/S1368980018001684
Acknowledgements
Acknowledgements: The authors are grateful to Ms Jane Smeathers, The University of Queensland librarian, for her assistance in refining the electronic search strategy. Financial support: This research received no specific grant from any funding agency in the public, commercial or not-for-profit sectors. O.J.C. is supported by an Australian Government Research Training Program (RTP) Scholarship. Conflict of interest: None. Authorship: O.J.C., R.L. and J.L.W. conceptualised the review. O.J.C. collected the data and drafted the manuscript. R.L., O.R.L.W. and J.L.W. critically revised all parts of the manuscript. All authors approved the final version of the manuscript. Ethics of human subject participation: Not applicable.


