


Poor diet quality is common among school-aged children aged 5 to 9 years in many low- and middle-income countries (LMIC)(Reference Kupka, Siekmans and Beal1–Reference Lassi, Moin, Bhutta, Bundy, de Silva and Horton3). Nutritionally adequate diets are composed of a diversity of food groups and are rich in critical micronutrients, such as I, Zn, vitamin B12, and Fe(Reference Yakoob and Lo4–Reference Kennedy, Pedro and Seghieri8). In LMIC, higher dietary diversity has been associated with improved nutritional status in children(Reference Arimond and Ruel7,Reference Kennedy, Pedro and Seghieri8) . Micronutrient deficiencies in school-aged children are associated with detrimental health and developmental outcomes, including effects on immune function and cognition(Reference Tulchinsky9–Reference Osendarp, Baghurst and Bryan15).
Children of smallholder farmers in LMIC, often located in rural poor regions, are at risk of undernutrition for reasons including poverty, lack of access to water and sanitation, and poor nutrition(16). Increasing the diversity of crop production has been proposed as an intervention to improve the diet quality of smallholder farming households in LMIC(Reference Declerck, Fanzo and Palm17,Reference Fanzo, Hunter and Borelli18) . A growing body of literature has demonstrated a small, yet consistent, positive association between household-level crop diversity and individual-level dietary diversity(Reference Jones19,Reference Sibhatu and Qaim20) . Most of these studies have used cross-sectional designs from which a causal link between crop diversity and dietary diversity cannot be established. Other studies have used an instrumental variable to account for endogeneity and explore causal linkages, though the strong assumptions of instrumental variables mean casual interpretations must be made with caution(Reference Dillon, McGee and Oseni21–Reference Lovo and Veronesi25). Furthermore, while many studies have been conducted in a variety of contexts within sub-Saharan Africa(Reference Jones19), fewer have been conducted in Southeast Asia (only three in Vietnam specifically(Reference Pellegrini and Tasciotti26–Reference Timler, Alvarez and DeClerck28)), thus potentially limiting the generalisability of the findings to this region. A meta-analysis found that although the associations between crop diversity and dietary diversity were consistently statistically significant and positive among studies from sub-Saharan Africa, associations in Asia and other regions were statistically significant among only some indicators of dietary diversity(Reference Sibhatu and Qaim20).The authors attributed this difference to the high reliance on subsistence agricultural production (i.e. production for own consumption) and low market accessibility on average within sub-Saharan Africa relative to other regions(Reference Sibhatu and Qaim20).Further examination of the geographic heterogeneity of the association is important because food systems are diverse across geographic regions. The studies examining this association in Asia do not address all contextual nuances of the food systems across the region. More studies of this association from Southeast Asia in particular are warranted, given that the food system context (economics, infrastructure and ecology) varies from sub-Saharan Africa.
Regardless of the context, the mechanisms underlying the association between crop diversity and dietary diversity are not well established(Reference Jones19,Reference Sibhatu and Qaim20,Reference Jones29–Reference Johns and Sthapit31) . There are two primary pathways through which crop diversity is hypothesised to influence diet diversity: the subsistence and market pathways. The subsistence pathway proposes that, among households consuming at least some of the food they grow, diversifying agricultural production can directly contribute to the dietary diversity of the household members(Reference Carletto, Ruel and Winters30). The market pathway hypothesises that crop diversification generates revenue from the sale of produced crops, thus allowing for the purchase of diverse foods that contribute to dietary diversity(Reference Carletto, Ruel and Winters30–Reference Sibhatu and Qaim32). However, because smallholder farmers often grow crops for both sale and own consumption, in practice, these pathways occur simultaneously(Reference Carletto, Ruel and Winters30,Reference Wiggins, Argwings-Kodhek and Gebreselassie33) . Recent data from three countries of sub-Saharan Africa in fact indicate that market participation among smallholder farmers is high (68 %, 80 % and 90 % of farming households in the study countries, respectively, engage in sales of agricultural production), while at the same time these households keep a large proportion of their production for own consumption and other uses(Reference Carletto, Corral and Guelfi34). In most contexts, it is not clear which of the two hypothesised pathways noted above may predominate or under which conditions when assessing the potential for agricultural diversity to influence diets.
Furthermore, analyses of those socio-economic and contextual factors that may modify the association between crop diversity and dietary diversity are limited. Some studies have tested the extent to which household wealth, market accessibility and the market orientation of agricultural production modify the association of crop diversity with dietary diversity(Reference Hirvonen and Hoddinott23,Reference Sibhatu, Krishna and Qaim35–Reference Jones, Creed-Kanashiro and Zimmerer38) . In Nepal, positive associations of crop diversity with dietary diversity were found among all children over 24 months of age and among children aged 18 to 23 months from poorer households, but no associations were found among children under 18 months old(Reference Mulmi, Masters and Ghosh37). A study in rural Ethiopia found that associations between crop diversity and the dietary diversity of preschool-aged children varied by distance from agricultural markets; statistically significant positive associations were observed among households with limited access to agricultural markets, but not among households located close to a market(Reference Hirvonen and Hoddinott23). In Malawi, a longitudinal study of crop diversity and household dietary diversity found that the positive association between these two variables was strongest among poorer households, but that neither the market orientation of farms nor distance to markets modified the association(Reference Jones29). Studies have identified differences in the associations of crop diversity and dietary diversity by household wealth and market access, but the influence of geographic region on this heterogeneity is not well established(Reference Hirvonen and Hoddinott23,Reference Mulmi, Masters and Ghosh37) .
Overall, more research is necessary to quantify heterogeneity among the hypothesised pathways linking agricultural diversification and dietary change across contexts and to improve understanding of the contexts in which this association has the strongest magnitude. Such evidence is needed to ensure crop diversification interventions are targeted to the appropriate settings and to understand the co-factors that may need to be present or absent for such interventions to be of most benefit to populations. This study contributes to addressing these knowledge gaps firstly by using longitudinal data to examine the association between crop diversity and diet diversity in two diverse food systems and economic contexts: Ethiopia and Vietnam. These two countries were selected because in both countries a high proportion of the population is employed as smallholder farmers and yet, between countries, there are large differences in relative wealth, market strength, child nutritional outcomes and agricultural production diversity(39–Reference Sibhatu and Qaim42). Secondly, based on the theoretical framework described above and guided by a priori hypotheses, we empirically test previously hypothesised moderation and mediation of this association(Reference Jones19). We assess heterogeneity in these associations by household food consumed from own harvest and household wealth and examine the extent to which the relative market orientation of farms (proxied by agricultural earnings and subsistence food consumption) mediates the association between crop diversity and diet diversity among children using path analyses.
The primary objectives of this study then were (1) to estimate and compare associations between crop diversity and child diet diversity in Ethiopia and Vietnam among school-aged children (aged 5 and 8 years) from agrarian rural households, (2) to assess potential differences in these associations by household food consumed from own harvest and household wealth and (3) to determine whether the market orientation of farms (i.e. the extent to which crops are produced for sale v. subsistence) mediates this association.
We hypothesised that among agrarian rural households in Vietnam and Ethiopia: (1) household-level crop diversity is positively associated with child dietary diversity; (2) that this association is strongest among poorer households and those that consume more food from own harvest and (3) that the relative market orientation of farms mediates this association in both contexts.
Methods
Study design and participants
This secondary data analysis used repeated measures data from two of the countries in the Young Lives (YL) younger cohort. YL is a 15-year longitudinal study established by the University of Oxford that followed approximately 8000 younger children in 4 LMIC – Ethiopia, India, Peru and Vietnam(43). In this study, we used data only from Ethiopia and Vietnam, given the variability in their food systems and economic contexts. In 2002, the YL team recruited 2000 children aged between 6 and 18 months from each country and conducted a baseline survey. These baseline data included data on numerous household characteristics, but no data on household crop production. The baseline survey was followed by two rounds of follow-up data collection targeting the same children from the baseline survey when they were aged 4·5 to 5·5 years (2006–2007) and 7·5–8·5 years (2009–2010). This study used these two rounds of follow-up data, which included data on household crop production(Reference Boyden44–Reference Boyden46).
The YL research team used a multi-stage, pro-poor sampling design as described elsewhere(Reference Barnett, Ariana and Petrou47). The YL study was not intended to be nationally representative but rather to provide data on children in poor areas of each country. To achieve this aim, in Ethiopia and Vietnam, 20 sentinel sites were non-randomly selected with oversampling among poor areas, in consultation with local officials, to ensure a representative sample of the diversity of regions, cultures and living conditions in the respective countries(Reference Barnett, Ariana and Petrou47,Reference Barnett, Ariana and Petrou48) . Within each sentinel site, the YL team randomly selected approximately 100 households with a child born in 2001–2002, to achieve a sample of 2000 children (each child from a different household) from each country. Fewer than 2 % of the randomly selected households refused to participate. From baseline to the second follow-up, 5·7 % and 2·2 % of the sampled children were lost to follow up in Ethiopia and Vietnam, respectively(Reference Barnett, Ariana and Petrou47).
For this analysis, the sample was restricted to households who reported growing at least one crop during both follow-up rounds of data collection (Ethiopia, n 1049; Vietnam, n 1137). Urban households (n 25 in Ethiopia and n 21 in Vietnam) were excluded. Children with incomplete covariate information (n 11 in Ethiopia and n 26 in Vietnam) and missing outcome information (n 1 in Ethiopia and n 6 in Vietnam) were also excluded. The final analytical sample size was 1012 for Ethiopia and 1083 for Vietnam.
Study context
Child undernutrition is highly prevalent in Ethiopia (41 % of preschool-aged children were either stunted or wasted in 2019), though data are limited on the nutritional status of school-aged children(Reference Kupka, Siekmans and Beal1,39) . In rural regions, only 10 % of children under 5 years of age have a minimally diverse diet and in the lowest wealth quintile only 6·5 % achieve this minimum(39). Amidst endemic food insecurity, drought and persistent poverty, Ethiopia’s diverse agroecological zones promote highly diversified crop production that includes predominantly subsistence crops and, to a lesser extent, cash crops(Reference Sibhatu and Qaim42,Reference Baye49–51) . In rural regions, as much as 58 % of household energies come from subsistence production(Reference Sibhatu and Qaim42).The majority of smallholder farmer household income (72 %) in Ethiopia comes from crop production, though yields per hectare lag behind those of other countries, such as Vietnam, where overall food yields per hectare among smallholder farmers are four times higher than that of Ethiopia(Reference Rapsomanikis40,Reference Bachewe, Berhane and Minten52) . Persistently unreliable and/or inaccessible markets limit agricultural earnings of Ethiopian’s smallholder farmers(Reference Dorosh and Rashid53). In Vietnam, national GDP has increased steadily since the economic reforms initiated in 1986 with parallel reductions in poverty, child nutrition, improvements in household welfare and increases in urbanisation(Reference Dollar, Glewwe and Agrawal54). While in 1994, 53 % of children under 5 years of age were stunted, in 2017, this prevalence had dropped to 24 %(39). As in Ethiopia, data on the nutritional status of school-aged children are limited in Vietnam(Reference Kupka, Siekmans and Beal1). Despite nutritional improvements though, among the poor and in rural regions of Vietnam, diet quality remains poor(Reference Thang and Popkin41). For example, in the poorest wealth quintile, 35 % of children aged 0–23 months had a minimally diverse diet compared to nearly 70 % achieving this benchmark in the highest wealth quintile(39). Vietnam continues to be an agrarian nation with 43 % of the population engaged in agriculture(Reference Schenck55). Rice dominates Vietnam’s agricultural production, resulting in specialised agronomic production relative to that of Ethiopia(Reference Sibhatu and Qaim42).
Measurement of variables
Primary outcome measure: child diet diversity
A qualitative 24-h recall conducted during 1 d for each follow-up round of data collection. The YL researchers asked the survey respondent, identified as the adult caregiver of the index child, to report which food groups that the child consumed foods from in the last 24 h. These questions included examples of local foods from each of the food groups to improve survey comprehension. To assess child diet diversity, we created a diet diversity score (DDS) by counting the number of food groups consumed by each child in the previous 24 h out of a total of seven including: (1) starchy staples (cereals, roots and tubers); (2) legumes and nuts; (3) vegetables; (4) fruits; (5) eggs; (6) milk and milk products; and (7) meat, poultry and fish. We adapted these seven food groups from the Minimum Dietary Diversity for Women (MDD-W) indicator, a proxy for population-level dietary micronutrient sufficiency among adult women. We chose to adapt food groups from the MDD-W given evidence that the MDD-W is a valid measure of diet diversity among school-aged children(Reference Caswell, Talegawkar and Siamusantu56). We used seven rather than the ten food groups of the MDD-W, given that the food groups included in the YL survey were not consistent between the two rounds of data collection. The seven food groups that we used in the study were those that were consistent across the data collection rounds. These seven food groups also align closely with those food groups included in the calculation of the minimum dietary diversity indicator for children(57). See Appendix A for detailed information about the calculation of the DDS.
Primary independent variable: household crop diversity
The caregiver reported all crops grown in the last 12 months at each round of data collection. Some reported growing other unnamed crops for each food group (i.e. other fruits or other vegetables), each of which was counted as one additional species. In Vietnam, 2009–2010, all households reported only the four main crops grown by the household in the last agricultural year. Lacking a single standardised tool for determining crop diversity, we used two complementary indicators of crop diversity based on the previous literature: (1) crop species richness (CSR) and (2) plant crop nutritional functional richness (CNFR)(Reference Jones29,Reference Remans, Flynn and DeClerck58,Reference Berti59) . CNFR was introduced as an extension of functional diversity richness, a biodiversity metric weighted by the number of functional traits of the species in the area, to quantify nutritional diversity of agroecosystems(Reference Remans, Flynn and DeClerck58). CSR was assessed as a count of the unique crop species grown (i.e. plants only) in the last 12 months. To create the plant CNFR indicator, each crop produced was assigned to one of four corresponding nutritional functional groups: (1) starchy staples; (2) legumes and nuts; (3) fruits; and (4) vegetables. These groups correspond to the nutritional groups used in the DDS. Animal source food groups (i.e. meat and fish, eggs, and dairy) were excluded from the CNFR indicator because no data were collected on the production of these foods from livestock.
Covariates
The caregiver reported the total earnings from sales of each crop in the last 12 months in the local currency. For consistency in measurement across rounds, monetary agricultural earnings from the third round were deflated to second round values of the currency. YL provided this conversion for household expenditures variable, and we applied this same conversion ratio to the agricultural earnings variable(Reference Marion60). For comparisons across countries, we converted these values to US dollars using the average conversion rate for the year of data collection. Crop earnings by household were summed for each DDS food group and an additional ‘sugar, spices and non-edible cash crops’ group. The caregiver reported the amount of cultivated land (reported as either land containing a garden or land dedicated to agriculture) in local units which were converted to hectares. No information on agricultural earnings or plot size was collected from Vietnamese households in 2009–2010.
We calculated the proportion of household food consumed from own agricultural production (a proxy for subsistence orientation) as a ratio of the value of food sourced from own production to the total value of the food consumed. These data came from the estimated value and source of food consumed from each food group consumed by the household from the last 15 d.
The YL researchers created a composite wealth index (WI), from 0 to 1. The WI was calculated as the average of three other indexes (i.e. housing quality, access to services and consumer durables scores). Its construction is based on the WI of the UNICEF Multiple Indicator Cluster Surveys and has been described previously(Reference Briones61). A zero WI score implies inadequate housing (including overcrowding, unfinished floor material, lacking a sturdy roof and poor-quality walls), lacking access to services (lacking electricity, fuel for cooking, sanitation services and safe drinking water) and lacking consumer durables (such as radio, fan, refrigerator, motorbike, mobile phone and bicycle)(Reference Briones61). WI tertiles were calculated separately for each country, so the tertiles represent the relative wealth differences within each country. The average WI score in Vietnam was much higher than in Ethiopia, so pooled tertiles resulted in minimal within-country variation across tertiles.
As reported by the caregiver, head of household gender, child gender and household ownership of any livestock in the last 12 months were also included as binary covariates. Dummy variables were created for regions. Household size, monthly household food and non-food expenditures (in real USD), agricultural earnings (in real USD), and the age of the head of household were included as continuous covariates.
Statistical methods
All analyses were conducted using R version 1.3.959. We used generalised estimating equation (GEE) models to estimate the associations of household-level crop diversity, measured as plant CNFR and CSR, and child DDS, using data from the same children over two survey years. GEE uses generalised linear models to estimate population average associations while accounting for time-dependent correlations. Given the cohort structure wherein identical children were surveyed in the two rounds, all models are clustered at the child level to account for within-child correlation for correct standard errors. We adjusted for all covariates listed in the preceding section as fixed effects. We present the GEE results stratified by country and do not present a pooled estimate due to differences in unmeasured residual confounder distributions between the populations. We adjusted for all covariates listed in the preceding section.
Effect modification was assessed by separately adding each interaction term (i.e. household wealth and proportion of food from own harvest) in the primary regression models(Reference Aiken and West62). Path analyses were conducted to test for mediation of the crop diversity–dietary diversity association by the proportion of food from own harvest and household agricultural earnings in the last year. The R package ‘lavaan’ was used to conduct the path analyses(Reference Rosseel, Jorgensen and Oberski63). The mediation analysis used cross-sectional data from 2006 to 2007 as it contained complete agricultural information for both countries. To conduct the path analyses, we used maximum likelihood estimation to estimate the standardised path coefficients (i.e. the association between crop diversity and the mediator (Path A) and separately the association between the mediator and diet diversity (Path B), as well as the association of crop diversity and diet diversity (Path C)). The indirect effect was measured as the product of the path coefficients for Path A and Path B. The direct effect was the association of crop diversity and diet diversity (Path C). The total effect is the sum of the indirect and direct effects. The proportion mediated was calculated by dividing the indirect effect by the total effect. Models were adjusted for all covariates from the primary analysis, and the Huber–White heteroskedasticity-consistent estimator was used to calculate robust standard errors for direct, indirect and total effects. We concluded that mediation was present only if the direct, indirect and total effects were statistically significant.
Results
The child DDS were significantly higher among children from households in Vietnam during both follow-up rounds compared with those of children from households in Ethiopia (Table 1). Ethiopian households had statistically significantly greater crop diversity, a lower WI and consumed a higher proportion of food from own production than Vietnamese households.
Table 1 Household socio-demographic and agricultural characteristics and children’s characteristics, Ethiopia and Vietnam, 2006–2010

* Household expenditures measured in the last 15 d.
† Exchange rates to US dollars (from birr in Ethiopia and dong in Vietnam) are average rate for the study year and were retrieved from https://fxtop.com/en/historical-exchange-rates.
‡ Two missing values from total agricultural land in Vietnam, 2006–2007.
Associations of crop diversity and child diet diversity
The fully adjusted GEE model for Ethiopia (Table 2) showed a statistically significant positive association between plant nutritional functional richness and DDS (β = 0·13, (95 % CI 0·07, 0·19)), but not for CSR (β = 0·02, (95 % CI −0·00, 0·05)). However, we note that the p-value for the coefficient on CSR is marginally significant at the 90 % level. Taken together, these two estimates support the positive association between diet diversity and child diet diversity in Ethiopia. On the other hand, neither of the fully adjusted GEE models for both measures of crop diversity and child diet diversity in Vietnam (Table 2) were statistically significant.
Table 2 Results of adjusted generalised estimating equations of the associations of two measures of household crop diversity with indicators of child diet diversity in Ethiopia and Vietnam, 2006–2010†

Significance codes:
* P < 0·05.
† Models adjusted for child gender, head of household gender and age, household size, ownership of any animal, total agricultural land, value of harvest sold in the last year, household nonfood and food expenditures in the last 15 d. Coefficients represent marginal effect.
*** P < 0·00.
Interaction models
In Ethiopia, the association of crop diversity (measured as CNFR) and child diet diversity among the wealthiest households was significantly lower in magnitude (β = −0·18, (95 % CI −0·31, −0·04)) compared to the poorest households (see online Supplemental Table 2; Fig. 1 (Panel A)). In Ethiopia, we did not find evidence that subsistence orientation modified the crop diversity–diet diversity association (see online Supplemental Table 2; Fig. 1 (Panel C)).
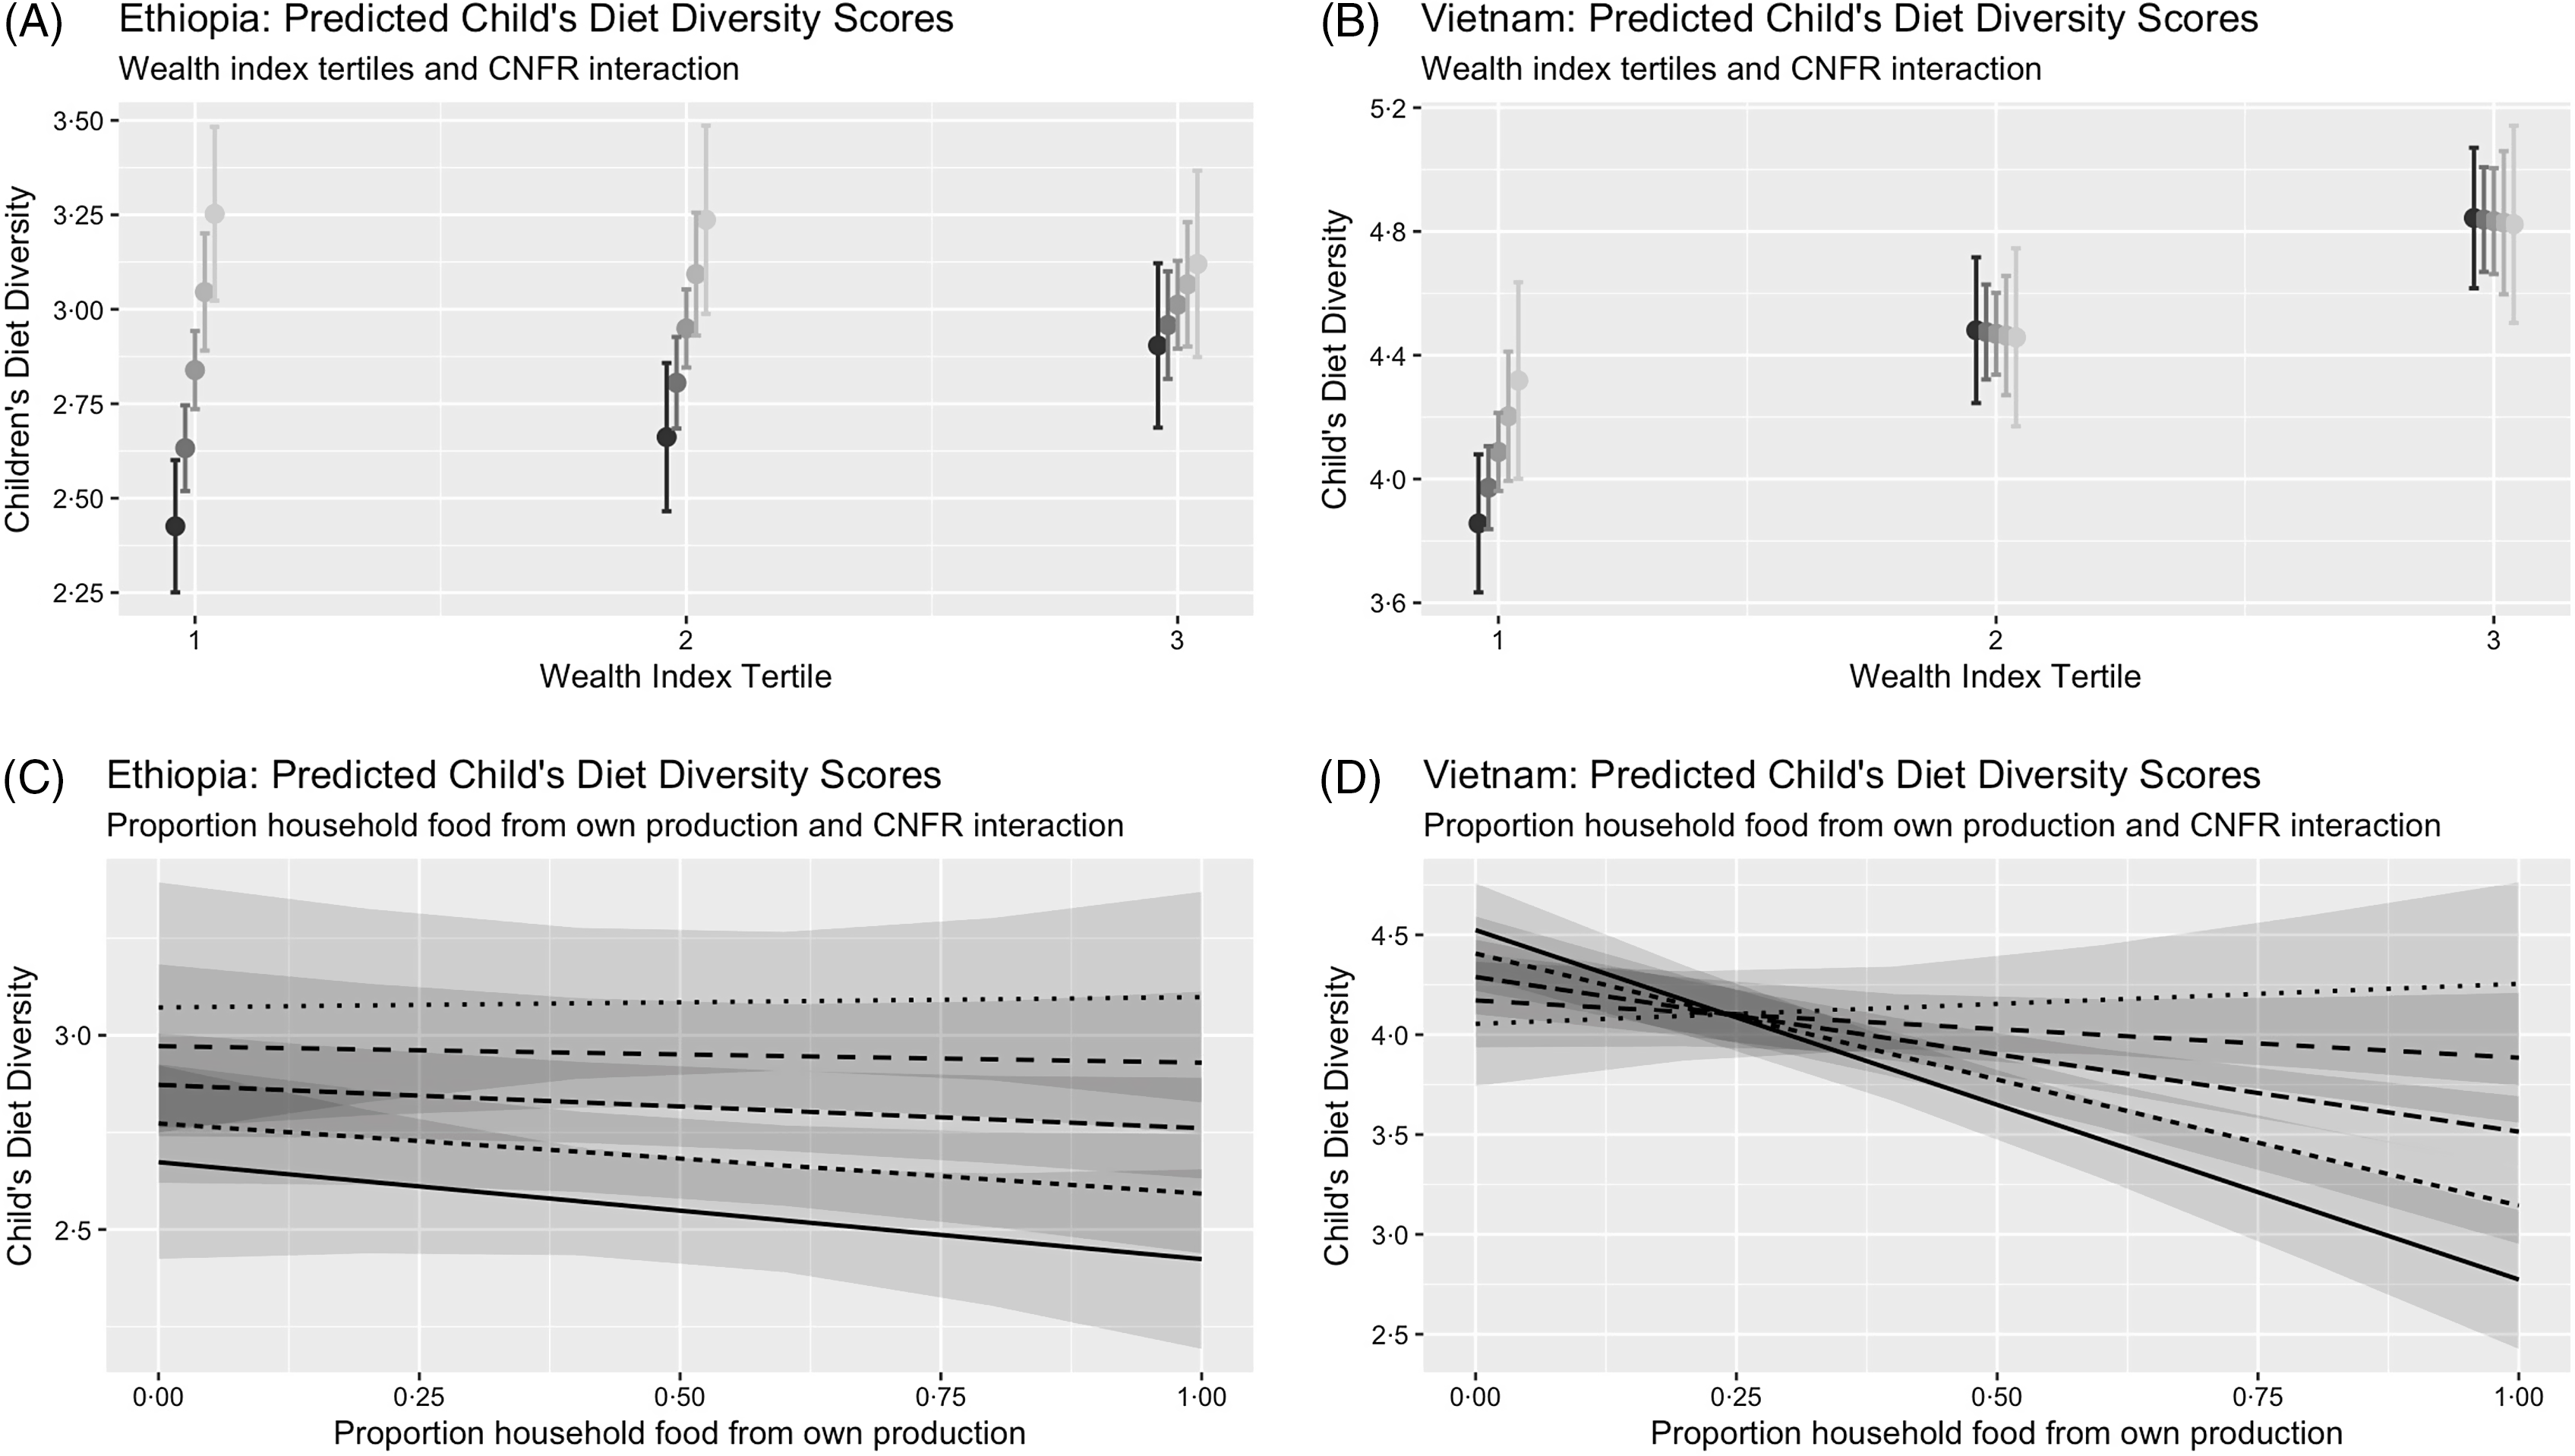
Fig. 1 Interaction model predictions from household wealth and proportion of food consumed from own harvest in the association of crop nutritional functional richness and child diet diversity in Ethiopia and Vietnam, 2006–2010
In Vietnam, the association of crop diversity and child diet diversity did not vary by household wealth (see online Supplemental Table 3; Fig. 1 (Panel B)); however, unlike in Ethiopia, this association was strongest among subsistence-oriented households (i.e. those households that consumed a larger proportion of food from own production (interaction term for CNFR-DDS association: (β = 0·38, (95 % CI 0·12, 0·64); see online Supplemental Table 3; Fig. 1 (Panel D)). All other interaction models analysed for the association of CSR and DDS were not statistically significant (see online Supplemental Table 3).
Mediation analyses exploring market and subsistence pathways
In Ethiopia, the associations of crop diversity (CNFR and CSR modelled separately) with DDS were positively mediated by log-transformed agricultural earnings (see online Supplemental Table 4; Fig. 2 (Panel A)) but not by the proportion of household food consumed from own production (see online Supplemental Table 4; Fig. 2 (Panel B)). CNFR was significantly associated with an increase in agricultural earnings (Ethiopia, β = 0·64 (Panel A, ‘a’ path); Vietnam, β = 0·75, (Panel C, ‘a’ path), Fig. 2) as well as subsistence production (Ethiopia, β = 0·06 (Panel C, ‘a’ path), Vietnam β = 0·02 (Panel C, ‘a’ path), Fig. 2), though only increases in agricultural earnings, not subsistence production, were associated with improvements in child diet diversity in Vietnam and Ethiopia. Neither agricultural earnings nor subsistence production statistically significantly mediated the association of CNFR and CSR with DDS in Vietnam (see online Supplemental Table 4; Fig. 2, Panels C and D).
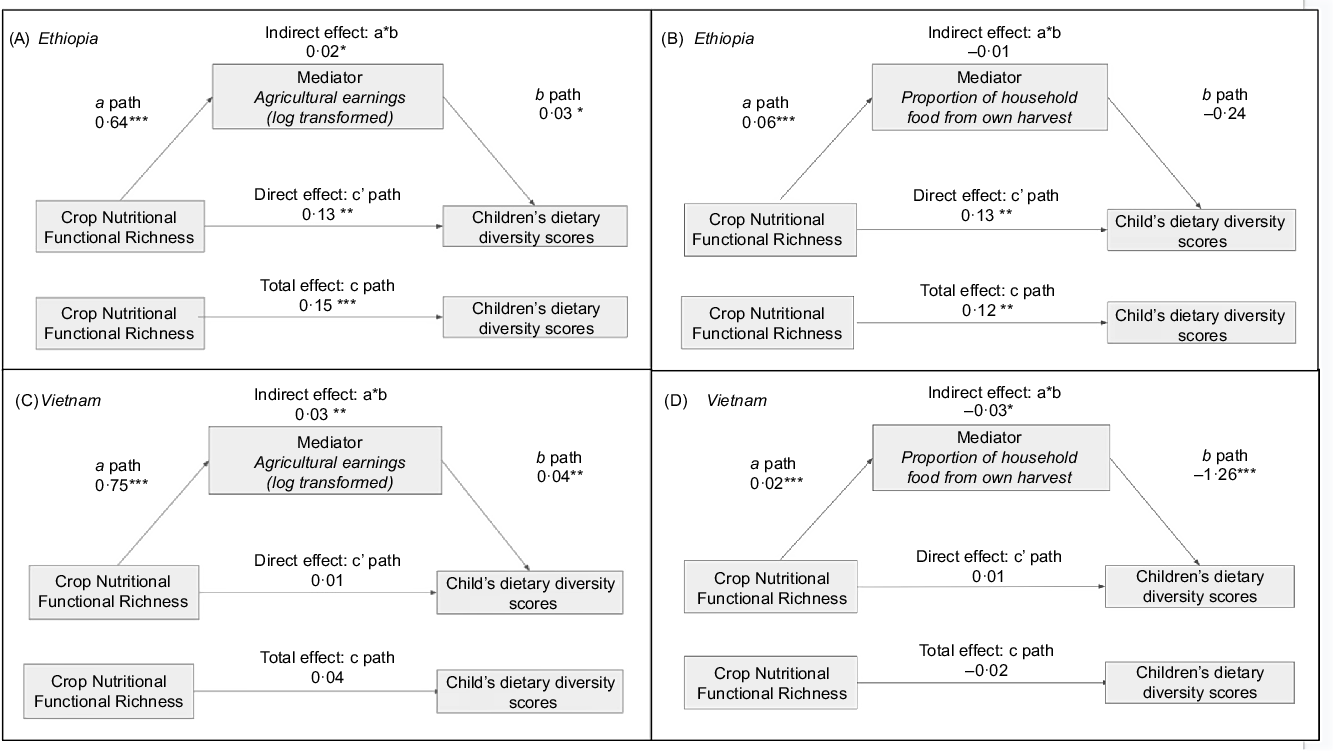
Fig. 2 Path analysis examining agricultural earnings and market orientation as mediators in the association of crop nutritional functional richness and child dietary diversity in Ethiopia and Vietnam, 2006–2007
Discussion
The primary purpose of this study was to analyse the association between household-level crop diversity and child dietary diversity among rural agrarian families in Ethiopia and Vietnam. We hypothesised that crop diversity would be associated with child diet diversity in both contexts. We found evidence confirming this hypothesis in Ethiopia, where two measures of crop diversity (CSR and CNFR) were associated with child diet diversity, but not in Vietnam. This geographic heterogeneity is consistent with a study that modelled the impact of additional novel cash crop production on adult nutrient adequacy and found no significant improvement in diet quality in Vietnam, but identified significant improvements in adult nutrient adequacy in Kenya(Reference Timler, Alvarez and DeClerck28). These results are also consistent with a meta-analysis that found stronger marginal associations between crop diversity and diet diversity among countries of sub-Saharan Africa than those of Southeast Asia or other regions(Reference Sibhatu and Qaim20). In this context, the fact that child DDS were on average 50–60 % higher among children in Vietnam than in Ethiopia may have contributed to the differential associations observed in the two contexts. Where diet diversity is already relatively high, diversified agricultural production is likely to have a declining marginal benefit for further diversification of diets.
Effect modification by household wealth and farm market orientation
For the second aim of the study, we examined the extent to which household wealth and market orientation of agricultural production influenced the crop diversity–diet diversity association. We hypothesised that this association would be stronger in poorer and more subsistence-oriented households. Indeed, in Ethiopia, the association of CNFR and DDS was weaker among households in the highest wealth tertile, but in Vietnam, no such interaction was found. In Vietnam, aligned with our hypothesis, the magnitude of the association between CNFR and DDS was higher among households who were more oriented towards subsistence farming, yet we did not find the same interaction in Ethiopia. In Vietnam, the association between CNFR and diet diversity was higher by 0·38 among households that consumed all of what they produced on farm compared to those that sold all of their production (see online Supplemental Table 3). While the magnitude of this association is small, this relative change would partially mitigate the decline in DDS associated with subsistence production by increasing the DDS to closer to the level of non-subsistence households (Fig. 1 (Panel D)). Overall, these interactions suggest that crop diversity was more likely to provide nutritional benefits in settings where households are more likely to rely on subsistence agriculture and have lower average wealth. Our results support previous conclusions that diversification as a nutritional intervention should be focused in specific contexts where it is likely to be beneficial(Reference Sibhatu, Krishna and Qaim35).
In Vietnam, though the association between crop diversity and child diet diversity was higher among subsistence-oriented households, consuming more food from own production was associated with lower child diet diversity (Table 2). We observed a moderate negative correlation between household wealth and the extent to which a household’s farm was subsistence-oriented in Vietnam, but this correlation was not observed in Ethiopia (data not shown). This correlation suggests that the children who may nutritionally benefit from crop diversification (i.e. those from highly subsistence-oriented households) are also likely to be from lower-income households. Vietnam’s rapid economic gains since the 1980s have led to vast improvements in market accessibility and infrastructure, but the growth remains uneven, leaving behind some rural regions(Reference Thang and Popkin41). Children from rural households excluded from Vietnam’s economic growth and whose diets depend more on own agricultural production are more likely to benefit from crop diversification.
In Ethiopia, we observed that the poorest households had the strongest magnitude of association between crop diversity and child diet diversity. The much lower average wealth of Ethiopian households (nearly half the average of Vietnamese households), and reliance on subsistence production (consuming on average twice the proportion of household food from own harvest relative to Vietnam) may in part account for the statistically significant associations observed between crop diversity and child diet diversity in Ethiopia. A related study from Ethiopia also found that the association of crop diversity and dietary diversity was most important for the poorest households, as represented by limited non-farm income(Reference Sariyev, Loos and Khor64). Ethiopia’s lack of accessible agricultural markets, vulnerability to climate change and limited transportation infrastructure, contributing to widespread poverty among smallholder farmers and high levels of subsistence production, may mean that crop diversification has a greater potential nutritional benefit in this context(Reference Rapsomanikis40,Reference Mohamed50) .
Mechanisms underlying the association of crop diversity with child diet diversity
For the third aim of our study, we explored the potential mediation of the crop diversity–diet diversity relationship by indicators of the relative market orientation of farms. For this aim, we hypothesised that agricultural earnings and the proportion of food consumed from own production would mediate the association between crop diversity and diet diversity. In Ethiopia, unlike in Vietnam, agricultural earnings mediated the association, though in neither context did the proportion of food consumed from own production mediate the association.
Crop diversification was associated with a higher proportion of food consumed from own harvest (Fig. 2 (Panels B and D, ‘a’ path)), a finding aligned with other studies(Reference Sibhatu, Krishna and Qaim35,Reference Muthini, Nzuma and Qaim65) . One study in Kenya also found that production of an additional crop was associated with a lower diversity of purchased foods while still associated with a higher diversity of own-produced foods(Reference Muthini, Nzuma and Qaim65). In our study, while own-produced foods were consumed to a large extent in both Vietnam and Ethiopia and do contribute substantially to diets, this contribution was likely not diverse enough to mediate the crop diversity–diet diversity relationships examined.
Smallholder production often contains a portfolio of subsistence and market crops, such that farmers are both growing food for their own consumption and selling produced crops(Reference Carletto, Ruel and Winters30,Reference Johns and Sthapit31,Reference Carletto, Corral and Guelfi34) .In many contexts, farmers diversify their agricultural production with the intent to grow additional crops for sale to markets(Reference Wiggins, Argwings-Kodhek and Gebreselassie33). In our study, we observed positive statistically significant mediation from agricultural earnings of the association between CNFR and child diet diversity in Ethiopia, though not in Vietnam. Ethiopian households that were able to reach markets with their diverse production were able to translate those earnings into more diverse diets. In Vietnam, given that no statistically significant primary association was observed between crop diversity and diet diversity, it is not surprising that no mediation of this association was observed. In both contexts, crop diversification was associated with statistically significantly higher agricultural earnings (Fig. 2 (Panels A and C, ‘a’ path)). These findings are consistent with numerous earlier studies, including from Ethiopia and Vietnam, indicating that farm diversification is associated with higher agricultural revenues and reduced risk of poverty compared with less diversified farms(Reference Dillon, McGee and Oseni21,Reference Pellegrini and Tasciotti26,Reference Jones, Creed-Kanashiro and Zimmerer38,Reference Asfaw, Scognamillo and Caprera66–Reference Bigsten and Tengstam68) . Thus, crop diversification, as has been empirically demonstrated in other contexts(Reference Wiggins, Argwings-Kodhek and Gebreselassie33,Reference Bellon, Kotu and Azzarri69) , facilitates market engagement in addition to supporting subsistence production and is an important driver of shifts towards more commercialised agriculture(Reference Pingali, Aiyar and Abraham70).
There are several limitations to this study. Firstly, this is a secondary analysis. The YL data were not collected primarily for this study and some agricultural data were not available. Specifically, in the data from 2009 to 2010 from Vietnam, households reported only the four main crops grown by the household in the last agricultural year. However, in the previous round, few households from Vietnam (15 %) grew more than four crops, so the impact of this censure on the results is likely limited. Secondly, the scores for diet diversity cannot be considered a proxy for diet quality because there are as of yet no validated metrics of diet diversity for school-aged children, and some food groups commonly included in validated DDS for other age groups were not available in all rounds of the YL data that we used. Thirdly, the caregiver reported all the food groups the child consumed to the best of their knowledge. Underreporting of food groups may have occurred if the child ate foods away from home of which the caregiver was unaware (e.g. at school). Additionally, because only a single diet recall was conducted during each follow-up period, it is possible that diet data in the study do not represent a child’s usual diet. Fourthly, YL did not collect data on household food production from livestock and we therefore were unable to examine this as an independent variable in our analyses. We did, however, adjust for any livestock ownership in our analyses. Furthermore, in the few studies that have assessed both crop diversity and crop and livestock diversity in association with diet diversity outcomes, the estimates of the associations have been quite similar(Reference Jones, Creed-Kanashiro and Zimmerer38,Reference Jones, Shrinivas and Bezner-Kerr71) , likely because smallholders often prioritise livestock to enable savings or for non-food expenditures rather than as a direct source of food or food-related income(Reference Nyantakyi-Frimpong, Colecraft and Awuah72). Fifthly, household crop diversity was measured by self-report. Anecdotal evidence suggests that such self-reporting may lead to underreporting of crop diversity(Reference Jones19), which in turn is likely to bias estimates towards the null. Such underreporting could bias results in the opposite direction given the diminishing size of the association between crop diversity and diet diversity at higher levels of production diversity(Reference Pellegrini and Tasciotti26,Reference Sibhatu, Krishna and Qaim35) . However, in smallholder settings, the positive association between crop diversity and diet diversity is maintained through high levels of diversity(Reference Remans, Flynn and DeClerck58) well beyond those observed in this study. Therefore, an upward bias resulting from underreporting is unlikely. That we found statistically significant associations despite potential underreporting indicates the strength of the underlying relationships. Finally, this study uses an observational design, which cannot definitely establish causality. Residual confounding may remain from unmeasured market accessibility, seasonality and community-level factors. Nonetheless, based on a clear theoretical framework, we tested a priori hypotheses related to posited mechanisms underlying the crop diversity–diet diversity associations that we examined.
This study has several strengths. Firstly, the YL cohort had a high response rate and low attrition, so selection bias was unlikely to bias the results. Secondly, the repeated measures data of the YL cohort allows for unique insights into the crop diversity–diet diversity linkage in the context of most previous studies that rely on single cross-sectional surveys. Thirdly, we use two different measures of crop diversity which provide greater insight into the specific diversified crop patterns associated with child diet diversity. Because each food produced has specific nutritional characteristics, a simple count of crops may reflect redundancies in the capacity of a given cropping pattern to address certain nutritional requirements(Reference Remans, DeClerck and Kennedy73). In contrast, the nutritional functional richness indicator captures the diversity of nutritional food groups available from agricultural production. Fourthly, our mediation analyses of the relative market orientation of farms are a strength because the pathways of the crop diversity–diet diversity association are not well established. Finally, by including two countries from very different agronomic and socio-economic settings, the analysis examines the heterogeneity of the association and its moderating and mediating factors.
In conclusion, we observed differing associations between crop diversity and child diet diversity in Ethiopia and Vietnam. In Vietnam, child diets were considerably more diverse than in Ethiopia which may have contributed to the lack of statistically significant associations observed in Vietnam. In Ethiopia, where child diet diversity was considerably lower, the magnitude of the positive association between crop diversity and child diet diversity was statistically significant and was even higher among poorer households as has been observed in previous studies(Reference Jones29,Reference Mulmi, Masters and Ghosh37) . Our findings imply that crop diversification may be most beneficial as a dietary intervention among children from poor and/or highly subsistence-oriented households. It is also clear, given the magnitude of the associations, that agricultural diversification alone is not sufficient to address the dietary deficits observed among children in this study. Nutrition-specific interventions (e.g. micronutrient supplementation(Reference Yakoob and Lo4,Reference Bhutta, Das and Rizvi74) and nutrition education(Reference Bhutta, Das and Rizvi74)) are needed alongside efforts to improve smallholder farmers’ access to markets and livelihood opportunities. Future research on the combined effect of crop diversification and nutrition-specific interventions is warranted. Nonetheless, the magnitude of the association between crop diversity and diet diversity observed in this study for Ethiopia (similar to the magnitude of the association observed in previous studies(Reference Jones19)) is comparable to the effect size observed for more direct nutrition interventions, for example, education interventions(Reference Kuchenbecker, Reinbott and Mtimuni75–Reference Reinbott, Schelling and Kuchenbecker77).
Policies aimed at expanding market opportunities and transportation infrastructure are important for improving diet diversity among the poorest and highly subsistence-oriented children in LMIC. However, market-based solutions to child nutrition are challenging to implement in some contexts due to geography, climate and political instability and these regions are often where the poorest and most subsistence-oriented households reside(Reference Remans, DeClerck and Kennedy73,Reference Luckett, DeClerck and Fanzo78) . Furthermore, it is not clear that agricultural commercialisation has consistent positive effects on child nutrition or related food security outcomes(Reference Carletto, Corral and Guelfi34,Reference Linderhof, Janssen and Achterbosch79) . Nonetheless, agricultural diversification, as noted above, facilitates market engagement by smallholder farmers and is consistently linked with higher farmer incomes. Therefore, as efforts are made to link smallholder farmers to markets, agricultural diversification is a critical policy mechanism for achieving this goal.
Acknowledgements
Acknowledgements: The data used in this publication come from Young Lives, a 15-year study of the changing nature of childhood poverty in Ethiopia, India, Peru and Vietnam (www.younglives.org.uk). Young Lives is funded by UK aid from the Department for International Development (DFID). The views expressed here are those of the authors. They are not necessarily those of Young Lives, the University of Oxford, DFID or other funders. Financial support: This work was funded by the University of Michigan Graham Sustainability Institute as part of the Entry Points to Advance Transitions towards Sustainable diets (EATS) initiative (authors E.E.E. and A.D.J.), a research collaboration between the University of Michigan and the International Center for Tropical Agriculture (CIAT), and by the University of California Research and Innovation Fellowships in Agriculture (author E.E.E.; authors L.C.H.F. and S.A.R. did not receive financial support). Conflict of interest: There are no conflicts of interest. Authorship: E.E.E. designed the analysis plan, conducted the analysis and wrote the manuscript. A.D.J., S.A.R. and L.C.H.F. revised the manuscript and advised on the data analysis. Ethics of human subject participation: This study was conducted according to the guidelines laid down in the Declaration of Helsinki and the University of Oxford Ethics Committee approved Young Lives study protocols. Parental informed consent was obtained for all children and the child’s informed verbal consent was obtained for children at least 7 years of age. Verbal consent was witnessed and formally recorded. All Young Lives data used in these analyses were de-identified prior to the authors’ acquisition of the data.
Supplementary material
For supplementary material accompanying this paper visit https://doi.org/10.1017/S1368980021003281


