


The metabolic syndrome (MetS) is defined as a group of metabolic abnormalities that include central obesity, insulin resistance, dyslipidaemia and hypertension, which are risk factors for the development of CVD(Reference DeBoer, Gurka and Golden1). In addition, this metabolic alteration has been associated with an increased risk of developing other chronic diseases as cancer(Reference Micucci, Valli and Matacchione2), neurodegenerative diseases(Reference Zhang and Tian3) and mental disorders, such as depression(Reference Gheshlagh, Parizad and Sayehmiri4). Depression is a common mental disorder, particularly in older adults(Reference Kessler, Birnbaum and Shahly5), being the third largest cause of years lived with disability in developed countries.
Some authors have pointed out that the modification of lifestyle factors, including inactivity and unhealthy dietary intake, could prevent and manage the progression of depression(Reference Sanhueza, Ryan and Foxcroft6). However, the most common treatments for depressive symptoms in late life is the use of antidepressive medications and psychotherapy, which are not effective in some patients and are a burden on health care utilisation and costs(Reference Bock, Brettschneider and Weyerer7).
Regarding the relationship between diet and depression, several studies point out towards a bidirectional association, with the possibility of a reverse causality between them. On the one hand, subjects with depression have worse dietary habits(Reference Poorrezaeian, Siassi and Qorbani8) and on the other hand, healthy dietary patterns have been shown to be beneficial reducing the risk of depressive outcomes(Reference Lassale, Batty and Baghdadli9). Hence, healthy dietary patterns have been shown to be beneficial reducing the risk of depressive outcomes. One possible explanation is that dietary quality might modulate several brain pathways including low-grade inflammation and oxidative stress, which intervene in the aetiology of depression(Reference Marx, Moseley and Berk10). Among the different dietary patterns, the strongest evidence for a reduced risk of depression have been found for Mediterranean diet. This fact could be explained by the high diversity of healthy food groups that characterises this dietary pattern, increasing the likelihood to meet nutritional requirements(Reference Cano-Ibáñez, Gea and Martínez-González11). Despite of this, a recent meta-analysis have analysed a subset of studies that controlled for baseline symptoms of depression, reporting no association between diet quality and depression risk(Reference Molendijk, Molero and Sánchez-Pedreño12). So, clear inconsistencies in establishing the diet–depression link still exist.
Dietary diversity (DD) has been universally identified as a key element of high-quality diets. The dietary diversity score (DDS) is a simple count of food groups consumed, in conformity with advices provided by dietary guidelines as indicators of nutritional adequacy worldwide. In patients with mood disorders, particularly prenatal and postpartum women(Reference Leung and Kaplan13), and in younger adult population(Reference Sánchez-Villegas, Pérez-Cornago and Zazpe14) deficiencies have been found, for nutrients including Ca, vitamins B9, B12 and n-3 fatty acids.
DDS, an useful indicator of nutrient adequacy, has been found to be inversely associated with anxiety after adjusting for socio-economic and lifestyle factors(Reference Jiang, Mo and Li15). International dietary recommendations in general, and the Spanish dietary guidelines in particular, promote a healthy diet to reduce the incidence of diet-related chronic diseases. The healthy message that the Spanish Society of Community Nutrition (SENC) conveys to the population is that ‘Diet should be balanced, moderate and varied’(Reference Aranceta Bartrina, Arija Val and Maíz Aldalur16). Meanwhile, the role of a varied diet over chronic diseases as obesity(Reference Golpour-Hamedani, Rafie and Pourmasoumi17), cancer(Reference Cano-Ibáñez, Barrios-Rodríguez and Lozano-Lorca18) or CVD(Reference Qorbani, Mahdavi-Gorabi and Khatibi19) has been adressed, specifically the potential prevention of depression is yet to be determined. Understanding and addressing the possible role of DD in depressive symptoms can be of great public health importance.
To our knowledge, no previous study has focused on the relationship between the DD and mental health among older Spanish population with MetS. Hence, our research was designed to examine the cross-sectional and longitudinal (2-year follow-up) associations between DD and depressive symptoms in a cohort of Spanish older adults with MetS.
Methods
Design of the study
The PREDIMED-Plus study is a randomised primary prevention trial involving twenty-two centres throughout Spain with a planned follow-up of 6 years. Participants were randomly assigned to two groups: intervention group and control group. The main objective of the clinical trial is to determine the effect on cardiovascular mortality of an intensive dietary advice for weight loss based on a traditional hypocaloric Mediterranean dietary pattern promoting physical activity and behavioural therapy (intervention group) v. Mediterranean-type dietary advice for CVD prevention in the context of usual health care (control group). More detailed information on the study protocol can be found in the publication by Martínez-González et al. (Reference Martínez-González, Buil-Cosiales and Corella20). The database used was updated on 26 June 2020.
Ethics approval
The trial was registered at the International Standard Randomized Controlled Trial (ISRCTN: http://www.isrctn.com/ISRCTN89898870) with number 89898870 and registration date of 24 July 2014. All participants gave written informed consent, and the study was approved by the Research Ethics Committees from all recruitment centres, according to the ethical standards of the Declaration of Helsinki.
Participants and data collection procedures
Eligible participants were men (aged 55–75 years) and women (aged 60–75 years), with overweight or obesity (BMI ≥ 27 and <40 kg/m2), who at baseline met at least three components of the MetS: TAG level ≥150 mg/dl, blood glucose ≥ 100 mg/dl or use of oral antidiabetic drugs, systolic blood pressure ≥130 mmHg and diastolic blood pressure ≥85 mmHg or use of antihypertensive drugs and/or HDL-cholesterol level <40 mg/dl for men and <50 mg/dl for women according to the harmonised criteria of the International Diabetes Federation and the American Heart Association and National Heart, Lung and Blood Institute(Reference Alberti, Eckel and Grundy21) and without other neurological or endocrine disease active.
Of the 6874 participants enrolled in the PREDIMED-Plus study, only participants who completed a semi-quantitative FFQ and a depressive symptoms questionnaire (Beck Depression Inventory-II, Beck II) at baseline were included in the current analysis. Those participants with missing dietary data and with extreme energy intakes (<500 or >3500 kcal/d for women and <800 or >4000 kcal/d for men)(Reference Willet22) (n 227) at baseline were excluded. Among the available participants, we also excluded those who failed to complete the Beck II questionnaire at baseline (n 22). The final sample for the cross-sectional analysis was 6625 participants. For the longitudinal analysis, out of the eligible individuals, we excluded those with prevalent depression at baseline, those who had a Beck II score ≥18 points at baseline (n 1772), and those who did not complete the Beck II questionnaire after 2 years of follow-up (n 993). Finally, for the longitudinal analysis, 3860 participants were included (Fig. 1).
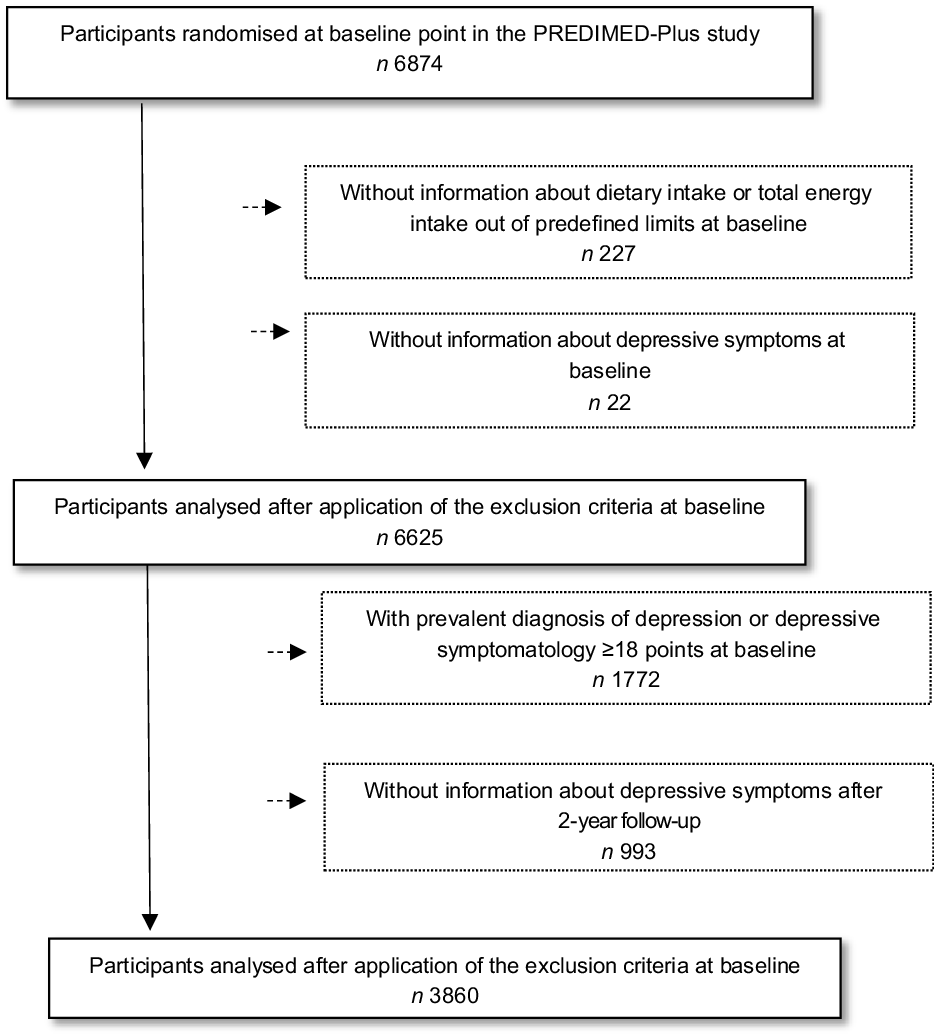
Fig. 1 Flow chart of the study participants
Dietary intake assessment
At baseline, trained dieticians filled out a validated 143-item semi-quantitative FFQ(Reference Martin-Moreno, Boyle and Gorgojo23) in a face-to-face interview. The FFQ provides a list of foods commonly used by the Spanish population and asks about the consumption of these foods during the previous year. From this questionnaire, total energy and nutrient intake were calculated based on Spanish food composition tables(Reference Moreiras, Cabrera and Cuadrado24,Reference Mataix Verdú25) .
Dietary diversity score construction
The 143-item FFQ was also used to calculate an energy-adjusted DD score (DDS). This DDS was calculated by the method originally developed by Kant et al. (Reference Kant, Schatzkin and Harris26) and recently reported by Farhangi et al. (Reference Farhangi and Jahangiry27) and Cano-Ibáñez et al. (Reference Cano-Ibáñez, Gea and Martínez-González11,Reference Cano-Ibáñez, Barrios-Rodríguez and Lozano-Lorca18,Reference Cano-Ibáñez, Martínez-Galiano and Amezcua-Prieto28) . DDS was calculated based on the method using the food groups recommended by the Spanish guidelines’ pyramid(Reference Aranceta Bartrina, Arija Val and Maíz Aldalur16). Table 1 shows a detailed description of food groups and subgroups considered in the DDS and their recommended consumption measured as servings/d.
Table 1 Food groups and the recommended servings/d/week used in the dietary diversity score (DDS) according to the Spanish guidelines
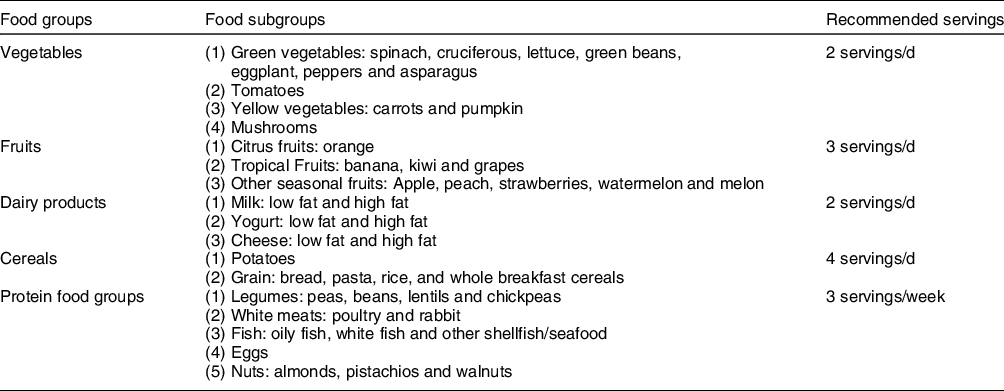
The non-recommended food groups (which should be consumed only exceptionally)(Reference Moreiras, Carbajal and Cabrera29) have not been included in the calculation of the DD. These are products with low nutritional content and unhealthy and, therefore, their variety is not desirable. These food categories include those foods containing refined sugars and alcohol (bakery products, ice cream, pastries, sweetened beverages, chocolate, fruit-flavoured drinks and alcohol beverages) and food groups high in salt, cholesterol and/or trans-fat and saturated fat (butter, cream, fried foods, unhealthy vegetable fats, processed meats, sauces, ready meals, condiments and snacks). Therefore, we only analysed diversity of recommended food groups(Reference Kant and Thompson30). To be counted as a consumer for any of the food group categories reported previously, the participant should consume at least one-half of the recommended serving per d for each of the items included in the food group, scoring with 2 points for each item. A maximum score of 2 was awarded to each of the five groups and so that each participant received a score ranging from 0 (minimum) to 10 (maximum). To calculate the score of each group, the number of subgroups consumed was divided by the total number of subgroups in each main group, and then it was multiplied by 2. The sum of the scores of the five main groups is reported as the total score. The score was adjusted for total energy intake according to the residual method proposed by Willett et al. (Reference Willet22), due to the general concern that high food variety might be a consequence of overconsumption of energy(Reference Kennedy31). For example, if the Spanish nutritional recommendation advises a usual vegetable intake of two servings per d, for each vegetable item, participants should consume at least one serving/d). Thus, if the consumption per d for a vegetable item is lower than one serving, the value for this item will be 0; conversely, if the consumption is higher than one serving, the value will be 2. For the five considered groups, the procedure is similar. Finally, DDS was categorised in quartiles (Q) and the cut-off points were 3·9, 4·6, 5·4 and 8·0. The variety in each food group was classified into four categories (C) (C1 = 0 points), (C2 => 0–≤0·5 points), (C3 => 0·5–<1 points) and (C4 ≥ 1 point).
Outcome assessment
Depressive symptoms were collected at baseline and at 1 and 2 years of follow-up visits by trained PREDIMED-Plus staff through a validated questionnaire, the Beck-II. The Beck II includes twenty-one multiple-choice questions, rating on a scale of 0 to 3 according to symptom severity. Total score of the Beck-II questionnaire ranges from 0 to 63 points(Reference Ibáñez, Pino and Olmedo32). Prevalent depression was defined as the presence of depressive symptoms at baseline (Beck-II ≥ 18 points) or a current depression diagnosis. The depression diagnosis was collected at baseline, and it was defined as a self-reported lifetime medical diagnosis of depression. Changes in depressive symptomatology were calculated as the difference in Beck-II questionnaire score between the baseline and the 2-year score.
Covariate assessment
At baseline and 1-year of follow-up visits, participants filled out a general questionnaire to provide data on lifestyle habits and socio-economic factors. Sociodemographic and lifestyle variables were categorised as follows: educational level (three categories: primary level, secondary level and tertiary level which includes university studies), civil status (two categories: married or not, which includes widowed, divorced/singled or others) and whether participants lived alone or not. Other lifestyle variables such as smoking habits (three categories: smoker, never smoker and current smoker), leisure-physical activity status (three categories: active, moderately active and less active) and sleep duration (h/d) were also recorded. Regarding the hours of sleep, participants reported both the average amount on weekdays and weekends. The non-validated and open question used was: ‘How many hours do you sleep on average per d on weekdays and weekends?’ Leisure-time physical activity was measured by the short form of the Minnesota Leisure Time Physical Activity Questionnaire validated for the Spanish population(Reference Elosua, Marrugat and Molina33,Reference Elosua, Garcia and Aguilar34) . Leisure-time activities were computed by assigning a metabolic equivalent score to each activity, multiplied by the time spent for each activity and summing up all activities. Time spent and intensity in leisure-physical activity was calculated as a product of the frequency and duration of six types of activities categorised into three intensities: light PA (< 4 Metabolic Equivalent Tasks (MET)) – walking at a slow/normal pace; moderate PA (4–5·5 MET) – brisk walking and gardening; and vigorous PA (≥ 6·0 MET) – walking in the countryside, climbing stairs, exercise or playing sports.(Reference Ainsworth, Haskell and Herrmann35). Anthropometric parameters were measured in every follow-up visit according to the PREDIMED-Plus protocol. The measures collected were height (using a wall-mounted stadiometer, in m2) and weight (using high-quality electronic calibrated scales, in kg). BMI was calculated as weight in kilograms by the square of height in metres (kg/m2). Finally, personal history of baseline chronic diseases (hypertension, dyslipidemia and type 2 diabetes) was collected from the patients’ medical records.
Statistical analysis
Statistical analyses were performed using STATA software (version 15.0, StataCorp., LP). For the current study, we used the PREDIMED-Plus longitudinal database generated on 26 June 2020 (202006290731_PREDIMEDplus). Data are presented as mean and standard deviations for continuous variables or number and percentages for categorical variables. Cut of points for DDS were defined by quartiles (Q1, low diversity intake and Q4, high diversity intake). Cut of points for each food groups were defined by categories (C1, low diversity intake and C4, high diversity intake).
Performance of cross-sectional analysis
Logistic regression models were fitted to assess the relationship between the energy-adjusted total DDS and each of the food groups and the prevalence of depression at baseline (cross-sectional analysis). OR and their 95 % CI were calculated considering the lowest quartile as the reference category. All cross-sectional analyses were adjusted for potential confounders based on prior knowledge: sex, age, smoking habits, physical activity, educational level, BMI, living alone, civil status, sleep duration, presence of chronic diseases, allocation group and recruitment centre. Moreover, in order to assess the effect of diet quality over depressive symptomatology at baseline, we performed an ancillary analyses, excluding all depression cases in which age of depression diagnosis was not available or in which the diagnosis date was very remote (more than 10 years before enrolment) (n 1378). These data were obtained through medical records.
Performance of longitudinal analysis
The association between the baseline and their changes was evaluated through multivariable regression models adjusted for the same potential confounders mentioned above plus depressive symptomatology at baseline. We also analysed the possible interaction between DDS and allocation group (intervention and control group). Regression coefficients (β) and their 95 % CI were calculated. Finally, the exclusion of individuals with high baseline depressive symptomology could limit the possibility of finding longitudinal associations. For this reason, we performed an ancillary analysis not excluding those subjects with a Beck-II score higher than 18 points at baseline or with prevalent depression diagnosis at baseline. Statistical significance was set at P < 0·05.
Results
Baseline characteristics of the study participants according to dietary diversity score quartiles
This study analysed a sample of 6625 participants from the PREDIMED-Plus cohort. Table 2 provides an overview of the sample characteristics according to baseline DDS quartiles. There were statistically significant differences in the distribution of sociodemographic and lifestyles characteristics across DDS quartiles. Compared to those in the higher quartile of diversity, participants in the lowest quartile were more likely to be younger, male, current smokers and with higher educational level (tertiary school).
Table 2 Baseline characteristics of PREDIMED-Plus participants according to quartiles of DDS (total population = 6625)
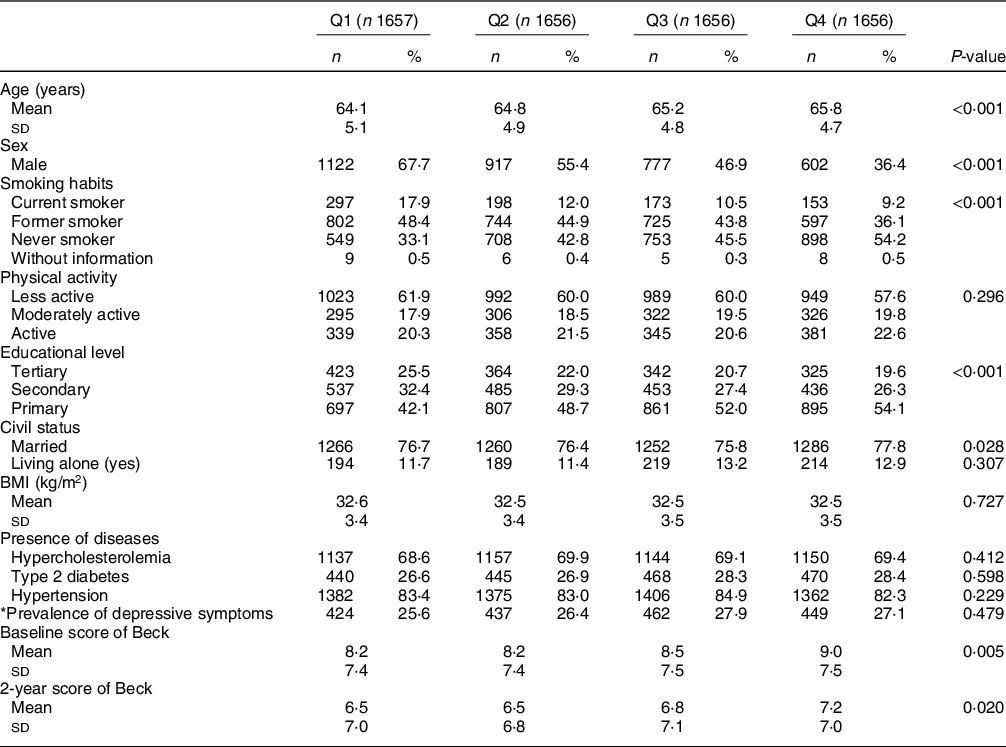
* Prevalence of depressive symptoms: prevalence of depressive symptoms was defined as the presence of depressive symptoms at baseline (Beck≥18 points) or a current depression diagnosis. DDS cut-off points for each quartile: (Q1 = 0.8–3.9, Q2 = 4.0–4.6, Q3 = 4.7–5.4 and Q4 = 5.5–8.0).
Values are presented as means ± sd for continuous variables and n (%) for categorical variables.
Pearson’s chi-square test was performed for categorical variables and ANOVA test for continuous variables (Q1, less diversity; Q4, more diversity).
Cross-sectional associations between dietary diversity score and variety in food intake and depressive symptomatology (assessed by Beck-II score at baseline point)
As seen in Table 3, total DDS was not associated with depressive symptomology (assessed by Beck-II score) at baseline. Considering each of the components of the total DDS separately, we found significant associations between the consumption of high diversity of groups of vegetables and depressive symptoms compared to the lowest diversity category: β-coefficients (95 % CI) for successive categories (C2–C4 v. C1) were −0·86 (−1·58, −0·15); −0·81 (−1·47, −0·14) and −0·69 (−1·37, −0·01), respectively.
Table 3 Multivariable linear regression models for the association between total DDS and variety in food intake and Beck Depression Inventory-II score at baseline in the PREDIMED-Plus study participants. β-Coefficients (95 % confidence intervals) (total population = 6625)
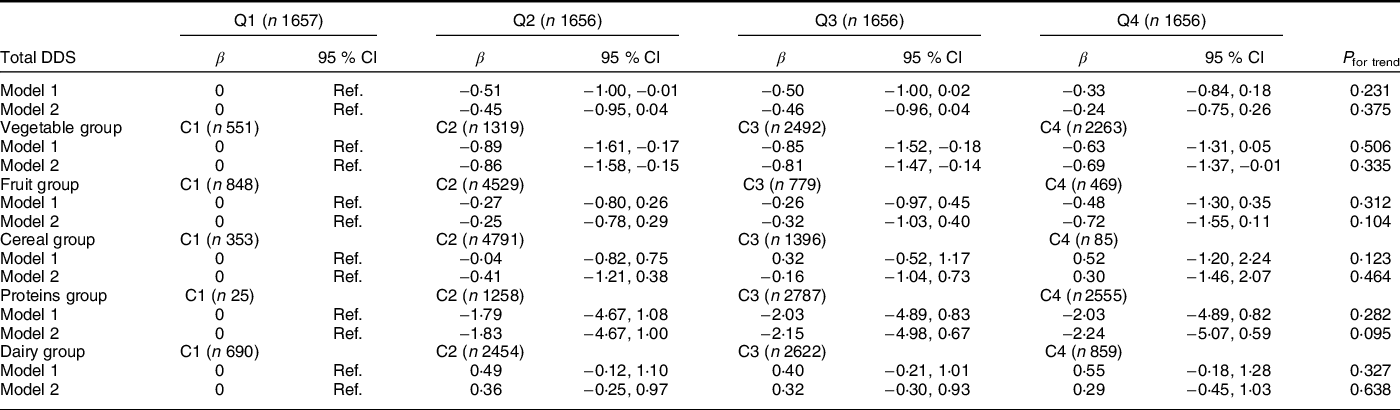
C, category; DDS, dietary diversity score; Q, quartile (Q1, less diversity; Q4, more diversity).
Values are presented as β-coefficients and 95 % CI for Beck Depression Inventory-II score at baseline as continuous variable according to total DDS and variety in food intake.
Model 1: Adjusted for sex and age.
Model 2: Additionally adjusted for energy intake, smoking habits, physical activity, educational level, BMI, living alone, civil status, sleep duration and presence of chronic diseases.
Values presented in bald showed a statistically significant association (P < 0·05).
DDS cut-off points for each quartile: (Q1 = 0·8–3·9, Q2 = 4·0–4·6, Q3 = 4·7–5·4 and Q4 = 5·5–8·0).
The variety in each food group was classified into four categories (C): (C1 = 0 points), (C2 => 0–≤0·5 points), (C3 => 0·5–<1 points) and (C4 ≥ 1 point).
Cross-sectional associations between dietary diversity score and variety in food intake and prevalence of depression
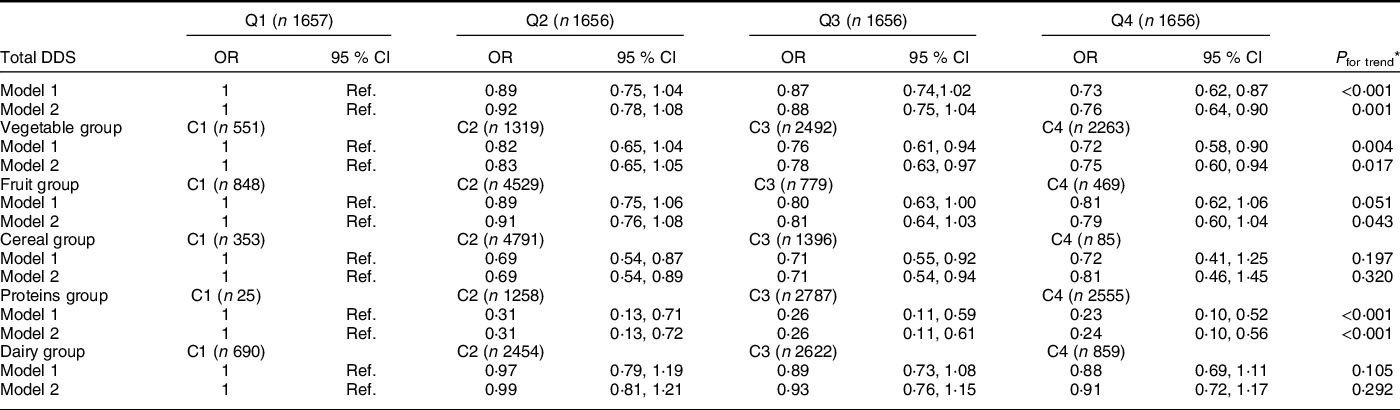
Total DDS was inversely and significantly associated with prevalence of depression in logistic analysis (Table 4). Participants in the highest quartile of total DDS showed lower odds of depression as compared to those participants in the lowest quartile (OR = 0·76, 95 % CI (0·64, 0·90)). Regarding the specific components of the total DDS, high (C3) or very high (C4) diversity of groups of vegetables reduced the odds of depression (OR = 78, 95 % CI (0·63, 0·97)) and (OR = 0·75, 95 % CI (0·60, 0·94)), respectively. In the case of proteins, the OR (95 % CI) were 0·26 (0·11, 0·61) (C3) and 0·24 (0·10, 0·56) (C4) as compared to the reference category (C1). For cereals, only moderate diversity in intake was associated with lower probability of depression. The OR (95 % CI) for C2 and C3 were 0·69 (0·54, 0·89) and 0·71 (0·54, 0·94), respectively.
Table 4 Multivariable logistic regression models for the association between total DDS and variety in food intake and prevalence of depression in the PREDIMED-Plus study participants. Odds ratios (95 % confidence intervals) (total population = 6625)
C, category; DDS, dietary diversity score; Q, quartile (Q1, less diversity; Q4, more diversity).
* DDS/food group measure as continuous variables in order to estimate P for trend.
Values are presented as OR and 95 % CI for prevalence of depression (≥18 p at Beck Depression Inventory II and/or a current depression diagnosis) as categorical variable according to total DDS and variety in food intake.
Model 1: Adjusted for sex and age.
Model 2: Additionally adjusted for energy intake, smoking habits, physical activity, educational level, BMI, living alone, civil status, sleep duration and presence of chronic diseases.
Values presented in bald showed a statistically significant association (P < 0·05).
DDS cut-off points for each quartile: (Q1 = 0·8–3·9, Q2 = 4·0–4·6, Q3 = 4·7–5·4, and Q4 = 5·5–8·0).
The variety in each food group was classified into four categories (C): (C1 = 0 points), (C2 => 0–≤0·5 points), (C3 => 0·5–<1 points) and (C4 ≥ 1 point).
In ancillary analyses performed, we excluded all depression cases in which age of depression diagnosis was not available or in which the diagnosis date was very remote (more than 10 years before enrolment) (n 1378). In this subsample (n 5247, cases = 394), the results were no longer significant although the magnitude of effect was quite similar to that observed in the overall sample. OR and 95 % CI for successive quartiles of DDS were 1 (ref.), 0·92 (0·68, 1·24), 0·87 (0·64, 1·17) and 0·81 (0·60, 1·10).
Longitudinal associations between total dietary diversity score and variety in food intake and changes in depressive symptomatology after 2 years of follow-up
The association between total DDS and variety in food intake and changes in depressive symptomatology after 2 years of follow-up is presented in Table 5. We did not find any significant association between total DDS or each of the food groups considered and changes in depressive symptomatology after 2 years of follow-up even after adjustment for potentially confounding factors, except for the vegetable group (β-coefficient for C4 = 0·70, 95 % CI (0·05, 1·35)), which, unexpectedly, showed a positive association with an increase of depressive symptomatology over time.
Table 5 Change in Beck Depression Inventory-II score across quartiles of DDS and variety in food intake after 2 year of follow-up in the PREDIMED-Plus trial. β-Coefficients and 95 % confidence intervals (total population = 3860)

DDS, dietary diversity score; Q, quartile (Q1, less diversity; Q4, more diversity).
Values are presented as β-coefficients and 95 % CI for changes in depressive symptomatology after 2 years of follow-up as continuous variable according to total DDS.
Model 1: Adjusted for sex and age.
Model 2: Additionally adjusted for depressive symptomatology at baseline, smoking habits, physical activity, educational level, BMI, living alone, civil status, sleep duration, presence of chronic diseases, allocation group and recruitment centre.
Values presented in bald showed a statistically significant association (P < 0·05).
DDS cut-off points for each quartile: (Q1 = 0·8–3·9, Q2 = 4·0–4·6, Q3 = 4·7–5·4 and Q4 = 5·5–8·0).
The variety in each food group was classified into four categories (C): (C1 = 0 points), (C2 => 0–≤0·5 points), (C3 => 0·5–<1 points) and (C4 ≥ 1 point).
Considering that the allocation group could exert an interaction with DDS and/or variety in food in depression, we explored this fact in the multivariate analysis. This variable was not an ‘effect modifier’ in the association between the changes in depressive symptomatology and DDS/food groups (P for interaction >0·05) (data not shown). In order to avoid that the exclusion of individuals with high baseline depressive symptomology or with prevalent depression at baseline limits the possibility of finding longitudinal associations, we performed an ancillary analyses, not excluding those subjects with a Beck-II punctuation higher than 18 points at baseline or with prevalent depression at baseline. In the subsample analysed, the results obtained were not significant; however, the magnitude of the effect observed was quite similar to that found in the overall sample.
Discussion
The present analysis was conducted as an observational prospective cohort study within the PREDIMED-Plus trial. In the cross-sectional analysis, total DDS was inversely associated with prevalent depression. Thus, study participants with higher DD (Q4) showed a significant decrease in the odds of depression compared to participants with lower DD (Q1). Taking into account each of the components of the total DDS, the consumption of a high diversity of vegetables, cereals and proteins also showed an inverse association with prevalence of depression in cross-sectional analyses. Nevertheless, in the longitudinal analysis, after 2 years of follow-up we did not find any significant association, except for the vegetable group, which, unexpectedly showed a positive association with an increasing risk of depressive symptomatology over time.
Some authors have pointed out that monotonous and unhealthy dietary patterns are directly associated with a higher risk of depression in community-dwelling adults(Reference Lai, Hiles and Bisquera36). According to our cross-sectional results, this study primarily showed that the variety of some food’s groups is related to lower prevalence of depression, particularly for vegetables, cereals and proteins diversity. A possible explanation for this finding could be that these food groups have a specific role against oxidative stress and brain signalling which could contribute to reduce depression in adults(Reference Lai, Hiles and Bisquera36). Particularly, the beneficial role of dietary fibre (main component of some food groups as vegetables, fruits and whole cereals) in the prevention of depressive disorders maybe related with gut microbiota composition and activity, including some mechanisms linked with the gut–bran axis, immune, neural and metabolic pathways involved in depression(Reference Liu, Cao and Zhang37,Reference Sanchez-Villegas, Zazpe and Santiago38) . For instance, whole grains and vegetables are rich sources of fibre, antioxidant vitamins and flavonoids; meanwhile, protein food (fish and seafood, white meat, legumes, nuts and eggs) contains folate and B-vitamins. Furthermore, these food groups are important components of the Mediterranean diet, which has been extensively reported with lower likelihood of depressive symptoms in older adults(Reference Skarupski, Tangney and Li39,Reference Sánchez-Villegas, Martínez-González and Estruch40) .
In nutritional epidemiology, dietary pattern analysis has emerged as an alternative and complementary approach to examining the relationship between diet and the risk of chronic diseases. Instead of looking at individual nutrients or foods, pattern analysis examines the effects of overall diet(Reference Hu41). This approach is able to assess the overall food pattern because it goes beyond nutrients or foods and examines the effects of the overall diet, capturing a wide range of potential interactions between different nutrients and foods(Reference Hu41). According to this concept, we constructed a DDS originally developed by Kant et al. (Reference Kant, Schatzkin and Harris26) that reflects the diversity of food and provides greater knowledge about the dietary pattern in an objective way.
Our cross-sectional results showed that total DDS had an inverse association with depression at baseline. Participants in the highest DDS quartile showed a significantly lower depression prevalence compared to those participants in the lowest quartile. The results of the present study are in line with previous studies which employed self-reported questionnaire to evaluate depressive symptomatology that have shown the same trend in a cohort of Chinese pregnant women(Reference Jiang, Mo and Li15) in a cohort of a Japanese community-dwelling aged 65 years or older(Reference Yokoyama, Kitamura and Yoshizaki42) and also, in the PREDIMED-Plus cohort(Reference Cano-Ibáñez, Serra-Majem and Martín-Peláez43). This association could be related to the fact that a dietary pattern which contains more healthy food sources of major nutrients, such as vitamins and minerals, would decrease the risk of depression given that nutrients may affect brain development and functioning as we mentioned previously(Reference Sanchez-Villegas and Martínez-González44,Reference Salehi-Abargouei, Esmaillzadeh and Azadbakht45) .
However, we have to highlight the fact that the reported analyses are cross-sectional. In this sense, a cross-sectional study does not provide the temporal relationship between food intake and depression. That is, nutrition could play an important role in the development, course and treatment of depression, but at the same time depressive symptoms might also predict the adoption of poor diet (‘reverse causality’)(Reference Rahe, Berger, Baune and Tully46). In fact, some authors have pointed out that depressed individuals tend to have unhealthy behaviours such as engaging in less physical activity and poor dietary habits(Reference Brailean, Curtis and Davis47). Either way, recent meta-analyses have indicated that dietary interventions based on adherence to healthy dietary patterns produce not only a reduction in depressive symptoms but also a lower risk of developing depressive symptoms in non-clinical populations(Reference Firth, Marx and Dash48).
Although an inverse association was observed in cross-sectional analyses, we did not find any statistically significant association between total DDS (or the variety of food groups) and depressive symptomatology after 2 years of follow-up, except for the variety of vegetable food group. Although some prospective studies have pointed out that the intakes of some food groups, fundamentally fruits and vegetables and protein food groups (meat and fish), are protective against (incident) depression and depressive symptoms in non-European elderly populations(Reference Tsai, Chang and Chi49), several methodological aspects such as the use of different questionnaires, the measure of total intake instead of DD, the disease induction time or the brevity in the follow-up period could explain the differences observed between our study and other published analyses. In line, with our longitudinal findings, the MooDFOOD randomised clinical trial reported that among overweight or obese adults with subsyndromal depressive symptoms and multinutrient supplementation compared with placebo did not reduce episodes of major depressive disorder during 1 year(Reference Bot, Brouwer and Roca50).
The current study has some limitations that should be noted. First, the results cannot be extrapolated to other populations, as the PREDIMED-Plus study population (participants with overweight or obesity and MetS) is not representative of the general population; however, our study population represents a significant proportion of current Western societies. Second, although the FFQ is a nutritional validated tool(Reference Martin-Moreno, Boyle and Gorgojo23), self-reporting questionnaires, in combination with memory loss of older participants, might lead a no differential misclassification bias. Nevertheless, this bias would tend to the null value, so the association would be greater than observed. Moreover, we excluded participants with energy intakes outside of predefined limits proposed by Willet et al. (Reference Willet22) using in addition the residual method in order to adjust for energy intake. Third, the DDS is a simple count of food groups consumed developed as indicator of nutritional adequacy that excludes non-recommended food products that are high in sugar, saturated fatty acids and meats owing to the high-energy density of these foods, as well as their low-nutrient density with high levels of Na, sugar and saturated fat. Thus, we considered that any intake of these not recommended food products would not increase DD. Despite this, we have not distinguished the subgroups foods following the original categorisation proposed by other authors(Reference Golpour-Hamedani, Rafie and Pourmasoumi17,Reference Kant, Schatzkin and Harris26) . We have previously shown that this score which evaluates DD is correlated to better micronutrient intake and overall dietary quality in the Spanish older adult population(Reference Cano-Ibáñez, Gea and Martínez-González11,Reference Cano-Ibáñez, Barrios-Rodríguez and Lozano-Lorca18) .
Fourth, a selection bias may be present, since after 2 years of follow-up, only the healthiest participants would remain in the longitudinal study, producing an attenuation of the association found. Furthermore, significant associations were found only in cross-sectional analysis, but not in longitudinal, so we cannot elucidate a possible reverse causality. Finally, the follow-up time considered (only 2 years) is probably too short to assess changes in the primary outcome.
However, our study presents several strengths that enhance our findings. We used a repeated and validated measurement of the outcome over 2 years. Another strength is that, besides the use of a DDS that provides a more intuitive view of the whole dietary pattern, we also examined the variety of each food group, which allowed us to identify some of them as important components linked to depression. Another strength is the large sample size with a multicentre design and a longitudinal approach. Finally, the considerable amount of participant information collected using a standardised protocol that reduces information bias regarding reported food intakes, sociodemographic characteristics and lifestyle variables are other strengths that should be taken into account.
Our results suggest that recommending diets with high diversity of vegetables, grains and protein food groups (fish/seafood, white meat, nuts, eggs and legumes) may represent an effective approach to improve depression outcomes in community-dwelling population with overweight/obesity and MetS. That is, in people with depressive symptoms fostering dietary patterns such as the MedDiet would presumably result in a far greater impact over prevalence and symptomatology on depression. Nevertheless, these associations were only found in cross-sectional analysis. It is necessary to assess the entire cohort for longer in order to establish significant associations between DD and depression status.
In summary, our study found that higher DDS, and in particular, a high diversity intake of vegetables, cereals and proteins (fish/seafood, legumes, nuts, eggs and white meat) was inversely associated with depression status at baseline in community-dwelling older Spanish people. However, these result did not replicate in the longitudinal analysis. For that reason, further longitudinal studies with longer follow-up are needed to confirm our findings and deepen the understanding about the relationship between DD and depression status.
Acknowledgements
Acknowledgements: The authors especially thank the PREDIMED-Plus participants for their collaboration and the PREDIMED-Plus staff for their support and effort. CIBEROBN is an initiative of ISCIII, Spain. Financial support: The PREDIMED-Plus trial was supported by the European Research Council (Advanced Research Grant 2013–2018; 340918) grant to Miguel Ángel Martínez-González, and by the official funding agency for biomedical research of the Spanish Government, ISCIII through the Fondo de Investigación para la Salud (FIS), which is co-funded by the European Regional Development Fund (four coordinated FIS projects led by Jordi Salas-Salvadó and Josep Vidal), including the following projects: PI13/00673, PI13/00492, PI13/00272, PI13/01123, PI13/00462, PI13/00233, PI13/02184, PI13/00728, PI13/01090, PI13/01056, PI14/01722, PI14/00636, PI14/00618, PI14/00696, PI14/01206, PI14/01919, PI14/00853, PI14/01374, PI16/00473, PI16/00662, PI16/01873, PI16/01094, PI16/00501, PI16/00533, PI16/00381, PI16/00366, PI16/01522, PI16/01120, PI17/00764, PI17/01183, PI17/00855, PI17/01347, PI17/00525, PI17/01827, PI17/00532, PI17/00215, PI17/01441, PI17/00508, PI17/01732, PI17/00926, The Especial Action Project entitled: ‘Implementación y Evaluación de una intervención intensiva sobre la actividad física Cohorte PREDIMED-Plus’ grant to Jordi Salas-Salvadó, the Recercaixa grant to Jordi Salas-Salvadó (2013ACUP00194), grants from the Consejería de Salud de la Junta de Andalucía (PI0458/2013; PS0358/2016; PI0137/2018), the PROMETEO/2017/017 grant from the Generalitat Valenciana, the SEMERGEN grant, and CIBEROBN and FEDER funds (CB06/03), ISCIII. International Nut&Dried Fruit Council- FESNAD Nº201302: Miguel Ángel Martínez-González (PI). None of the funding sources took part in the design, collection, analysis or interpretation of the data, or in the decision to submit the manuscript for publication. The corresponding author had full access to all the data in the study and had final responsibility to submit for publication. Authorship: N.C.-I., A.B.-C., L.S.-M., S.M.-P. and A.S.-V. designed the study, performed the analysis and wrote the first draft of the manuscript. All authors contributed to the editing of the manuscript. All authors have read and approved the final version of the manuscript. Ethics of human subject participation: The trial was registered at the International Standard Randomized Controlled Trial (ISRCTN: http://www.isrctn.com/ISRCTN89898870) with number 89898870 and registration date of 24 July 2014. All participants gave written informed consent, and the study was approved by the Research Ethics Committees from all recruitment centres, according to the ethical standards of the Declaration of Helsinki.
Conflicts of interest:
Jordi Salas-Salvadó reports serving on the board of and receiving grant support through his institution from International Nut and Dried Fruit Council; receiving consulting personal fees from Danone, Font Vella Lanjarón, Nuts for Life and Eroski; and receiving grant support through his institution from Nut and Dried Fruit Foundation and Eroski. Emilio Ros reports grants, non-financial support and other fees from California Walnut Commission and Alexion; personal fees from California Walnut Commission and Alexion; personal fees, non-financial support and other fees from Aegerion and Ferrer International; grants and personal fees from Sanofi Aventis; grants from Amgen and Pfizer and personal fees from Akcea and Amarin, outside of the submitted work. Xavier Pintó reports serving on the board and receiving consulting personal fees from Sanofi Aventis, Amgen and Abbott laboratories; receiving lecture personal fees from Esteve, Lacer and Rubio laboratories. Lidia Daimiel reports grants from Fundación Cerveza y Salud. All other authors declare no conflicts of interests.


 Open access