


Neighbourhood environments may influence various health behaviours, including dietary intake. A recent literature review highlighted numerous studies reporting that greater access to neighbourhood grocery stores was associated with better dietary intake and lower obesity rates among adults(Reference Larson, Story and Nelson1). In contrast, greater access to convenience stores and restaurants, including fast food, has been associated with less favourable diet quality and increased obesity, although the findings are not consistent(Reference Cummins2). The distribution of food stores and inequities in access to healthy foods may be a particular concern in the USA(Reference Beaulac, Kristjansson and Cummins3) and has been widely cited as a promising target for large-scale public health interventions addressing obesity and healthy eating(Reference Khan, Sobush and Keener4).
To date, many studies have focused on adults, with less attention on youth(Reference Jago, Baranowski and Baranowski5, Reference Powell, Auld and Chaloupka6). Given that adolescence is marked by increasing independence over decisions including what to eat, where to go and how to spend money, this may be an important age during which food access affects dietary choices. Although studies among adults have focused primarily on residential access to food outlets, other studies highlight the proliferation of fast food and other food outlets around schools(Reference Austin, Melly and Sanchez7–Reference Zenk and Powell9). Thus, it is important to consider neighbourhoods surrounding both homes and schools to more fully understand environmental influences on youth. In addition, distinguishing between the dose of environmental exposure (i.e. the density of food stores or the number of food stores contained within a given area around one’s home or school) v. access (i.e. proximity or distance to the nearest food store) remains poorly understood in this population.
The purpose of the present study was to examine the extent to which food outlet proximity and density, particularly around adolescents’ homes and schools, was associated with dietary intake, food purchases and weight status.
Methods
Adolescents and one parent (n 349 pairs) from the Minneapolis/St. Paul metropolitan area were recruited for participation in the Identifying Determinants of Eating and Activity Study, as described in detail elsewhere(Reference Lytle10).
Neighbourhood-level measures
Geographic Information Systems (GIS) data were used to calculate the distance to and density of food outlets around the participants’ homes and schools. Food outlets included all restaurants (including fast food), convenience stores, grocery stores and any retail facilities identified using NAICS (North American Industry Classification System) codes, a common tool in this type of research for identifying business types(Reference Forsyth, Hearst and Oakes11). Purchased Dun and Bradstreet 2006 business data provided food outlet addresses. Automated geocoding resulted in 78–88 % of addresses being matched to GIS street databases for various types of stores; after extensive proofing of addresses using Internet and phone databases, this was raised to 94–100 %, depending on store type. Errors in addresses included incorrect zip codes, street numbers not in street database, word order problems, inconsistent abbreviations and typographical errors. These methods are described in detail elsewhere(Reference Samuelson, Lytle and Farbakhsh12). Network distances were calculated measuring distance from the participant’s home or school to food outlets along a street network using ArcGIS version 9 (ESRI, Redlands, CA, USA). Densities (number of stores within a specified buffer) were calculated in network buffer distances by dividing total neighbourhood food outlets by land area. For our purposes, we examined 800, 1600 and 3000 m buffers (∼0·5, 1 and 2 miles, respectively) to be consistent with previous study and maximize variability within this sample’s largely suburban geography.
Youth-level measures
Adolescents completed telephone-administered 24 h dietary recalls. Multiple dietary recalls are widely accepted as valid and reliable for dietary assessment, yielding acceptable validity in youth(Reference Lytle, Nichaman and Obarzanek13). Trained staff from the Nutrition Coordination Center (University of Minnesota) administered the recalls, using the Nutrition Data System for Research and a multiple-pass method(Reference Schakel, Sievert and Buzzard14). Three days of dietary recalls were obtained when possible, although only 2 d of data were obtained in a limited number of cases. Energy intake was examined for possible outliers (<2092 kJ/d (500 kcal/d), >20 920 kJ/d (5000 kcal/d)) as per standard procedures(Reference Willett15); no outliers were identified.
Adolescents’ reported factors related to demographics and energy balance. Fast food and convenience store food purchases were assessed by asking: (i) ‘In the past month … how many times did you buy food at a restaurant where food is ordered at a counter or at a drive-through window (there is no waiter/waitress)?’ and (ii) ‘How many times did you buy food at a convenience store, gas station, hardware store or a vending machine, outside of school?’ Nine response options ranged from never to ≥3 times/d. Item reliability and validity have been published elsewhere(Reference Nelson and Lytle16).
Adolescents’ weight and height were measured wearing light clothing. Trained staff assessed height using a Shorr height board (Irwin Shorr, Olney, MD, USA), and weight and body composition using a Tanita scale, a bioelectrical impedance device (TBF-300A Body Composition Analyzer; Tanita, Arlington Heights, IL, USA). BMI Z-scores were calculated using the US Centers for Disease Control and Prevention growth charts(Reference Kuczmarski, Ogden and Grummer-Strawn17).
Geocoded addresses and participant data were merged with US Census 2000 tract-level data. Median household income was chosen to account for area-level socio-economic status (SES). The percentageage of students receiving free or reduced-cost lunch accounted for school-level SES.
Analysis
Given the highly skewed distribution of the GIS-derived residential data (i.e. substantial number of buffers without food outlets of any given type, most likely due to zoning regulations restricting commercial land use within residential areas), we dichotomized density measures into the presence v. absence of facilities within specified network buffers. School-level density measures for 1600 and 3000 m buffers were more normally distributed (skewness <2·00), with a majority of school-level buffers (98 %) containing at least one food outlet; therefore, these were modelled as continuous variables. Given that measures of distance and density reflect unique constructs, both types of measures were included in the analytic phase.
We employed a two-stage analytical approach(Reference Forsyth, Hearst and Oakes11). First, we examined unadjusted associations between GIS-derived and diet- or weight-related variables (outlined in Table 1). For only those yielding significant associations (P ≤ 0·05), we examined adjusted models, controlling for parental education, adolescent sex, age, school-level and area-level SES. In adjusted models, we used a P ≤ 0·01 threshold to indicate statistical significance. We used this somewhat conservative approach to account for the many possible associations that could be examined and are typical in this type of research. In addition, interpretation of these results sought to identify robust patterns in findings across various features, rather than individual associations between specific variables. Adjusted models were generated using the SAS statistical software package version 9·1 for Windows (SAS Institute Inc., Cary, NC, USA) PROC GENMOD procedure using compound symmetry variance structure for generalized estimating equations with schools modelled as a random effect because the study recruitment approach resulted in clustering within schools. Identical models were run using PROC GLM to calculate r 2 statistics. Point estimates were similar between the two procedures.
Table 1 Descriptive statistics of the study sample
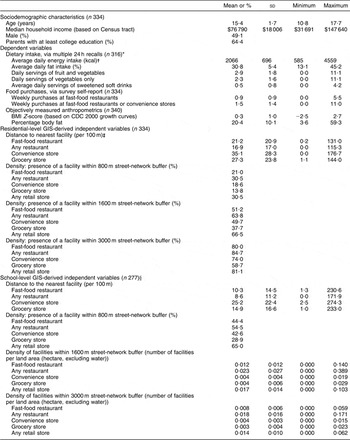
GIS, Geographic Information System; CDC, US Centers for Disease Control and Prevention.
*Number of participants with data for at least 2–3 dietary recalls.
†1 kcal = 4.184 kJ.
‡For example, these results could be interpreted as the average distance to the nearest fast-food restaurant was 2100 m from the participants’ homes.
§Includes participants with non-missing data for school-level free or reduced cost lunch and parent-reported level of education.
Results
Mean participant age was 15 (range: 11–18) years, and 48·8 % of the participants were male (Table 1). The sample was primarily Caucasian (93·4 %), reflecting the sampling region, which is 86·1 % whites overall(Reference Lytle10). Adolescents attended schools largely in suburban areas (83·6 % suburban and 16·4 % central city). Descriptive characteristics of adolescent dietary intake, food purchasing, weight status and body composition, as well as characteristics of the food environment around the participants’ homes and schools, are also presented in Table 1.
Neighbourhood- and individual-level associations
Significant adjusted estimates between individual adolescent characteristics (such as dietary intake and weight status) are presented in Table 2. Given that there was no significant association (P > 0·01) between energy, dietary fat, fruit and vegetables, vegetables alone, or fast food and convenience store purchasing and GIS variables, these estimates are not presented.
Table 2 Significant adjusted estimates from multi-level regression models modelling associations between residential and school neighbourhood characteristics and adolescent food intake or purchasing (P ≤ 0·01)

Models controlled for parent’s education, adolescent’s sex, age and median household income (at the census tract level) and accounted for clustering at the school level are included. Models utilizing data on sugar-sweetened beverage intake also included a covariate for number of days of recall data available (i.e. 2 v. 3 d). Only adjusted estimates that were statistically significant (P ≤ 0·01) are presented in the table. Dietary intake of energy, fat, fruit and vegetables and vegetables alone, as well as frequency of fast food/convenience purchases, yielded no significant associations with Geographic Information Systems variables in adjusted models, and thus are not presented.
*Generated using distance via street networks.
Adjusted models indicate that sugar-sweetened beverage (SSB) intake was negatively associated with distance from home to the nearest restaurant (β = −0·007, 95 % CI −0·01, −0·003) or grocery store (β = −0·005, 95 % CI −0·01, −0·001), with greater distance associated with less consumption. SSB consumption was also positively associated with food outlet density across a wide range of environmental measures, including having at least one fast-food restaurant, restaurant of any kind, convenience store, grocery store or any retail facility within a 1600 m residential network buffer, as well as the presence of a restaurant within 800 m. Furthermore, BMI Z-score and percentage body fat were positively associated with the presence of a convenience store within a 1600 m residential buffer (BMI Z-score: β = 0·26, 95 % CI 0·05, 0·48; percentage body fat: β = 2·17, 95 % CI 0·44, 3·91). All of these models assessing individual-level associations with home neighbourhood environments had relatively small r 2 values (0·10–0·13).
Only three school-level associations resulting from adjusted models were significant (data not shown). These included: (i) BMI Z-score being negatively associated with the presence of any restaurant within 800 m (β = −0·28, 95 % CI −0·50, −0·07; r 2 = 0·04); (ii) percentage body fat being negatively associated with the presence of a fast-food restaurant within 800 m (β = −2·61, 95 % CI −4·58, −0·64; r 2 = 0·35; and (iii) percentage body fat being negatively associated with the presence of any restaurant within 800 m (β = −3·20, 95 % CI −5·17, −1·23; r 2 = 0·36). Although the percentage variance explained in these latter two models was notable, a vast majority of this variance was explained by the covariates in the model; when the GIS variables were removed from these models, r 2 was 0·33.
Discussion
Although many diet- and weight-related variables examined here were not consistently associated with neighbourhood food environments, SSB intake notably yielded a positive and robust association with the presence of food and non-food retail facilities in the 800 and 1600 m residential buffers. Proximity and access may influence adolescents’ SSB consumption, given the convenience of these beverages, minimal cost and ubiquitous presence in a wide range of retail facilities. Findings from Wang et al.(Reference Wang, Gortmaker and Sobol18) show that an average excess intake of 468–690 kJ/d (110–165 kcal/d) may account for the excess weight gain observed among US children over the past two decades. Thus, environmental factors contributing to the daily consumption of one additional SSB may be sufficient to promote long-term weight gain in a significant proportion of youth.
In contrast, we did not detect similar significant and robust associations between other dietary characteristics and features of the neighbourhood environment around the home. It is possible that much of our suburban-residing sample may drive more than 3000 m to purchase food for home consumption, thus resulting in overall nutrient intake (e.g. energy or fat intake) having little association with local food availability.
BMI Z-score and percentage body fat yielded a moderate, positive association with the presence of convenience stores within 1600 m of the home. Although these findings were not particularly robust (i.e. yielding associations with a wide array of neighbourhood characteristics), they align well with two previous studies yielding similar results among youth(Reference Powell, Auld and Chaloupka6, Reference Liu, Wilson and Qi19). Previous studies illustrate that convenience stores offer large proportions of highly processed, energy-dense foods, compared to other types of retail food outlets, and supermarkets offer a greater variety of more healthy foods(Reference Glanz, Sallis and Saelens20, Reference Zenk, Schulz and Israel21). Not all previous studies, however, have detected a relationship between these food outlet densities and childhood weight gain(Reference Sturm and Datar22), perhaps underscoring the complexities of the aetiology of obesity.
Although numerous characteristics of the school neighbourhood environment yielded significant associations with diet-related behaviours in unadjusted analyses, most of these relationships were no longer apparent after controlling for covariates. However, few schools in our sample had zero food outlets within the specified buffer areas, meaning that nearly all schools had some food outlet ‘exposure’. Thus, it is possible that these school-level findings may be explained by the fact that the mere presence (v. absence) of at least one food outlet within close proximity had a greater impact on dietary consumption than the sheer number or density of nearby food outlets. In addition, students in our largely suburban sample may be less influenced by these food outlets if they are bused or driven directly to school (rather than walking or taking public transit).
Paradoxically, the few findings that were significant in our analyses of school neighbourhood environments were in the opposite directions to those that had been hypothesized (i.e. BMI Z-score or percentage body fat was lower among those who were exposed to fast food and/or any restaurants within 800 m of their school). These findings are difficult to explain and may reflect a variety of exposures (in the neighbourhood, as well as schools, families and other realms of influence) in the lives of these young people. The present study required a large number of statistical tests, and although we accounted for this by using relatively conservative procedures and α levels, these findings may reflect a statistical anomaly.
Overall, the specific impact of food outlet access on diet and weight remains somewhat unclear. Policy makers and key stakeholders are searching for guidance about how to positively affect dietary patterns, and additional research is needed to guide practice-based recommendations. Over the years, the implementation of nutrition education programmes has been logistically challenging, and impact has been limited. Thus, attention has turned towards changing the physical infrastructure as a means of addressing obesity. Numerous local governments have proposed changes to zoning, food licensing and other factors in hopes of improving healthy food availability and limiting access to less healthy foods(23).
However, in addition to access, food choices also reflect an array of personal and social values. Although previous studies have reported associations between food access and diet-related factors, overall associations have been rather small in magnitude, with inconsistencies in findings between the USA and other international settings(Reference Beaulac, Kristjansson and Cummins3). In fact, much of the US association between food access and obesity may be attributed to SES-based disparities in access, which have been widely documented(Reference Larson, Story and Nelson1). It is possible that in food-rich environments where access is unrestricted, social influences and personal preferences affect consumption more than physical environments(Reference Lytle24).
The present study had numerous strengths (e.g. using state-of-the-art dietary intake assessment and measured heights and weights) as well as limitations. The study was conducted only in one region of the USA and included a small, non-representative youth sample. The inherent limitations of GIS data, particularly with regard to describing food environments, are also well known(Reference Lytle10, Reference Lytle24). Bader et al.(Reference Bader, Ailshire and Morenoff25) found that disagreements between data sources were not significantly correlated with influential covariates, such as SES, but still found substantial disagreements between sources (e.g. a 17·6 % disagreement between data sources as to whether a supermarket or grocery was present on a city block). Although commercial food business databases have limitations in data quality, we took extra effort to manually check and ensure the accuracy of addresses in our purchased data(Reference Samuelson, Lytle and Farbakhsh12, Reference Matthews, Moudon and Daniel26).
Furthermore, the selection of an appropriate buffer size is a difficult issue that deserves additional attention in future studies(Reference Larson, Story and Nelson1). Although most of the study on neighbourhood food environments has examined ecological associations between environmental factors and dietary intake, with relatively crude classifications of ‘neighbourhoods’ (e.g. exploring food store availability within Census tracts, zip codes or states), the studies that have used GIS buffers to more narrowly define the neighbourhood food environment have not employed a consistently defined buffer size. Buffer sizes have included 100 m(Reference Bodor, Rose and Farley27), 1000 m(Reference Bodor, Rose and Farley27), 0·5(Reference Laraia, Siega-Riz and Kaufman28, Reference Jeffery, Baxter and McGuire29), 1(Reference Jeffery, Baxter and McGuire29) and 2 miles(Reference Jeffery, Baxter and McGuire29). The use of a larger buffer size to examine neighbourhood food environments may better reflect the fact that a substantial proportion of people (particularly within the USA) do not live within walking distance of their primary food store. For example, Moore et al.(Reference Moore, Diez Roux and Nettleton30) found that only 47 % of US adults reported doing most of their food shopping within 1 mile of their home. In addition, Rose and Richards(Reference Rose and Richards31) found that only 38 % of low-income adults shopped for food ≤1 mile from their home, with an additional 35 % shopping within 1–5 miles and 27 % shopping >5 miles from home. Therefore, the buffer sizes used in the present study may generally capture the areas in which some of our adolescent participants (and/or their families) do their food purchasing, but others may purchase food outside this area of exposure. In the present study, we were not able to measure specific food purchasing or eating behaviours in terms of the most relevant exposures in the food environment. This is an important limitation.
Overall, adolescence is an important developmental age accompanied by notable declines in a range of health behaviours. Numerous studies indicate that increased fast-food intake and eating away from home is associated with substantially lower diet quality among youth(Reference French, Story and Neumark-Sztainer32–Reference Befort, Kaur and Nollen34). Our results suggest that neighbourhood environments surrounding the home are particularly associated with adolescents’ consumption of SSB. Intervention strategies to promote healthy dietary patterns among adolescents are needed, some of which should include macro-level policy approaches. However, the decision-making processes that occur around dietary choices are highly complex, and nutrition promotion efforts will likely need to employ multiple approaches, including environmental availability and accessibility as well as other strategies, to be successful.
Acknowledgements
The present study was funded through NCI’s Transdisciplinary Research in Energetics and Cancer Initiative (NCI Grant 1 U54 CA116849-01), Principal Investigator: Robert Jeffery, PhD. Additional salary support was provided by NCI (K07CA126837). The content of this work is solely the responsibility of the authors and does not necessarily represent the official views of the National Cancer Institute. NCI did not play a role in designing the study, collecting the data or analysing/interpreting the results. There are no conflicts of interest. M.N.L. was responsible for drafting the manuscript and M.O.H. was responsible for analysing the data. A.F. was responsible for the GIS measurement. L.L. designed the original study, and all authors contributed to the editing and revising of the manuscript.


