


The production, sale and consumption of pre-packaged foods have witnessed a major surge in recent years in India( 1 ). Food labelling is one of the important population-based approaches that can help consumers make healthy food choices by providing the necessary information about the food on the packaging( Reference Mahan and Escott-Stump 2 ). The food label is one of the most important and direct means of communication of product information between buyers and sellers( Reference Wardlow and Insel 3 , Reference Satia, Galanko and Neuhouser 4 ). Ideally, for consumers, food labels are tools to make informed and healthy choices. Food labels can also be viewed as potentially powerful tools of nutrition communication( Reference Goldberg 5 ). In the Indian context, where overweight, obesity and the resultant non-communicable diseases are increasing( Reference Krishnaswamy 6 – Reference Popkin, Horton and Kim 9 ), the possible effect of food labels in discouraging consumption of unhealthy foods needs to be explored.
Packaged foods hitherto sold in many Indian markets were labelled only with the product name, manufacturer's name and address, amount of product in the package, its ingredients and date of expiry. Recently, nutrient content declaration has been made mandatory on nearly all pre-packaged foods( Reference Laxmaiah, Sudershan and Subba Rao 10 ). As per the current regulation, information on the following nutrients has to be displayed per serving or 100 g/ml of food: energy (kcal); carbohydrate (g); total sugars (g); added sugar (g); total fat (g) including saturated fat (g); trans-fat (g); and cholesterol (mg). Therefore, consumers have more nutrition information due to expanded food labelling mandated by the Government of India. While there is no doubt that food labels will encourage healthy eating, there is increasing evidence from developed countries (where food labelling is more evolved) indicating that mere display of food labels cannot help consumers make informed choices( Reference Cowburn and Stockley 11 ). However, there are very few studies in India that have looked into consumer knowledge, perceptions and practices pertaining to the use of food labels for making food choices. A recent study conducted by the National Institute of Nutrition, India on the current scenario of food labelling in the country concluded that food labelling regulations in India are on a par with those of developed countries; however, the concept of displaying nutrition information in relation to RDA is not mandated. Moreover, the study also concluded that there is hardly any research examining the knowledge, practices and use of food labels by Indian consumers( Reference Laxmaiah, Sudershan and Subba Rao 10 ). The study also reiterated the need for nationwide studies to understand consumers’ knowledge and practices related to food labels for formulating strategies to make them user-friendly. Given this background, the present study was conducted with the objective to assess the knowledge, perceptions and practices related to use of food labels among Indian consumers of different age groups.
Methodology
Study design
The present study was a cross-sectional consumer market survey using a stratified random sampling technique.
Participants
The study participants were drawn from different age groups, namely adolescents (10–19 years), adults (20–59 years) and the elderly population (≥60 years).
Study location
The study was carried out in two metro-cities of India (one each from north and south India): New Delhi and Hyderabad. Each metro-city was divided into four natural strata: north, south, east and west.
Ethical clearance
The study was cleared by the Institutional Ethical Committee of the National Institute of Nutrition, Hyderabad, India (vide NIN Protocol No. 01/2011/I).
Data collection
Both quantitative and qualitative research methods were used for data collection.
Quantitative data collection
For obtaining the quantitative data, a pre-tested questionnaire was administered to consumers as part of intercept surveys conducted at exit points of randomly selected supermarket sites. This questionnaire elicited information from respondents on demographic characteristics (gender, age, education, profession, family type, etc.) as well as data on important considerations while buying pre-packaged foods, frequency of checking labels and food-related information sought from labels (like nutrition facts, ingredients, shelf-life, quality symbols, etc.). This information was triangulated with qualitative data collected by conducting focus group discussions (FGD).
Sample for quantitative data collection
Assuming that 25 % of consumers buying pre-packaged foods check food labels, taking 95 % confidence interval and 20 % relative precision, the sample size for quantitative data collection was calculated to be 300 per age group, making a total sample of 900 (300 × 3 age groups) from each metro-city. The total sample size for the study therefore was to be 1800 (900 per metro-city × 2 metro-cities).
In order to select the required sample of 900 per metro-city, each metro-city was divided into four natural strata and 300 in each age group (75 individuals × 4 strata) were selected from twenty randomly selected supermarkets.
Qualitative data collection
Qualitative data were collected by conducting twenty-one FGD, with eleven in Hyderabad and ten in New Delhi (≥3 per age group in each metro-city).
Respondents for qualitative data collection
None of the participants in the FGD participated in the questionnaire survey. The homogeneity of the participants in the FGD was limited to the facts that they all buy pre-packaged foods and belong to a particular age group. Gender homogeneity was considered only among the adult and elderly groups, whereas among adolescents mixed groups were taken. Each focus group had four to nine participants. Almost all the FGD among adult and elderly groups were arranged at housing societies, senior citizens’ associations, recreational clubs or workplaces and participants were recruited by snowballing through a contact person. FGD with adolescents were conducted in school/college settings after seeking necessary permissions from heads of the respective institutions.
Preparation of discussion points
A theme guide, which listed the themes/topics around which the discussion would focus, was used. The specific questions were derived from the survey questionnaire. Probes were used to extract all the related information covered in the survey questionnaire. The themes for FGD included the following: pre-packaged foods that are usually bought; why pre-packaged foods are preferred; considerations while buying pre-packaged foods; what aspects of labels are checked; what are the reasons why labels are checked or not checked; and suggestions for improving the user-friendliness of labels.
Conducting focus group discussions
The team consisted of a moderator and two note takers (who were trained to conduct FGD in a standardized way). The FGD were conducted at the locations convenient to the participants after taking informed consent. The FGD were conducted in Hindi/English or Telugu and were recorded using a tape recorder, video camera and/or sometimes a cellular phone with the permission of the participants. The recorded discussions were transcribed on the day after the discussion by the note takers using the notes, supplemented by the audio/video recordings especially when more than one person had spoken at the same time.
Data analyses
The quantitative data were scrutinized and checked for consistency before being entered on a computer. The statistical software package SPSS Statistics for Windows version 17·00 was used for analysis of data. Descriptive statistics like percentages, frequency distribution as well as cross-tabulations were done and the χ 2 test was used to assess the significance of associations between variables.
From the qualitative data, individual FGD reports were compiled with the help of the respective moderators by one of the investigators. In compiling the individual reports, raw data were organized into codes (according to the method suggested by Krueger( Reference Krueger 12 ) and Newman( Reference Newman 13 )) based on the themes. Then separate documents were produced for each city by including the comments of the girls from the respective groups in response to the themes raised during the discussions. These reports were read independently by two other investigators who agreed on the interpretations at both stages. All of these individual reports were in turn compiled, and similar findings were grouped under each theme with relevant comments to present the results.
Results
Demographic profile of the consumers
A total of 1832 individuals of three age groups, i.e. adolescents (10–19 years), adults (20–59 years) and senior citizens (≥60 years), who had purchased pre-packaged foods from various supermarkets were approached in Hyderabad and New Delhi to conduct the exit market survey. It was observed that a higher proportion of men shopped for pre-packaged foods than women (58·7 % v. 41·3 %). Almost all consumers were literate (99 %) and the majority (60·8 %) of them were graduates. About 97·5 % of adolescents were students and 13·4 % of the adults were employed. Almost half of the elderly consumers were retired. Over 20 % of the adults and elderly were housewives and about 7 % were in business professions. The majority of consumers (58·4 %) belonged to nuclear families (Table 1). The profile of the participants of the focus groups is provided in Table 2.
Table 1 Demographic profile (%) of supermarket shoppers who participated in the survey, New Delhi and Hyderabad, India

*Nuclear family: a household comprising a married couple and their unmarried children.
†Joint family: a household comprising two or more married couples with or without their married children.
‡Extended family: a household comprising a married couple, with or without their unmarried children and their unmarried or widowed brothers or sisters, father and mother.
Table 2 Profile of participants in the focus group discussions, New Delhi and Hyderabad, India
Frequency of purchasing pre-packaged foods
Over 12 % of all consumers reported buying pre-packaged foods every day, with the highest proportion among adolescents (15·7 %) and the lowest (7·1 %) among the elderly. Over 44 % of the consumers reported that they bought pre-packaged foods once weekly, while about a quarter of them bought every fortnight. The proportion of consumers who bought pre-packaged foods monthly was 14·4 % (Fig. 1). In focus group studies too it was reported that pre-packaged foods have become very common and almost all respondents reported that they buy pre-packaged foods very often:
‘Nowadays, almost all food items are sold in packed form. Even the very small shops and the neighbourhood kirana [provisional] stores are selling foods in packed form only to increase their sales. So we often end up buying packed foods … often … every time [smiles].’ 48-year-old graduate woman, Hyderabad
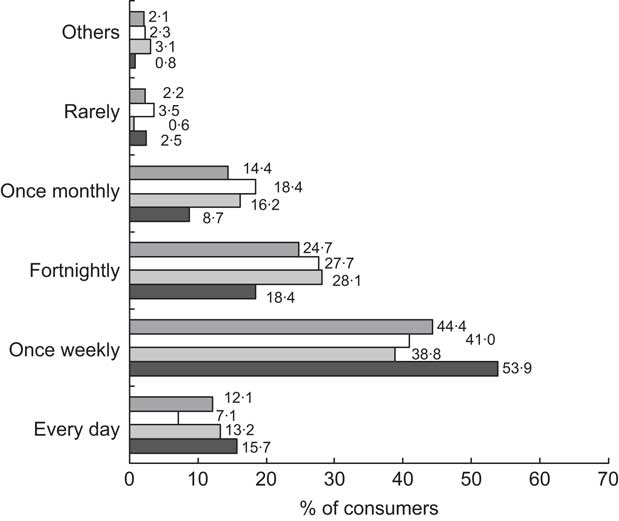
Fig. 1 Frequency (%) of purchase of pre-packaged foods according to age group (![]() , total sample, n 1832;
, total sample, n 1832; ![]() , elderly aged ≥60 years, n 603;
, elderly aged ≥60 years, n 603; ![]() , adults aged 20–59 years, n 619;
, adults aged 20–59 years, n 619; ![]() , adolescents aged 10–19 years, n 610), New Delhi and Hyderabad, India
, adolescents aged 10–19 years, n 610), New Delhi and Hyderabad, India
Pre-packaged foods purchased
The pre-packaged foods that were reported to have been purchased on the date of the survey were milk (51·7 %), followed by biscuits (40·0 %), snacks and savouries (28·1 %), beverages (27·0 %), oils (27·0 %), bakery foods (23·5 %), confectionery (23·4 %), cereal products (23·7 %), pulses (22·3 %) and spices, and the least was jams/jellies and marmalades (14·3 %). When asked in the FGD about the frequently purchased pre-packaged foods, all the above foods except milk were reported by the respondents across the age groups, with more adolescents preferring instant noodles, biscuits, confectionery and sweets. Some of the elderly reported that they preferred to buy perishable foods like meat, panneer (cottage cheese), peas, etc. fresh rather than opting for frozen ones:
‘Mommy usually gets the provisions. If I buy, I mostly go in for snacks, chips, chocolates, toffees, juices and soft drinks.’ 18-year-old girl, Delhi
‘We get almost all foods in packed form, except vegetables and fruits. These days, some stores are packing potatoes and even onions and we can see only the price on the label. But we prefer at least these things farm fresh and do not choose frozen panneer [cottage cheese], frozen meat or peas’. 67-year-old man, Delhi
Considerations while buying pre-packaged foods
When asked about what they considered most while buying the pre-packaged foods, most of the respondents (>90 %) in all age groups reported that they went by taste closely followed by price (87 %). Taste was a bigger consideration for choosing pre-packaged foods among as many as 90 % of the adolescents and an almost equal proportion of adults, but fewer of the elderly. It was found that the label information was considered by 71 % of the consumers of all age groups (Table 3). The adult and elderly groups in FGD considered that quality and quantity are assured in pre-packaged foods and assumed that adulteration is hardly possible. While brand name was the major consideration for buying these foods among adults and the elderly, for the adolescents taste was the major draw besides brand name. Some of the elderly expressed concerns about additives and chemical preservatives added in pre-packaged foods:
‘Packed items are not adulterated. For example, if you get dhals [pulses] in local provisional stores, stones or other adulterants are usually present. We have to suffer a lot! These merchants are scared to adulterate the packed foods and therefore quality is maintained. The Government can check the packets and take action.’ 79-year-old man, Hyderabad
‘Taste and price are important! Of course, even if it is reasonably priced, if taste is not good, I change the brand.’ 15-year-old girl, school student in Delhi
Table 3 Important aspects (range in %) considered by urban supermarket shoppers (n 1832) while buying multi-ingredient pre-packaged foods*, New Delhi and Hyderabad, India

*Multi-ingredient pre-packaged foods included ready-to-cook/instant foods, confectionery and sweets, bakery foods, biscuits, snacks and savouries, jams/jellies and marmalades, and beverages.
†Always and sometimes.
‡Flavour, package size, etc.
Reading the label information
Most of the consumers (about 92 %) reported that they read food labels, of them about 40 % reported that they always checked food labels before buying pre-packaged foods. When asked why they checked food labels, safety (84 %) and genuineness/quality (45 %) were reported to be the major concerns; while only a fifth of them checked food labels for nutrition information (Fig. 2). Even in FGD, almost all respondents across the age groups informed that they read food labels. However, since they were concerned about the shelf-life and safety of products, they usually checked dates of manufacture and expiry. Hardly any of them reported that they checked labels for nutrition information. Some adolescent girls and women mentioned they did see the ingredients list as they were concerned about high-fat and high-sugar foods:
‘I think, nutrition facts are there on labels, but I don't see. But when buying for my father or mother, I see only cholesterol or fat, because normally doctors say that it is not good for health. I check the fatty acids composition especially trans-fats. Frankly speaking I do not know exactly about trans-fats though I know that they are not good for health. I check and often cannot decide based on these.’ 21-year-old man, Hyderabad
‘I mostly check for foods that claim to be low calorie or low fat. I cannot decide based on the values given if claim is not made.’ 15-year-old girl, Delhi
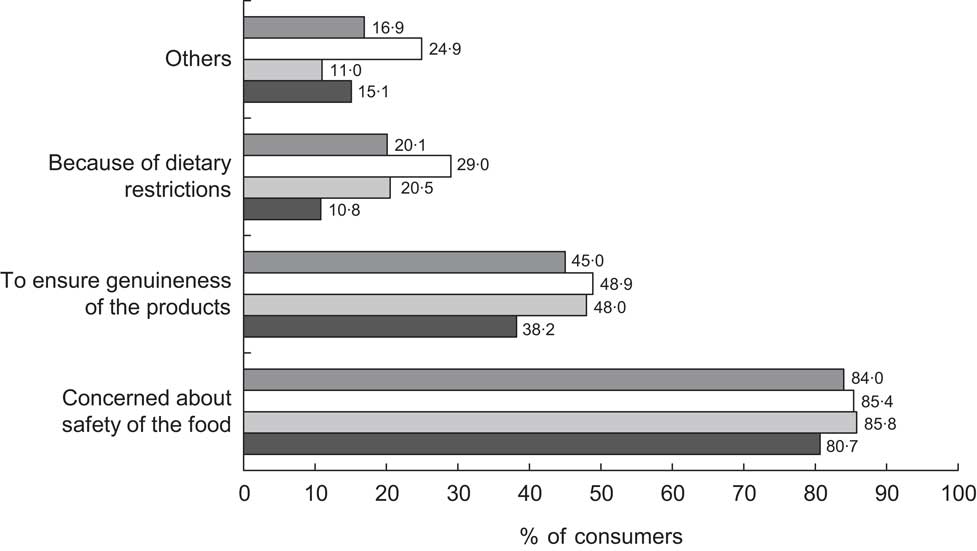
Fig. 2 Frequency (%) of reasons for checking the label information according to age group (![]() , total sample, n 1832;
, total sample, n 1832; ![]() , elderly aged ≥60 years, n 603;
, elderly aged ≥60 years, n 603; ![]() , adults aged 20–59 years, n 619;
, adults aged 20–59 years, n 619; ![]() , adolescents aged 10–19 years, n 610), New Delhi and Hyderabad, India
, adolescents aged 10–19 years, n 610), New Delhi and Hyderabad, India
Label information checked by consumers
Brand name (85 %) was the aspect most commonly checked by consumers, followed by date of expiry/best before date (80 %). The least checked was the list of ingredients (20 %) and less than 40 % of the consumers across the age groups reported that they checked ‘nutrition information’ on the food labels (Table 4). The qualitative data reiterated this observation. Most of the adults and elderly respondents reported that they usually checked ‘brand name’, ‘manufacturing date’, ‘expiry date’, weight and price on the labels. The nutrition information and ingredients were not checked by many. Some of them reported that they always buy ‘trusted’ brands and hence opined there was hardly any need to look at all these details. Participants (especially among adolescents and adult groups) who were vegetarians often checked for the vegetarian symbol on the food label. However, almost none of the elderly participants knew about the vegetarian and non-vegetarian symbols on foods:
‘I go by the brand … always buy the same brand therefore quality is assured.’ 67-year-old man, Hyderabad
‘I am vegetarian, so I look for green dot on the label.’ 25-year-old woman, Delhi
Table 4 Label information always/sometimes read (range in %) by urban supermarket shoppers (n 1832) according to age group, New Delhi and Hyderabad, India
NA, not applicable.
Multi-ingredient pre-packaged foods include ready-to-cook/instant foods, confectionery and sweets, bakery foods, biscuits, snacks and savouries, jams/jellies and marmalades, and beverages.
Single-ingredient pre-packaged foods include milk, fats and oils, cereals, pulses, flours, and spices and condiments.
Note: By regulation in India, milk is exempt from displaying vegetarian/non-vegetarian symbols on the label.
*Applicable only for ready-to-cook/instant foods and not other varieties of pre-packaged foods; therefore the values are not in ranges.
Consumers’ opinions on food labels
The majority of consumers (61 %) felt that labels were always useful, while 30 % felt that they were useful only sometimes in choosing foods. Most consumers (58 %) felt that the information provided on food labels was adequate. A quarter of consumers felt that food labels were fine the way they were now, while a third felt that symbols should be used instead of text on food labels to enable easier understanding of all the information. About 38 % of the consumers said that they would like to have some symbols and some text for a better understanding of food labels. From FGD, it was inferred that the adolescents usually did not bother much to check most of the information on labels. There were varied views expressed as to why they did not bother to read the labels, such as ‘it is too much of chemical terminology’, ‘nutrition information is too complicated’, ‘no major knowledge of nutrition’, ‘fonts are too small’ and ‘packages are too bright and glaring’. Most of them said they did not understand the technicalities of information especially on nutrition as they were not aware how each nutrient would impact their health. The scenario was same even among adults as they felt that the information was ‘too technical’, while the others said ‘it is too complex for common public (like us) to make sense of it’. However, a few women in Delhi and Hyderabad said, ‘if the products claimed low fat and low sugar or sugar free, it certainly helps in choosing healthy foods especially for those who are overweight, diabetic and have heart diseases’.
Education and habit of reading labels
In order to assess the association between level of education and the consumer practice of using food label information, the respondents were divided into the two groups: ‘up to high school’ (≤12th grade) and ‘university level’. It was observed that there was a clear positive association between level of education and the habit of reading labels, indicating that the higher the level of education, the greater the chance of reading the label information especially related to nutrient contents, nutrition and health claims, and quality symbols. It was observed that a significantly (P < 0·001) higher number of respondents with higher education were checking quality symbols and nutrition information in all the categories of pre-packaged foods than their counterparts with school education (Table 5).
Table 5 Association between consumers’ education level and checking various components of food labels* (n 1822), New Delhi and Hyderabad, India

NA, not applicable.
*Significant (P < 0·001) associations were found between level of education and reading all listed components of food labels.
Improvements needed to promote use of food labels
When asked about their views to improve food labels in order to promote their usage, many of the respondents across the age groups in the focus groups spoke about various aspects. Most prominent views aired by adolescents were regarding the need to increase font sizes. An adolescent girl in Hyderabad felt, ‘the government could make it mandatory to increase the font size of important information related to health and nutrition than the brand name and other unimportant details’. To this, her colleague added, ‘I feel location-specific information will be better! I mean, if you know where on the label you find nutrition information, where you could get to see date [of manufacturing] and where the ingredient list is … then wouldn't that be easy to check out for the information that you want’. Some men in Hyderabad and many women in Delhi indicated that either holograms or logos indicating foods that are healthy may be of some use. Women in a focus group in Delhi suggested that the instructions for storage need to be spelt out clearly on all labels. Elderly respondents were of the opinion that there was a need to create awareness about various components on the labels using mass media.
Discussion
An earlier study that looked into the food labelling scenario in India( Reference Laxmaiah, Sudershan and Subba Rao 10 ) emphasized the need to carry out studies on consumer use of food labels in order to assess whether the intended purpose of helping consumers make healthy food choices is being met through the revised food labelling regulations or not. Although Ali and Kapoor (2009)( Reference Ali and Kapoor 14 ) conducted a study on consumer perspectives on food labelling, it only attempted to assess the factors on the labels that influence consumer purchase decisions on pre-packaged foods and they used only a structured questionnaire to elicit responses. Similarly, AC Neilson (2005)( 15 ) tried to elicit information on nutrition labelling through a section of consumers using an Internet survey. The current study, to our knowledge, is the first ever comprehensive cross-sectional study conducted among consumers that used a qualitative research method (FGD) to triangulate the findings from the quantitative study.
As our earlier study indicated, the labelling regulations are on a par with those in advanced countries( Reference Laxmaiah, Sudershan and Subba Rao 10 ) and nutrition facts have been made mandatory on labels only recently. However, there are hardly any studies looking into the use of food labels in India, while studies elsewhere in the world have already started examining use of nutrition information on labels by consumers for making healthy food choices( Reference Satia, Galanko and Neuhouser 4 , 15 – 17 ). Given this context, the present study assessed not only the use of food labels but also the frequency of buying pre-packaged foods, the considerations for buying them and many such factors that may have a bearing on use of label information.
As regards buying pre-packaged foods, about 20 % of the respondents in the current study informed that they buy pre-packaged foods every day and about half of them informed that they buy them at least once weekly. Similar observations were made in earlier market surveys( 1 ) and an earlier study carried out by Ali and Kapoor( Reference Ali and Kapoor 14 ) who documented the growing consumer confidence and desire for pre-packaged and convenience foods in India. A survey carried out in rural India by Polasa et al. (2006)( Reference Polasa, Sudershan and Subba Rao 18 ) reported that about 59 % of households buy pre-packaged foods. In comparison, although the present study was conducted among urban consumers at supermarket sites who bought pre-packaged foods at the time of survey, the sheer number of consumers who said they buy pre-packaged foods at least once weekly was as high as 70 %. This is, in a way, indicative of the steady rise in consumption and projected per-capita expenditure on pre-packaged foods( 1 ).
Unlike in Western countries where more women shopped for foods in supermarkets, it was observed in the present study that a marginally higher number of men shopped for pre-packaged foods than women. This finding concurs with a recent study carried out on shoppers of food and groceries from retail stores in India( Reference Zameer and Mukherjee 19 ). In yet another study, most women respondents in focus groups conducted in south India reported that it was their husbands who shopped for food and groceries for the family( Reference Subba Rao, Sudershan and Rao 20 ).
The pre-packaged foods that were most frequently reported to have been purchased by the consumers were milk, biscuits, oils, beverages and confectionery. This finding is in concurrence with recent statistics pertaining to the market composition of pre-packaged foods in India, which reported that the major share is occupied by dairy foods (36·0 %), bakery foods (19·3 %), oils and fats (15·2 %) and confectionery (6·8 %) respectively( Reference Ali and Kapoor 14 ).
The most important considerations for buying pre-packaged foods were reported to be taste, closely followed by price. Taste, however, was an important consideration among adolescents. This was reiterated in the focus group studies as well. Similar observations were made in qualitative studies conducted among women and adolescent girls from south India( Reference Subba Rao, Sudershan and Rao 20 – Reference Sudershan and Subba Rao 22 ).
Although 71 % reported that the label is an important consideration while buying pre-packaged foods, it could be mostly to check the brand name, as indicated in the qualitative study where many respondents across age groups in both metro-cities reported that they usually go by brand name and in such cases seldom check the nutrition facts or ingredients on the label. They reported that they associated ‘big brands’ with quality. In the current study as many as 90 % of the respondents said that they regularly read food labels; however, they were concerned more about the safety aspects of foods especially related to their shelf-life. This obviously is the reason why most of them see only manufacturing and/or expiry dates. In India, food adulteration is a major concern. Estimates are that about 11 % of all foods sold in India are adulterated( 23 ). Therefore, many consumers are concerned about the quality, genuineness and shelf-life of foods. Earlier studies reported that households in India felt that pre-packaged foods were safe because they perceived that genuineness and quality of the product are ensured( Reference Subba Rao, Sudershan and Rao 20 – Reference Sudershan and Subba Rao 22 ).
Although the literacy rate of the urban population in India is over 84 %( 24 ), most (99 %) of our study population were found to be literate. Many research studies from across the world have concluded that there is a direct relationship between the education level of consumers and their habit of checking labels. Educated consumers are more likely to check labels (or even symbols) than their illiterate counterparts( Reference Subba Rao, Sudershan and Rao 20 , 25 – Reference Sudershan and Subba Rao 27 ). In the current study, although almost all respondents were educated, we found that there was a marked difference between the consumers who had school-level education and those who studied beyond high school. In the current study, it was observed that a greater number of those who had studied beyond high school were checking the nutrition information, ingredients and quality symbols than those with lower levels of education.
It was observed in the FGD that unlike men, women and adolescent girls who were concerned with ‘fat’ and ‘sugar’ intake were in the habit of checking the nutrition facts in order to choose low-fat/low-sugar foods. This is consistent with findings from other countries where more women than men have reported that they avoid high-fat foods. This specific attribute of choosing low-fat foods using the label information could be attributed to health motivation and the greater involvement of women and girls to control weight and its associated health and social problems( 28 – Reference Visschers, Hess and Siegrist 30 ).
From the quantitative data it was observed that over 75 % of the elderly consumers reported that they checked quality symbols on food labels; contrary to this observation, many of the elderly participants in the FGD were not aware of quality symbols including the popular vegetarian and non-vegetarian symbols. This reiterates the observation that quantitative techniques, especially questionnaire surveys to elicit information, often provide little information on whether the respondents actually behave in the way claimed( Reference Cowburn and Stockley 11 , Reference Worsfold and Griffith 31 ); hence the use of qualitative techniques like FGD has distinct methodological advantages.
In the FGD, some of the adolescents in Hyderabad reported that they knew quality symbols, especially ISI and AGMARK, as they were taught about them in school as part of their curriculum, but this was not so in Delhi. This may be due to the fact that nutrition-related topics, more so topics such as ‘reading food labels’, are not covered in the current school curricula in India( Reference Subba Rao, Vijayapushpam and Venkaiah 32 ). This clearly indicates that school curricula can be a point of intervention for educating adolescents about the use of food labels for making healthy food choices. This has a policy implication and there is a need for inclusion of reading food labels as part of nutrition education in future revision of the school curricula in India. Similarly, the elderly have repeatedly emphasized the use of mass-media campaigns to help them understand what food labels convey. Such public awareness campaigns with online information tools have been initiated by the regulatory authorities in countries like Canada and New Zealand( 33 , 34 ).
The European Food Information Council (EUFIC) study (2003)( 17 ) conducted in six European countries indicated that nutritional knowledge and an interest in healthy eating improve the ability of consumers to make correct health inferences from nutrition labels; thus nutrition and health education is imperative. Similarly a recent study in Singapore reported high food-label use among Singaporean shoppers, but reported that low levels of nutrition knowledge and health literacy were impediments in their understanding and use of nutrition information( Reference Vijaykumar, Lwin and Chao 35 ). In the present study also, although many consumers saw food labels for other considerations such as shelf-life, many participants across the age groups informed that the information seemed too technical and complex to them as they did not have any nutrition knowledge. Therefore, our study reiterates the need for basic nutrition education to ensure effective use of food labels. In addition, labels have to be made user-friendly. A review by Campos et al. (2011) found that food labels using graphics and symbols and labels with minimal numerical/text content were effective compared with ‘traditional’ nutrition labels with quantitative information on nutrient content( Reference Campos, Doxey and Hammond 36 ).
Study limitation
As the current study was carried out in metro-cities of India and among supermarket shoppers, most (99 %) of the respondents were incidentally literate, even higher than the national urban literacy rate (84·1 %). Therefore, the sample may appear to be skewed towards educated people. This indeed is a limitation of the study. Adequate caution needs to be exercised while generalizing the results of the present study to the population of India, as the overall literacy rate India is only 73 % with a much lower rate in the rural population (67·8 %).
Conclusions
To the best of our knowledge, the present study has assessed for the first time the practice of reading food labels in India in a cross-section of consumers in two metro-cities, using intercept interviews at the exit sites of supermarkets. Most of the respondents who buy pre-packaged foods informed that they buy almost all foods in pre-packaged form except perishable foods like fruits and vegetables. Consumers across the age groups preferred pre-packaged foods as they felt that the quantity (weight) and quality are ensured and adulteration is least possible. Although 90 % of consumers across the age groups reported that they checked food labels, most of them cited safety as an important concern for doing so. This justifies the finding that a majority of them only looked for manufacturing/expiry/best before dates. Another important finding is that only about a third of the consumers checked nutrition information and the list of ingredients. However, women, girls and elderly consumers who were concerned about fat, sugar or salt intake were checking the nutrition facts. The consumers felt that the nutrient information displayed on the labels is too technical to understand as most of them lack basic nutrition knowledge. A significantly greater number of consumers with higher education qualifications were checking the nutrition information as well as quality symbols.
Almost all age groups of consumers suggested that the font sizes be increased on the labels for better visibility of the information. In addition, position-specific display of label information and symbol-based labelling were suggested to be some of the possible options to be experimented to make food labels easy to understand. Some of them also suggested that ‘symbols’ or hologram-based food labels could be experimented to indicate ‘healthy’ or ‘unhealthy’ pre-packaged foods.
In the current study, some adolescent consumers who learnt about the quality symbols through their school textbooks were looking for them on the labels. Considering that school-based education could help build label reading skills among these young consumers, curricula can be a point of intervention for educating them. Curriculum developers in all regions across India could consider inclusion of reading food labels as part of nutrition education in future revision of the school curricula.
The current format of food labels is text-intensive and is inherently biased toward literate consumers. Moreover, all educated consumers need not necessarily be nutrition literate to make sense of text-intensive information display. Therefore, symbol-based information display could be of some help in increasing label use among consumers.
The current study indicates that the intention of promoting choice of healthy foods through consumer use of food labels is not being completely met. Therefore, there is a need to take up a two-pronged approach of creating public awareness on basic nutrition as well as on various components of food labels on the one hand and experimenting with newer ways of information display to make food labels consumer-friendly on the other.
Acknowledgements
Sources of funding: The study was supported by WHO-India Country Office, New Delhi. The funding agency had no role in the design, analysis or writing of this article. Conflict of interest: None declared. Authors’ contributions: S.R.V. developed the study protocol, secured funding and contributed to conducting the study; S.R.M.G. was involved in the development of questionnaires, conducting the qualitative studies, training of personnel and preparation of the manuscript; V.V.R.M. provided the statistical design and analysis; P.M. assisted in qualitative data collection in Delhi; L.A. supervised the study. Acknowledgements: The authors are extremely grateful to WHO-India Country Office for supporting the study. They especially thank Dr B. Sesikeran, Former Director, National Institute of Nutrition, Hyderabad, India for his encouragement; Professor T.K. Joshi, Director, Centre for Occupational and Environmental Health, Maulana Azad Medical College for providing logistic support in New Delhi; and all participants, field workers and secretarial staff who extended their cooperation for successful completion of the study.


