


Cash-based interventions have become a tool often used in social protection programmes in emergency and developing country contexts to alleviate poverty and food insecurity of lower socio-economic groups( 1 ). They refer to the direct provision of cash to selected recipients, generally to enable them to meet their basic food and non-food needs( Reference Garcia and Moore 2 ). Two major types of cash-based interventions have been implemented: (i) unconditional cash transfers (UCT) provide cash transfers without conditions; and (ii) conditional cash transfers (CCT) with specific prescribed conditions to be met by recipients before they receive the cash transfer. UCT are more often used in low-income countries in sub-Saharan Africa, whereas CCT are implemented in low- and middle-income countries (mainly in Latin America). Both UCT and CCT were shown to exert important positive impacts on beneficiary households’ food security( Reference Bastagli, Hangen-Zanker and Harman 3 ). Households receiving cash transfers had significantly more access to food( Reference Alviar, Davis and Handa 4 – Reference Miller, Tsoka and Reichert 9 ), increased energy consumption( Reference Gilligan, Margolies and Quinones 10 – Reference Tiwari, Daidone and Ruvalcaba 13 ) and more dietary diversity( Reference Miller, Tsoka and Reichert 9 , Reference Tiwari, Daidone and Ruvalcaba 13 , 14 ), which might reflect on child nutrition.
The potential of cash transfers to prevent child undernutrition is acknowledged in the literature( Reference Bailey and Hedlund 15 , Reference Ruel and Alderman 16 ). However, few rigorous studies have evaluated the impact of UCT on child nutrition( Reference Alviar, Davis and Handa 4 , Reference Haushofer and Shapiro 8 , Reference Akresh, de Walque and Kazianga 17 , Reference Seidenfeld, Handa and Tembo 18 ), particularly in sub-Saharan Africa where undernutrition remains a public health concern( 19 ). The Moderate Acute Malnutrition Out (MAM’Out) research project was conceived in response to identified needs of rural populations in Burkina Faso( Reference Tonguet-Papucci, Huybregts and Aissa 20 ). The MAM’Out study did not result in a significantly lower prevalence of acute malnutrition among young children( Reference Houngbe, Tonguet-Papucci and Altare 21 ). A qualitative study of the MAM’Out project found that cash transfers were used mainly to improve children’s and households’ food security and health( Reference Tonguet-Papucci, Houngbe and Lompo 22 ). Furthermore, a quantitative dietary intake study carried out in a sub-sample of the MAM’Out cohort revealed that children from households benefiting from the cash intervention had high intakes of fat, vitamin B12 and animal-source foods (flesh foods, eggs, milk and dairy products) compared with their peers belonging to the control group( Reference Tonguet-Papucci, Houngbe and Huybregts 23 ). However, that study was implemented on a sub-sample with no baseline data during the lean season and in the second year of cash transfer, thus limiting the generalizability of the findings. Based on the Lancet conceptual model of undernutrition( Reference Black, Allen and Bhutta 24 ), the MAM’Out cash intervention intended to impact multiple underlying causes of undernutrition( Reference Tonguet-Papucci, Huybregts and Aissa 20 ). In the present study we assess the impact of the MAM’Out cash intervention on households’ food security and children’s and caregivers’ dietary diversity. In addition, we explore if the impact of the MAM’Out cash intervention on these outcomes is modified by the initial status of food security and dietary diversity.
Methods
Overview of the MAM’Out project
The MAM’Out research project was implemented from June 2013 to October 2015 in Tapoa province, eastern region of Burkina Faso. The majority of the population living in Tapoa province belongs to the Gourmanche ethnic group. Households are predominantly polygamous with usually the husband as decision maker( Reference Cartry 25 ). Agriculture and animal husbandry are the main activities. Household food production is linked to rain-fed agriculture, with staple crops of millet, sorghum, maize and rice harvested once in a year. The rainy season lasts from June to September and corresponds to the lean season where households experience limited access to food( Reference MAFAP 26 ). Despite existing potentialities, agriculture faces a number of constraints among which are low access to agricultural inputs, climate variability with erratic rainfall, low soil fertility and poor post-harvest management, that create and maintain a chronic food insecurity situation.
The eastern region of Burkina Faso shows the highest proportion of people living at more than 10 km from the nearest health centre in the whole of the country (42·7 v. 21·2 % at the national level in 2011 as reported by the Ministry of Health). According to the Burkina Faso Demographic and Health Survey conducted in 2010, 92·3 % of women of reproductive age (15–49 years), who gave birth within the previous 5 years before the interview, reported to receive antenatal care offered by a qualified health provider. About 31 % of a sub-population of these women had a BMI below 18·5 kg/m2 ( 27 ). In Tapoa province, only two doctors are present for about 460 000 inhabitants. The province is covered by the Diapaga health district. This district includes a main health centre with surgical service, thirty-one primary health centres with an outpatient nutrition centre, and three nutrition rehabilitation centres. Malaria, respiratory infection diseases and diarrhoea were the main causes of child morbidity( 28 ). The prevalence of global acute malnutrition among children aged 6–59 months was 17·3 % (95 % CI 15·2, 19·7 %) in the province in April 2012 (2006 WHO growth standards)( Reference Tonguet-Papucci, Huybregts and Aissa 20 ). Access to water remains a challenge for communities. Access rate to water of good quality was estimated at 39·8 % in 2011( Reference Action Contre la Faim 29 ). This situation increases the frequency of waterborne diseases and contributes to aggravating the nutritional situation of the population. Moreover, children face numerous inadequate food practices: non-exclusive breast-feeding, low dietary diversification after the age of 1 year and insufficient number of daily meals( 28 – Reference Boucher-Castel and Chalimbaud 30 ). With regard to this situation, humanitarian intervention, especially targeting young children, was needed.
The MAM’Out study’s main objective was to evaluate the effectiveness of a UCT in preventing acute malnutrition among children under 3 years of age( Reference Tonguet-Papucci, Huybregts and Aissa 20 ). The study was designed as a two-arm cluster-randomized controlled trial with sixteen villages (clusters) in the intervention group and sixteen other villages in the control group. Poor and very poor households identified according to household economy analysis criteria (number of livestock, e.g. cattle, goats, chickens, sheep; number of acres cultivated; etc.)( Reference Boudreau, Lawrence and Holzmann 31 ), and with at least one child below 12 months, were included in the study. Details of the study design and participants have been described elsewhere( Reference Houngbe, Tonguet-Papucci and Altare 21 ). Participating households in the intervention group were offered seasonal UCT from July to November over two years (2013 and 2014). This period overlapped with the annual rainy season (May to September) to a large extent. A monthly allowance of 10 000 XOF (≈$US 17) was transferred to caregivers of eligible children via a personal mobile phone account provided by the project. Transfers were unconditional and no restriction on the use of the money was imposed. However, during initial information sessions, caregivers were told that the cash transfer was to support their child’s development and to prevent undernutrition.
Sample
The MAM’Out study was designed as a two-arm cluster-randomized controlled trial for which details on sample size calculations were published in the study protocol( Reference Tonguet-Papucci, Huybregts and Aissa 20 ). The present study sample stemmed from the MAM’Out sample used to estimate the effect of multiannual, seasonal UCT on the incidence of acute malnutrition in young children. In total, 1185 households (583 from the control group and 602 from the intervention group) from thirty-two clusters were assigned to either the intervention or control group( Reference Houngbe, Tonguet-Papucci and Altare 21 ).
Data collection
Food security comprises four key dimensions: availability, stability, accessibility and utilization. This multidimensional aspect of food security makes its measurement challenging. In the present paper, we assessed the accessibility dimension using experienced-based valid indicators at household and individual levels as recommended by Leroy et al. ( Reference Leroy, Ruel and Frongillo 32 ).
In total eight trained fieldworkers (four teams of two) collected all data from June 2013 to October 2015 during periodical home visits( Reference Tonguet-Papucci, Huybregts and Aissa 20 ). Due to operational time constraints, baseline data were collected one month earlier in the intervention group than in the control group to allow cash transfers to be started in due time. For follow-up measurements, children from both study arms were measured concomitantly. Pre-tested questionnaires were used to collect data on households’ food access, socio-economic and demographic characteristics and on caregivers’ and children’s dietary diversity. We used lot quality assurance sampling to supervise enumerators to ensure data reliability and quality throughout the study.
Household food access
Household food access refers to the fact that all household members, at all times, have both physical and economic access to the basic food they need( Reference Clay 33 ). Two measurement tools of food security, developed by the Food and Nutrition Technical Assistance project, were used to assess households’ access to food: monthly adequate household food provisioning (MAHFP) and household food insecurity access scale (HFIAS). Data on MAHFP were collected on a yearly basis, whereas HFIAS data were collected every 6 months using standardized questionnaires( Reference Bilinsky and Swindale 34 , Reference Coates, Swindale and Bilinsky 35 ).
The MAHFP questionnaire was used to identify periods of household food provisioning. Caregivers/heads of household from participating households were asked to recall months of not having enough food to meet family needs over the past 12 months. A point was allocated to each answer: ‘0’ (had enough food to meet household needs) or ‘1’ (did not have enough food to meet household needs). The MAHFP score was calculated by counting the number of months for which caregivers/heads of household declared there was no household food shortage( Reference Bilinsky and Swindale 34 ). MAHFP was used to capture the ability of households to respond to vulnerability and to ensure that food is available above a minimum number of months year-round( Reference Bilinsky and Swindale 34 ).
The HFIAS questionnaire is based on nine questions about anxiety and uncertainty about food supply, insufficient food quality and insufficient food intake and its physical consequences( Reference Coates, Swindale and Bilinsky 35 ). Caregivers were asked about the occurrence of a specific food insecurity condition over the past 30 d. If this specific condition happened, caregivers were then asked how often this happened in the same period. A score was given to each answer: ‘0’ if the condition never occurred, ‘1’ if it occurred one or two times, ‘2’ if it occurred three to ten times and ‘3’ if it occurred more than ten times. These scores were summed to compute the HFIAS score, ranging from 0 to 27. The lower the score, the more food secure (access) a household was. Based on the frequency of occurrence of each condition, an algorithmic method enabled households to be categorized into four HFIAS categories: food secure, mildly food insecure, moderately food insecure and severely food insecure( Reference Coates, Swindale and Bilinsky 35 ). These categories were further grouped into two classes: food secure and food insecure (mildly to severely food insecure). Moreover, three indicators of household food insecurity access (HFIA)-related domains were computed: anxiety about household food supply, insufficient food quality and insufficient food intake( Reference Coates, Swindale and Bilinsky 35 ). The HFIAS questionnaire has been validated and extensively used in various settings in Africa( Reference Leroy, Ruel and Frongillo 32 , Reference Coates, Swindale and Bilinsky 35 – Reference Knueppel, Demment and Kaiser 37 ).
Maternal and child dietary diversity
Dietary diversity refers to the number of different food groups consumed over a given reference period( Reference Krebs-Smith, Smiciklas-Wright and Guthrie 38 , Reference Lowik, Hulshof and Brussaard 39 ). It has been shown to be a good proxy indicator for nutrient adequacy of an individual’s diet( 40 ). Children’s and caregivers’ dietary diversity data were collected on a quarterly basis, using a qualitative 24 h food recall. Details on children’s dietary diversity were collected from their caregivers. To minimize recall bias, the respondent was requested to list all foods, snacks and drinks consumed during the 24 h preceding the interview. The respondent was then asked to describe the composition of the listed composite foods and drinks. The interviewer marked which food groups were consumed based on a list of eighteen food groups. In a final step, the interviewer reviewed all the answers to verify that no foods or ingredients had been omitted.
Dietary diversity scores were constructed for women of reproductive age (15–49 years) based on nine food groups (starchy staples; dark green leafy vegetables; other vitamin A-rich fruits and vegetables; other fruits and vegetables; organ meat; meat and fish; eggs; legumes, nuts and seeds; milk and milk products)( Reference Kennedy, Ballard and Dop 41 ), ranging from 1 to 9. Women dietary diversity scores (WDDS) were divided into two groups based on the median (50 % of the women ate three foods groups): low for WDDS <3 and high for WDDS ≥ 3.
There is no established list of food groups for dietary diversity scores (DDS) of children aged 24 months or older. Therefore, the food categories proposed by the WHO used to generate the infant and young child feeding indicators of dietary diversity for children aged 6–23 months were adopted( 42 ). Because some children were found to consume complementary foods below 6 months of age, DDS were computed for the whole study sample of children for intention-to-treat analysis. However, as a sensitivity analysis, we repeated the analysis limiting the sample to 6–23 months of age. The computed DDS was based on seven food groups (grains, roots and tubers; legumes and nuts; dairy products; flesh foods; eggs; vitamin A-rich fruits and vegetables; other fruits and vegetables), ranging from 1 to 7. The adequate minimum dietary diversity was defined by a DDS ≥ 4( 42 ).
Other data
A structured questionnaire on asset ownership and housing conditions was administered quarterly. Heads of households were asked to report ownership of assets related to the general household, agriculture and livestock.
Sociodemographic data, including household size, caregiver’s level of education and age, were collected on a yearly basis for descriptive purposes.
Food procurement type, including own production, purchase, gift, barter, hunting or picking, food aid or food for work, was recorded for each food group reported.
Data management and analyses
Data were double-entered in EpiData version 3.1 from the first to the fourth round of data collection. From the fifth round onwards, we used computer-assisted personal interviews with tablets using the Open Data Kit application (Core ODK, UW-CSE) to collect data. Analyses were done on an intention-to-treat basis using the statistical software package Stata version 14.2. All tests were two-sided and statistical significance was set at 0·05.
Percentages and means with sd were used to describe baseline characteristics of the two study groups. A proxy for household socio-economic status (SES) was created using principal component analysis based on declared ownership of twenty assets. The first principal component (explaining 18 % of the variation in the data set) with the highest eigenvalue (3·61) was categorized into tertiles (low, middle and high) and used as such as a proxy indicator for household SES( Reference Vyas and Kumaranayake 43 ).
The main outcome of the present study was the relative risk of food security assessed by MAHFP and HFIAS. Other outcomes, including relative risk of food insecurity conditions, relative risk of HFIA-related domains, relative risk of food group consumption by children and caregivers, mean change in children’s DDS and mean change in caregivers’ WDDS, were also assessed.
The overall intervention effect on count variables (MAHFP, mean DDS and mean WDDS) was analysed using a mixed-effects Poisson regression model with village and household as random effects to adjust for clustering. We adjusted the regression models for household-level outcomes for baseline values of the outcome, SES and household size at inclusion. The regression model for caregiver dietary diversity was adjusted for SES, household size and WDDS at inclusion, and the regression model for child dietary diversity was adjusted for child’s sex and age at inclusion. The intervention effects on mean DDS for all follow-up measurements were analysed to have more statistical power since main effects were estimated for this sample. In addition, we also analysed the intervention effect on mean DDS for children aged 6–23 months to offer comparison with other studies assessing dietary diversity for this age range. The HFIAS indicator provided a zero-inflated distribution. Therefore, we fitted a negative binomial generalized linear model with log link adjusted for clustering by village and household to consider the presence of the many zero values. Fixed effects were the same as mentioned for the previous models.
We examined the overall intervention effect on binary outcomes by calculating the relative risk of food security, HFIAS items, HFIA-related domains, adequate minimum DDS, high WDDS, and children’s and caregivers’ food group consumption. Relative risks were computed using generalized linear and latent mixed models (GLLAMM). The GLLAMM procedure in Stata allows the fitting of a Poisson regression model with villages and households as random effects. We opted to analyse binary outcomes using Poisson regression modelling to be able to report adjusted risk ratios rather than odd ratios, as recommended for prospective studies( Reference Greenland 44 , Reference Nurminen 45 ). We used the robust estimation option to relax the assumption of a Poisson distribution for binary data, as proposed by Cummings( Reference Cummings 46 ). Fixed effects were the same as for the previous models.
Finally, we studied effect modification by the baseline value of the study outcomes. For this purpose, an interaction term, cash × baseline value, was included in the models. If the interaction term reached statistical significance, subgroup analysis was conducted.
Results
A total of 1143 households (563 in the control group and 580 in the intervention group), with 1219 women of reproductive age and 1247 children, provided at least one follow-up measurement (Fig. 1). On average, 98 % of households had men as head of household. Socio-economic and demographic characteristics at inclusion were similar between the two study groups, except for children’s age and wasting prevalence (Table 1).
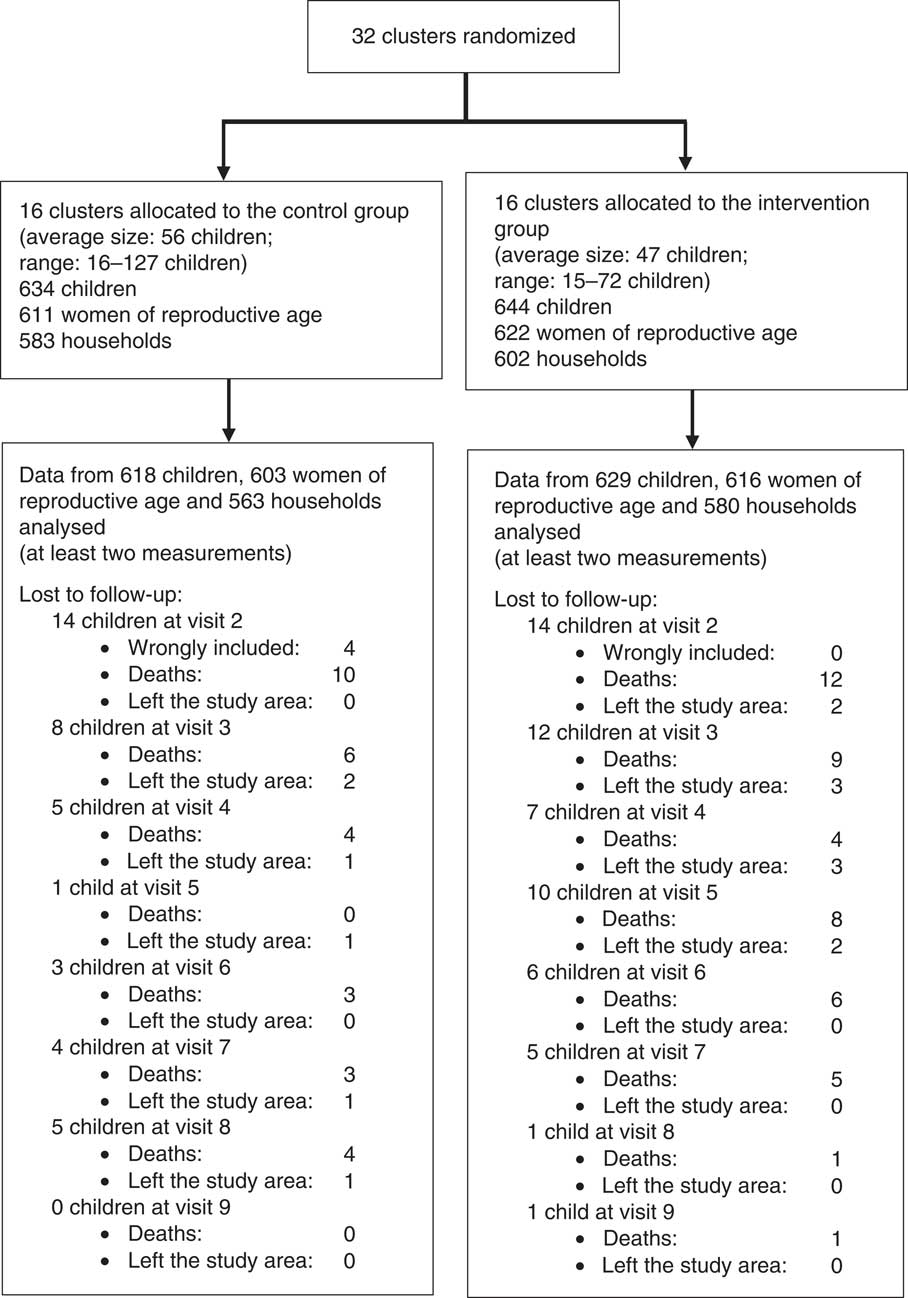
Fig. 1 Flowchart of the Moderate Acute Malnutrition Out (MAM’Out) study (adapted from Houngbe et al. ( Reference Houngbe, Tonguet-Papucci and Altare 21 ))
Table 1 Socio-economic and demographic characteristics of study groups at baseline: Moderate Acute Malnutrition Out (MAM’Out) cluster-randomized controlled trial implemented in rural Burkina Faso, June 2013–October 2015
SES, socio-economic status; WHZ, weight-for-height Z score; HAZ, height-for-age Z score
* SES data were not completed for one household in the control group.
† Age difference was induced by including the control group one month after the intervention group.
Household food security indicators were balanced between study groups at baseline. We found no statistically significant intervention effect on households’ HFIAS and MAHFP. Similarly, no statistically significant results were observed when we performed analyses on food insecurity conditions and HFIA-related domains (Table 2).
Table 2 Effect of multiannual, seasonal unconditional cash transfers on household food security indicators: Moderate Acute Malnutrition Out (MAM’Out) cluster-randomized controlled trial implemented in rural Burkina Faso, June 2013–October 2015
RR, relative risk; MAHFP, monthly adequate household food provisioning; HFIAS, household food insecurity access scale; HFIA, household food insecurity access; SES, socio-economic status; GLLAMM, generalized linear and latent mixed model.
* Households × visits.
† Analysed using a mixed-effect Poisson regression model with cluster and household as random effects, adjusted for household size at inclusion, SES at inclusion and the outcome at baseline.
‡ Analysed using a negative binomial generalized linear model with log link, with village as random effect, adjusted for household size at inclusion, SES at inclusion and HFIAS at baseline.
§ Analysed using GLLAMM procedure fitting mixed-effect Poisson regression model with village and household as random effects, adjusted for household size at inclusion, SES at inclusion and the outcome at baseline; with robust estimation of se.
The mean WDDS of intervention caregivers was 7 % higher compared with the control group (P = 0·002). Caregivers in the intervention group were also 26 % more likely to have a high WDDS compared with the control group (Table 3). We observed that the mean DDS for children in the intervention group was also 15 % higher than in the control group (P <0·001). Intervention children were also 82 % more likely (P <0·001) to have an adequate minimum DDS compared with control peers (Table 3). We observed similar results when we performed analyses in the subgroup of children aged 6–23 months: the mean DDS for the intervention group was 19 % (95 % CI 11, 28 %; P <0·001) higher and intervention children were 112 % (95 % CI 76, 154 %; P <0·001) more likely to have adequate minimum DDS compared with the control group.
Table 3 Effect of multiannual, seasonal unconditional cash transfers on caregivers’ and children’s dietary diversity: Moderate Acute Malnutrition Out (MAM’Out) cluster-randomized controlled trial implemented in rural Burkina Faso, June 2013–October 2015
RR, relative risk; WDDS, women dietary diversity score (three foods groups represent the median for the sample of caregivers); DDS, dietary diversity score; SES, socio-economic status; GLLAMM, generalized linear and latent mixed model.
* Caregivers × visits.
† Children × visits.
‡ Analysed using a mixed-effect Poisson regression model with village and household as random effects, adjusted for SES at inclusion, household size and the outcome at baseline.
§ Analysed using GLLAMM procedure fitting mixed-effect Poisson regression model with cluster and household as random effects, adjusted for SES at inclusion, household size and the outcome at baseline; with robust estimation of se.
║ Analysed using a mixed-effect Poisson regression model with village and household as random effects, adjusted for child’s sex, child’s age at inclusion, SES at inclusion and the outcome at baseline.
¶ Analysed using GLLAMM procedure fitting mixed-effect Poisson regression model with cluster and household as random effects, adjusted for child’s sex, child’s age at inclusion, SES at inclusion and the outcome at baseline; with robust estimation of se.
We observed a statistically significant effect modification of the intervention by children’s DDS at baseline (P interaction = 0·001): the mean DDS in intervention children with DDS <4 (food groups) at baseline was 17 % % (95 % CI 11, 23 %; P <0·001) higher compared with the control group. Intervention children who started with a DDS ≥ 4 (food groups) had a non-statistically significantly lower DDS during follow-up compared with control peers (−14 %; 95 % CI −25, 0·09 %; P = 0·072). No statistically significant effect modification of the study intervention was found for HFIAS, MAHFP and caregiver WDDS by their baseline value.
Food group consumption analysis showed that caregivers and children in the intervention group were more likely to consume legumes and nuts and animal-source foods including milk and milk products, eggs, meat and fish compared with the control group (P <0·001; Table 4). Contrary to children, intervention caregivers were less likely to consume other fruits and vegetables than peers from the control group (P = 0·014; Table 4).
Table 4 Effect of multiannual, seasonal unconditional cash transfers on food group consumption of caregivers and children: Moderate Acute Malnutrition Out (MAM’Out) cluster-randomized controlled trial implemented in rural Burkina Faso, June 2013–October 2015
RR, relative risk; SES, socio-economic status; GLLAMM, generalized linear and latent mixed model.
* Analysed using GLLAMM procedure fitting mixed-effect Poisson regression model with cluster and household as random effects, adjusted for SES at inclusion, household size and the outcome at baseline; with robust estimation of se.
† Analysed using GLLAMM procedure fitting mixed-effect Poisson regression model with cluster and household as random effects, adjusted for SES at inclusion, child’s sex, child’s age at inclusion and the outcome at baseline; with robust estimation of se.
Caregivers and children belonging to the intervention group were 19 % (P <0·001) and 25 % (P <0·001) more likely to consume food groups that were purchased by the household compared with control peers, respectively.
Discussion
To our knowledge, the present study is one of the first to assess effects of seasonal UCT on food security in the framework of safety nets. The analysis by intention-to-treat showed that multiannual, seasonal UCT increased the probability of having a high WDDS and an adequate minimum DDS in caregivers and children, respectively, with inadequate diet diversity at inclusion. We also found that the UCT intervention increased the consumption of legumes and nuts and animal-source foods such as milk and milk products, eggs, meat and fish in both caregivers and children who had inadequate minimum DDS at baseline. However, we were unable to find an impact of the intervention effect on household food security measured with HFIAS and MAHFP.
The positive effect of multiannual, seasonal UCT on dietary diversity and food group consumption is consistent with findings from other randomized controlled intervention studies on UCT( Reference Haushofer and Shapiro 8 , Reference Miller, Tsoka and Reichert 9 , Reference Seidenfeld, Handa and Tembo 18 , Reference Tonguet-Papucci, Houngbe and Huybregts 23 , Reference Grellety, Babakazo and Bangana 47 ). Seidenfeld et al. reported more diet diversity in recipients of the Child Grant Programme in Zambia with a clear shift from cereal towards dairy and meat food group consumption( Reference Seidenfeld, Handa and Tembo 18 ). Increased consumption of legumes and nuts and animal-source foods has been reported in households and children benefiting from the Social Cash Transfer Scheme in Malawi( Reference Miller, Tsoka and Reichert 9 ) and the Given Directly programme in Kenya( Reference Haushofer and Shapiro 8 ). In the quantitative 24 h dietary assessment sub-study carried out within the MAM’Out study, Tonguet-Papucci et al. reported a higher proportion of children in the UCT group consuming dairy products and flesh foods compared with the control group( Reference Tonguet-Papucci, Houngbe and Huybregts 23 ). They also reported that the distributed cash in the MAM’Out study was predominantly spent for food expenditures( Reference Tonguet-Papucci, Houngbe and Lompo 22 ). This was supported by the increased consumption of purchased foods, particularly animal-source foods such as eggs, meat, fish, milk and milk products, by both caregivers and children benefiting from multiannual, seasonal UCT observed in the present study. It should be mentioned that the improvement in children’s and their caregivers’ diet may contribute dietary changes that happen during nutrition transition( Reference Popkin 48 , Reference Bosu 49 ). Thow et al. reported in their systematic review that remittances may compound trends towards purchasing of less healthy foods, likely to have an association with nutrition transition( Reference Thow, Fanzo and Negin 50 ). In a transitional context, these dietary changes can quickly turn into a phenomenon of excess which, in turn, can lead to chronic diseases related to nutrition transition. The study we report on is a randomized experiment, hence the contribution of remittances (which was not measured) should be distributed equally over the study arms. Our study was also conducted in the sub-population of poor and very poor households in rural communities where nutrition transition is rather limited. In the eastern region of Burkina Faso, the Demographic and Health Survey 2010 revealed that 31·1 % of women of reproductive age were underweight and 5·2 % were overweight and obese( 27 ). The quantitative 24 h dietary food recall study conducted in a MAM’Out sub-population showed no significant difference in mean energy intakes from complementary foods between children in the intervention and the control groups. This energy originated mainly from fat in children in the intervention group, and to a lesser extent from carbohydrates, compared with children in the control group. Nevertheless, fat intake remained at the lower end of the recommended complementary food fat intake values (between 21 and 43 %)( Reference Tonguet-Papucci, Houngbe and Huybregts 23 ).
Despite consistent evidence of positive effects of cash transfers on household food security, we did not find an impact of this multiannual, seasonal UCT on households’ food security measured with HFIAS and MAHFP. Few randomized controlled trials have used HFIAS and/or MAHFP indicators, narrowing the scope for direct comparison with the existing body of literature. In Zambia, two social cash transfer grants initiated by the government showed improvement of households’ food security as measured by HFIAS after 24 months of implementation. The Child Grant Programme reduced households’ HFIAS score by 2·5 percentage points, whereas the Multiple Category Targeting Grant reduced households’ HFIAS score by 1·8 percentage points compared with control peers( 5 , 14 ). Contrary to the MAM’Out intervention, these grants provided monthly UCT to recipients’ households for 12 months of the year.
Different reasons could explain the absence of effect of multiannual, seasonal UCT on households’ food security. First, the money received by the participating mothers was not sufficient to induce a change in household food security (access). Participants mentioned during focus group discussions that the monetary value of the monthly transfers was low, given the households’ size( Reference Tonguet-Papucci, Houngbe and Lompo 22 ). Actually, households from the intervention group spent 50 % of their monthly allowance to increase the household cereal stock( Reference Tonguet-Papucci, Houngbe and Lompo 22 ). Half of the monthly cash transfer allowed for the purchase of 20 kg of millet (the main local staple food) during the cash transfer periods (Listening Post Surveillance Database – Tapoa Province – Burkina Faso, Action Contre la Faim, 2014). Using the United Nations High Commissioner for Refugees’ requirements for per capita energy intake, we estimate a daily energy need that corresponds to 420 g of millet per person as part of a daily ration( 51 ). This implies that for an average household of 8 person-equivalents, the purchased cereals could cover the energy requirements for about 6 d only. Therefore, the share of the money invested in food stock did not allow for an important impact on the household cereal stock. Further research should assess if larger amounts of cash estimated based on a household minimum expenditure basket can have a meaningful impact on household food security( 52 ). On the other hand, perhaps households did not perceive investing in food stock as a priority, or there were other aspects they deemed more important to use cash for. The ability for beneficiaries to prioritize their needs is one of the main strengths of cash transfers( 1 ).
The discrepancy between the positive effect on dietary diversity of children and their caregivers, and the absence of effect on household food security (access), could also be explained by the type of proxies used. Child DDS and WDDS are measures of the quality of food intake at individual level and are used here as proxies for the quality component of food access at individual level( Reference Leroy, Ruel and Frongillo 32 ). On the contrary, HFIAS and MAHFP capture food access at household level (not at individual level) based on recall memory. Both measures do not necessarily match, and improvement in dietary intake at individual level does not always translate into household food security (access). In addition, the individual DDS recall period is 24 h, whereas HFIAS and MAHFP recall periods are relatively long (last month and last 12 months). Thus, the latter are subject to response bias with subjective perceptions on the variety and quantity of available food and food deprivation( Reference Becquey, Martin-Prevel and Traissac 36 , Reference De Cock, D’Haese and Vink 53 ). Nevertheless, we decided to use HFIAS along with individual food security indicators because its validity has been evidenced in many studies( Reference Coates, Swindale and Bilinsky 35 – Reference Knueppel, Demment and Kaiser 37 , Reference Mohammadi, Omidvar and Houshiar-Rad 54 ). Despite the scarcity of evidence on the validity of MAHFP, we used this indicator to capture sustainable effects of interventions such as cash transfers( Reference Bilinsky and Swindale 34 ).
Several strengths can be highlighted for the present study. This assessment, implemented within the MAM’Out project research, took advantage of its strong randomized controlled trial design known to be the gold standard for causal inference. In addition, we collected periodical data over two full years which allows for more generalizable findings compared with a simple cross-sectional study design that is season- and context-dependent. We used a lot quality assurance sampling methodology to allow team supervisors to revisit the households to assess the quality of the data collected by enumerator teams. On the other hand, the study has a number of limitations. As MAM’Out participants were not blinded because of the nature of the intervention (cash transfer), it is possible that the study group allocation might have affected some of the answers provided by study participants. Caregivers from the intervention group could have altered their answers out of fear losing their cash allowance, while caregivers from the control group might have mispresented their situation in the hope to become eligible for the cash allowance. To counter such reporting bias, the procedures and modalities of the programme and study were clearly formulated at the start of the study and repeated throughout the study.
Conclusion
Multiannual, seasonal UCT increased dietary diversity in study children and their caregivers. This effect appeared stronger in children who had an inadequate dietary diversity at study inclusion. However, we did not find impact of seasonal UCT on household food security (measured with HFIAS and MAHFP). Seasonal UCT in the framework of safety nets for vulnerable households can be recommended in actions aiming to improve children’s and caregivers’ dietary diversity.
Acknowledgements
Acknowledgements: The authors thank Action Against Hunger France staff based in Burkina Faso and Paris for their support in all stages of the study, as well as the MAM’Out team that assisted for cash transfers and data collection. The authors extend their gratitude to all participants of the MAM’Out study. Financial support: The MAM’Out study was supported by Action Against Hunger France and the Centers for Disease Control and Prevention, USA (grant number 5U01GH000646-02). The cash transfer programme was funded by ECHO (grant numbers ECHO/-WF/BUD/2013/91011 and ECHO/-WF/BUD/2014/91024). The MAM’Out project also received financial contributions from ECHO (European Union) (grant number ECHO/ERC/BUD/2016/91006); the US Agency for International Development (through the Technical Operational Performance Support programme, USA) (sub-agreement number 999001170); and Research and Innovation Foundation of Action Against Hunger (France) for research uptake and the dissemination of results (agreement signed on 30 July 2015). L.H. received funding from the CGIAR Research Program on Agriculture for Nutrition and Health, led by the International Food Policy Research Institute. Funders had no role in the design, analysis or writing of this article. Conflict of interest: E.N., J.-F.H., P.K. and L.H. have no conflict of interest. F.H. was employed by Action Against Hunger France and A.T.-P., J.G. and M.A.-A. are employed by Action Against Hunger France, which implemented the MAM’Out study. Authorship: A.T.-P., L.H., M.A.-A., J.-F.H. and P.K. designed the research; F.H. conducted the research; F.H. performed statistical analysis; F.H., A.T.-P., E.N., J.G., J.-F.H., P.K. and L.H. wrote the paper; F.H. had primary responsibility for final content. All the authors read and approved the final manuscript. Ethics of human subject participation: The MAM’Out study was conducted according to the guidelines laid down in the Declaration of Helsinki and all procedures involving human subjects were approved by the ethical committee of Ghent University Hospital (Belgium) and the Burkinabe national ethics committee. Verbal informed consent was witnessed and formally recorded from administrative authorities and all heads of participating villages in Tapoa province before the study began. Written informed consent was obtained from all heads of enrolled household by signature or thumb print. The study was registered on ClinicalTrials.gov (NCT01866124).


