


Over 35 million people die annually from non-communicable diseases, with the majority of this burden coming from CVD( Reference Lozano, Naghavi and Foreman 1 , Reference Vos, Barber and Bell 2 ). Four major risk factors generate non-communicable diseases: poor diet, alcohol, tobacco and physical inactivity, with poor diet generating more non-communicable diseases than the other three risk factors combined( Reference Lim, Vos and Flaxman 3 ). Consumption of ultra-processed food (UPF) products negatively impacts the nutritional quality of diets as these UPF are nutritionally imbalanced compared with non-UPF( Reference Poti, Mendez and Ng 4 – Reference Crovetto, Uauy and Martins 9 ). UPF are energy-dense and typically high in saturated fat, trans-fat, sodium and added sugar( Reference Poti, Mendez and Ng 4 , Reference Moubarac, Martins and Claro 10 ).
Monteiro et al.( Reference Monteiro, Moubarac and Cannon 11 ) compared the consumption of UPF in high- and middle-income countries, specifically Canada and Brazil, and found that the total amount of energy purchased as UPF was almost twice high in Canada (from a survey in 2001) compared with Brazil (from a survey in 2003). Similar patterns were observed when comparing Brazil with the UK and USA: ready-to-consume products, which include both processed foods and UPF, accounted for 63 % of energy purchased in the UK in 2008, compared with 28 % in Brazil between 2008 and 2009( Reference Moubarac, Claro and Baraldi 12 ). In the USA, UPF accounted for approximately 58 % of the total energy purchased for 2009–2010( Reference Steele, Baraldi and Louzada 5 ). Despite Brazil consuming less energy from UPF compared with high-income countries, the consumption of UPF in this country is increasing at a more rapid rate: Monteiro et al.( Reference Monteiro, Moubarac and Cannon 11 ) reported that the annual growth of UPF in Brazil (2·1 % per year) is almost twice the annual growth in Canada (1·3 % per year).
The current trend of increased consumption of UPF in Brazil is most likely related to the penetration of transnational food companies and the subsequent displacement of the traditional food system( Reference Monteiro and Cannon 13 ).
Overall, the energy share of UPF in Brazil is increasing in all economic strata; however, the largest increase is observed in those groups with lower incomes( Reference Martins, Levy and Claro 14 ). This is noteworthy, as some studies in Brazil show that the burden of obesity, for example, is higher among individuals in lower income groups( Reference Monteiro, Conde and Popkin 15 , Reference Monteiro, D’A Benicio and Conde 16 ) and that there is a relationship between obesity and household availability of processed foods and UPF( Reference Canella, Levy and Martins 17 ).
Furthermore, high consumption of added sugar( Reference Yang, Zhang and Gregg 18 – Reference Fung, Malik and Rexrode 21 ), sodium( Reference Nagata, Takatsuka and Shimizu 22 , Reference Strazzullo, D’Elia and Kandala 23 ), saturated fat( Reference Mozaffarian, Micha and Wallace 24 ) and trans-fat( Reference Oh, Hu and Manson 25 ) has been associated in the past with the development of CVD( Reference Monteiro and Cannon 13 , Reference Welsh, Sharma and Argeseanu 19 , Reference Nagata, Takatsuka and Shimizu 22 ). These associations suggest that a diet high in UPF and therefore high in these nutrients is linked to CVD.
However, in Brazil, there is currently a lack of literature quantifying the links between consumption of UPF and the development of CVD. Modelling studies have shown it is possible to reduce or prevent CVD through changes in these risk factors( Reference Mozaffarian, Micha and Wallace 24 , Reference Collins, Mason and O’Flaherty 26 – Reference Bibbins-Domingo, Chertow and Coxson 29 ). The present paper therefore estimates the impact of reducing saturated fat, trans-fat, salt and added sugar from processed culinary ingredients and UPF in the Brazilian diet on preventing cardiovascular deaths by 2030.
Methods
Estimating the nutrient content of the Brazilian diet from household survey data
Data used in the model were obtained from the 2008/2009 Brazilian Household Budget Survey (HBS)( 30 ) conducted by the Brazilian Institute of Geography and Statistics. The total number of households was approximately 56 000 and the foods purchased by the household were recorded by the interviewer during seven consecutive days. Foods purchased for consumption away from home were not registered in detail (only the description of the type and value of the expense are available) and they were not included in the present study( 30 ).
All foods purchased were classified into groups according to the nature, extent and purpose of food processing. Essentially, foods were divided into four main groups according to the NOVA food classification( Reference Monteiro, Cannon and Levy 31 ): Group 1 (G1), unprocessed or minimally processed foods (fresh vegetables and fruits; grains; roots; tubers and others); Group 2 (G2), processed culinary ingredients (oils, fats, salt and sugar); Group 3 (G3), processed foods (canned or bottled vegetables and legumes (pulses) preserved in brine; un-reconstituted processed meat and fish such as ham, bacon, smoked fish; cheese; and others); and Group 4 (G4), ultra-processed food and drink products (chips, many types of sweets, fatty or salty snack products; ice cream, chocolates, candies (confectionery); burgers and hot dogs; poultry and fish ‘nuggets’ or ‘sticks’ (‘fingers’); breads, buns, cookies (biscuits); breakfast cereals; and others). More detailed information on methodological classification can be found elsewhere( Reference Canella, Levy and Martins 17 , Reference Monteiro, Cannon and Levy 31 , Reference Moreira, Baraldi and Moubarac 32 ).
To quantify the amounts of energy, saturated fat, salt and added sugar of each food item purchased, we used the Brazilian Food Composition Table (TACO)( 33 ); or, if necessary, when the food item was not found in TACO, the US National Nutrient Database for Standard Reference was used( 34 ). Information on trans-fats was not available in the HBS. Therefore, to estimate trans-fat intake, we used data provided from another survey by the Brazilian Institute of Geography and Statistics looking at food consumption in a sub-sample of the HBS (~25 % of the HBS households)( 35 , Reference Pereira, Duffey and Sichieri 36 ).
It was assumed for the purposes of this model that foods in G1, G2 and G3 contain zero trans-fats. Only foods in G4 were ascribed trans-fat values according to the Brazilian Institute of Geography and Statistics( 35 ).
The HBS does not have age-specific data; therefore we used the same age distribution as in the UK( Reference Moreira, Baraldi and Moubarac 32 ). Using the energy and nutrient intakes of 10-year age groups reported in the UK, we calculated the ratios between the quantities consumed in each age group and a base age group defined as 45–54 years. For example, in the UK, the group aged ≥75 years consumes almost 1·4 times more added sugar than the group aged 45–54 years. We applied these ratios to the Brazilian data, assuming that the amounts of energy and nutrients from food purchases reported by HBS were consumed by the base age group of 45–54 years.
Modelling the effect of changing saturated fat, trans-fat, added sugar and salt consumption patterns
We used the IMPACT Food Policy methodology( Reference de Koning, Malik and Kellogg 20 , Reference Moreira, Baraldi and Moubarac 32 , Reference O’Keeffe, Kabir and O’Flaherty 37 ) to estimate potential CVD mortality reduction if saturated fat, trans-fat, salt and added sugar from processed culinary ingredients and UPF were reduced in the Brazilian diet.
Our primary outcome measure was the total number of deaths prevented or postponed (DPP) that can be attributed to the reduction of saturated fat, trans-fat, salt and added sugar in processed culinary ingredients and UPF. DPP are defined as the difference between the number of expected deaths in 2030 (age- and sex-specific CVD mortality rates in 2010 remained unchanged) and the expected deaths if saturated fat, trans-fat, salt and added sugar in processed culinary ingredients and UPF are reduced in the Brazilian diet.
The starting point for the model was to calculate the expected number of CHD and stroke deaths in 2030 by multiplying the age- and sex-specific mortality rates from CHD and stroke in 2010 by the population projections for 2030 in that age–sex stratum. Summing over all strata then yielded the expected number of deaths in 2030 had mortality rates remained unchanged. Population counts, CHD and stroke mortality rates, and observed numbers of deaths used in the model, along with sources, are listed in the online supplementary material.
To calculate DPP from changes in saturated fat, trans-fat, salt and added sugar, we used a regression approach, where the number of expected number of CHD deaths in 2030 were multiplied by one minus the absolute change in the nutrient level (absolute difference in the nutrient levels between 2010 and 2030) multiplied by a regression coefficient (β) quantifying the estimated relative change in CHD mortality that would result from a one-unit change in nutrient level. Stroke DPP were calculated likewise.
Nutrient mean levels and β coefficients (meta-analyses of large cohort studies), along with their sources, are presented in the online supplementary material.
Changes in CVD mortality could be the result of simultaneous change in nutrient levels. Hence, part of the effect of one nutrient may be mediated through another. In this regard, we simultaneously estimated the effects of multiple nutrient changes on CVD mortality (more details in the online supplementary material).
We designed three scenarios to model the effect of decreasing saturated fat, trans-fat, salt and added sugar consumption:
-
1. In Scenario A (modest), we assumed that the intakes of saturated fat, trans-fat, salt and added sugar from G4 (UPF) would be reduced by 25 %, substituting this reduction in consumption with a 25 % increase in the consumption of G1 (unprocessed or minimally processed foods). Additionally, we modelled a reduction of 25 % in G2 (processed culinary ingredients) consumption.
-
2. In Scenario B (ideal), we assumed a reduction of 50 % in saturated fats, trans-fat, salt and added sugar in G4 (UPF), substituting this reduction in consumption with a 50 % increase in the consumption of G1 (unprocessed or minimally processed foods). Additionally, we modelled a reduction of 50 % in G2 (processed culinary ingredients) consumption.
-
3. In Scenario C (optimistic), we reduced the intakes of saturated fat, trans-fat, salt and added sugar in G4 (UPF) by 75 %, substituting this reduction in consumption with a 75 % increase in the consumption of G1 (unprocessed or minimally processed foods). Additionally, we modelled a reduction of 50 % in G2 (processed culinary ingredients) consumption.
Sensitivity analysis
Finally, we implemented sensitivity analysis using the Excel add-in Ersatz software, which allows Monte Carlo simulation. This allows us to calculate 95 % uncertainty intervals (95 % UI) for all model outputs, based on 5000 draws from specified probabilistic distributions for the model input variables. The parameter distributions used for the input variables to the DPP calculations are shown in the online supplementary material.
Results
Nutrient levels in different food groups
According to data from the HBS 2008/2009, the daily intake of energy among the population (estimated from purchased foods) is approximately 6700 kJ (1600 kcal). Added sugar and saturated fats account for 16 and 8 % of this total, respectively (Table 1). Figure 1 shows the distribution of saturated fat, trans-fat and added sugar for each of the food groups.

Fig. 1 Distribution (%) of the availability of energy from saturated fat (![]() ), added sugar (
), added sugar (![]() ) and trans-fat (
) and trans-fat (![]() ) in Brazilian households by NOVA classification group, estimated from foods purchased in the 2008/2009 Brazilian Household Budget Survey
) in Brazilian households by NOVA classification group, estimated from foods purchased in the 2008/2009 Brazilian Household Budget Survey
Table 1 Average daily dietary energy, added sugar and saturated fat intakes of Brazilian households, estimated from foods purchased in the 2008/2009 Brazilian Household Budget Survey
* To convert to kJ, multiply kcal value by 4·184.
The estimated daily intake of salt, based on quantity of sodium in food purchases, was 10 g/d, with most of the salt coming from G2 (6·74 g/d) and G4 (2·17 g/d), while substantially less came from G1 and G3 (0·43 and 0·55 g/d, respectively).
Expected mortality reduction
Baseline
In 2010, approximately 199 000 CVD deaths were reported in Brazil. If 2010 age-specific rates persist unchanged, approximately 390 400 CVD deaths might be expected in 2030.
Scenarios
The results of DPP from CVD, CHD and stroke in Scenarios A, B and C are shown in Fig. 2.
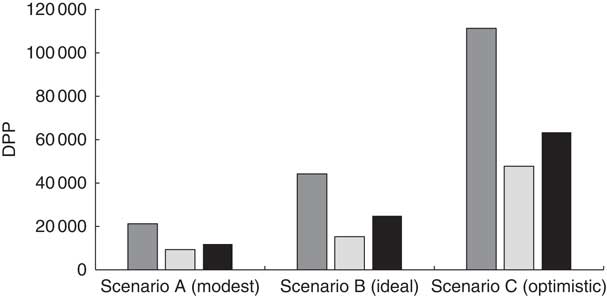
Fig. 2 Deaths prevented and postponed (DPP) by 2030 from CVD (![]() ), CHD (
), CHD (![]() ) and stroke (
) and stroke (![]() ) in the Brazilian population under Scenarios A, B and C that reduce intakes of saturated fat, trans-fat, salt and added sugar from ultra-processed foods and processed culinary ingredients
) in the Brazilian population under Scenarios A, B and C that reduce intakes of saturated fat, trans-fat, salt and added sugar from ultra-processed foods and processed culinary ingredients
In the modest scenario (Scenario A), where the intakes of saturated fat, trans-fat, salt and added sugar in G4 are reduced by 25 %, that energy is substituted for G1 energy and also where the same nutrients in G2 are reduced by the same proportion, it could lead to approximately 21 100 (95 % CI 17 600, 25 300) fewer CVD-related deaths in 2030. This represents a 5·5 % reduction in CVD mortality and denotes approximately 9430 (95 % CI 7400, 11 500) fewer CHD deaths and some 11 670 (95 % CI 9300, 14 900) fewer stroke deaths.
In the ideal and feasible scenario (Scenario B), where the current intakes of saturated fat, trans-fat, salt and added sugar are halved in G4, that energy is substituted for G1 and where also the same nutrients are halved in G2, it could lead to approximately 44 190 (95 % CI 37 570, 51 240) fewer CVD-related deaths in 2030. This would represent an 11 % reduction in CVD mortality and denotes approximately 19 340 (95 % CI 15 310, 23 410) fewer CHD deaths and some 24 850 (95 % CI 19 790, 30 250) fewer stroke deaths.
In the optimistic scenario (Scenario C), where the current intakes of saturated fat, trans-fat, salt and added sugar are reduced by 75 % in G4, that energy is substituted for G1 and where the same nutrients are halved in G2, it could lead to approximately 111 140 (95 % CI 68 400, 160 300) fewer CVD-related deaths in 2030. This would represent a 29 % reduction in CVD mortality and denotes approximately 47 740 (95 % CI 30 400, 60 300) fewer CHD deaths and some 63 400 (95 % CI 31 040, 99 440) fewer stroke deaths.
The results for all scenarios by sex with cumulative effects are shown in Table 2.
Table 2 Estimated CVD, CHD and stroke deaths prevented or postponed (DPP) by 2030 by the achievement of modest, ideal and optimistic scenarios (reducing intakes of saturated fat, trans-fat, salt and added sugar from ultra-processed foods and processed culinary ingredients) in specific food policy options, by sex, in Brazil
Discussion
We quantified the number of deaths from CHD and stroke that might be prevented or postponed by reducing the consumption of saturated fat, trans-fat, salt and added sugar in processed culinary ingredients and UPF in Brazil.
The findings suggest that by 2030, approximately 44 190 fewer CVD deaths (11 % mortality reduction) could be achieved under an ideal scenario where the intake of UPF is reduced by 50 % and substituted by a proportional increase of unprocessed or minimally processed foods, plus an additional 50 % reduction of the processed culinary ingredients.
Intake reductions of 25 and 75 % in UPF (the energy from which is proportionally replaced by unprocessed or minimally processed foods) and processed culinary ingredients could prevent or postpone approximately 21 100 (5·5 % mortality reduction) and 111 140 (29 % mortality reduction) CVD deaths, respectively.
The scenarios were constructed starting from a 25 % reduction (modest scenario) of saturated fat, trans-fat, salt and added sugar in measures that are easier to achieve by the population. As we increase to 50 and 75 % of substitution, we know they are targets that are harder to reach, but they are not impossible. This would gradually replace the energy from UPF to minimally processed foods.
The optimistic scenario (G4 and G2 reduced by 75 and 50 %, respectively) was proposed to specifically examine the potential effects on CVD mortality if Brazil would meet the international and national targets set for salt (5 g/d) and sugar (10 % of daily energy intake). The other two scenarios were proposed as intermediate stops in the journey to meet the targets.
Our model predicts bigger mortality reductions for stroke than for CHD if we reduce the consumption of UPF and processed culinary ingredients. These types of foods are very high in salt content (see Table 2); salt mediates the risk of CVD through its effect on blood pressure. A meta-analysis of one million adults in sixty-one prospective studies reported that high blood pressure has a higher effect on stroke mortality than in CHD mortality for adults younger than 70 years( Reference Lewington, Clarke and Qizilbash 38 ). Therefore, a reduction of foods from G4 and especially G2 will have higher mortality reduction in stroke than in CVD for a young population such as the Brazilians.
Comparison with other modelling studies
Our results are in accordance with a recent model developed in the UK( Reference Moreira, Baraldi and Moubarac 28 , Reference Moreira, Baraldi and Moubarac 32 ), where a 13 % CVD mortality reduction by 2030 was reported after reducing the consumption of processed and ultra-processed foods. Although the scenarios modelled in that study are not directly comparable, a possible explanation for the higher mortality reductions reported in our study could be the higher content of salt and added sugar of the Brazilian traditional diet compared with the UK. Salt intake in Brazil is about 12 g/d while this is approximately 8 g/d in the UK( Reference Brinsden, He and Jenner 39 , 40 ). In addition, Brazil has been historically the major global producer of sugar.
Although no other studies seem to quantify the effect of UPF consumption on CVD mortality, there are some studies looking directly at the effect of saturated fat, trans-fat and salt on CHD mortality only( Reference Mozaffarian, Micha and Wallace 24 – Reference Collins, Mason and O’Flaherty 26 , 40 ).
A modelling study in nine European countries evaluated decreases in salt and saturated fat consumption( Reference Andersen, Aspelund and Bandosz 41 ). It reported CHD mortality gains of between 5 and 16 % by 2020. The study additionally modelled decreases in added sugar and trans-fats and reported CHD mortality gains of between 5 and 25 % by 2030( Reference Andersen, Aspelund and Bandosz 41 ).
A study looking at 50 and 100 % reduction of trans-fats in England and Wales reported a mortality reduction of 1·3 and 2·5 %, respectively, by 2020( Reference Pearson-Stuttard, Hooton and Critchley 42 ).
Strengths and limitations
To our knowledge, the present study is the first model to estimate the impact of reducing ultra-processed foods and processed culinary ingredients from the Brazilian diet on CVD mortality.
The NOVA food classification used in the study has been widely applied to other countries( Reference Moreira, Baraldi and Moubarac 32 ) and is now recognised as a valid tool in reports from the FAO( 43 ) and the Pan American Health Organization( 44 ). The effect sizes quantifying the relative change in CVD mortality that would result from a one-unit change in nutrient level were obtained from comprehensive systematic reviews and meta-analyses. We also considered that changes in nutrient values might not be independent and additive, and we therefore explored potential cumulative effects. We incorporate the uncertainty associated to the measurement of nutrient values by conducting a full sensitivity analysis.
On the other hand, the study also has some limitations. The Brazilian HBS was used to quantify saturated fat, trans-fat, salt and added sugar. The HBS has data on foods purchased rather than foods consumed and it does not take in account foods purchased outside the home. However, such data are well accepted for estimating consumption in populations, with many studies using it for this purpose in Brazil( Reference Crovetto, Uauy and Martins 9 , Reference Canella, Levy and Martins 17 , Reference Monteiro, Levy and Claro 45 ), and the HSB has shown reasonable agreement between purchased and home consumption of UPF( Reference Louzada 46 ). Furthermore, for trans-fat, a representative sub-sample of 34 003 individuals was used( 35 ). This sub-sample contains only 25 % of the households in the HBS and does not include detailed information on processed culinary ingredients (G2) which were used in this modelling exercise to estimate intakes of sugar and salt. Because of these limitations, it was decided to use the purchased food data reported by the HSB.
Claro et al.( Reference Claro, Baraldi and Martins 47 ) report that approximately 28 % of total expenditure on food happens away from home. Moreover, the consumption of ready-to-consume products tends to be higher outside home( Reference Bezerra, Souza and Pereira 48 ); therefore, our estimates of consumption of UPF might underestimate the consumption of UPF in Brazil.
We assumed no ‘lag time’ between dietary risk factor change and mortality reduction. Indeed, lag times for CVD are surprisingly short and considerable declines in mortality can occur rapidly after individual or population-wide changes in diet( Reference Capewell and O’Flaherty 49 ). The model does not track future risk factor trends, and this might result in over- or underestimation of the potential reduction. However, given the size of the reductions, the model seems to offer conservative estimates of potential future gains.
We could not estimate the age-specific nutrient content from the HSB, as these data were not available in the survey. Therefore, we used the age pattern of nutrient consumption observed in the UK, applied to the Brazilian population. This may lead to biased estimates of nutrient content in the Brazil diet since the UK consumes more than double the amount of UPF.
We also assumed that CVD mortality will keep constant until 2030, which is a common assumption in modelling studies( Reference Guzman Castillo, Gillespie and Allen 50 ). However, important reductions in the mortality trends have been observed and projected for industrialized countries( Reference Guzman Castillo, Gillespie and Allen 50 – Reference Pearson-Stuttard, Guzman-Castillo and Penalvo 52 ). Therefore, it would not be unreasonable to assume that also Brazil might have some reduction in mortality trends into the future.
Finally, we did not take into account that an intake reduction of UPF might also drive a higher consumption of other less processed foods such as cheese and breads (classified in G3), since they might be perceived as healthier options in comparison to their ultra-processed counterparts. However, these foods are still high in salt, added sugar and saturated fat, and an increased intake of those could reduce or cancel the health benefits of a reduction of UPF.
Public health implications
Unhealthy aspects of traditional foods in Brazil, including their high levels of salt and sugar, and the increasing number of processed and ultra-processed foods penetrating the Brazilian diet demand public actions to mitigate their negative effects.
In our study, the contribution of added sugar in percentage of total energy was approximately 16 %. Approximately 50 % of this energy percentage comes from G2 (oils, fats, salt and sugar) and about 18 % comes from G4 (UPF). Brazil has a high intake of sugar, exceeding the standards recommended for international use( 53 ). Fortunately, the consumption of refined sugars and other caloric sweeteners, which correspond to 75 % of the energy consumed from added sugars, has been decreasing in the last decades( Reference Levy, Claro and Bandoni 54 ). However, the consumption remains high. Moreover, the proportion of added sugars from processed and ultra-processed foods (the remaining 25 % of energy from added sugars) has increased significantly, doubling between 1988 and 2003( Reference Levy, Claro and Bandoni 54 ).
This high consumption may lead to increase in total energy intake related to overweight and obesity and increase of non-communicable diseases( Reference de Koning, Malik and Kellogg 20 , Reference Fung, Malik and Rexrode 21 ). According to the WHO, the recommendation is to reduce the intake of added sugar to less than 10 % of total energy intake( 55 ).
Recent modelling studies show that a tax on sugar-sweetened beverages affects consumption in the whole population and may lead to a reduction in overweight and obesity( Reference Andersen, Aspelund and Bandosz 41 ). According to the Instituto Nacional de Salud Pública in Mexico, a 10 % tax on some sugar-sweetened beverages showed approximately a 10 % decline in purchases of those beverages. Results also showed a 7 % increase in purchase of untaxed beverages and roughly a 13 % increase in plain water purchases (preliminary results)( 56 ).
Another important issue is the amount of salt in the Brazilian diet. In our results, the mean of salt purchased is about 10 g/d. The weighted average of salt in G2 was 7·75 g/d and in G4 was 2·26 g/d. In previous studies in Brazil, the quantity of salt was about 12 g/capita per d, more than the recommended daily intake level( 40 , Reference Sarno, Claro and Levy 57 , Reference Sarno, Claro and Levy 58 ). There was a slight decrease from 76·2 to 74·4 % in the contribution of salt and salt-based condiments, however an increase of processed foods with added salt (15·8 to 18·9 %) by households, in the two last surveys( Reference Sarno, Claro and Levy 57 , Reference Sarno, Claro and Levy 58 ).
A US modelling study suggested that reducing dietary salt by 3 g/d could lead to a reduction in cases of CHD, stroke and myocardial infarction( Reference Bibbins-Domingo, Chertow and Coxson 29 ). Other studies have shown that interventions to reduce dietary salt intake are linked with decreases in health-care expenditure and reductions in the burden of CVD( Reference Collins, Mason and O’Flaherty 26 , Reference Smith-Spangler, Juusola and Enns 59 ).
Some models have evaluated policies to reduce salt consumption through health promotion campaigns, labelling of food packaging and mandatory reformulation of salt content in processed food; Mason et al.( Reference Mason, Shoaibi and Ghandour 60 ) evaluated the above policies in four Mediterranean countries and found them to be cost saving due to the reduction in CHD numbers. In England, the largest estimated savings came from mandatory reformulation, implementing legislation to reduce salt in processed foods(26). In Brazil, the Brazilian Strategic Action Plan to Combat Chronic Non-communicable Diseases (2011–2022) aims to reduce salt consumption from 12 g/d (in 2010) to 5 g/d (in 2022). Actions to achieve the goal are educational measures to reduce salt and salty condiments added at home; agreements with the food industry to reduce the salt in its products; and restrictions on the marketing of UPF( Reference Malta and Silva 61 ).
In Argentina, two cost-effective population-based interventions are decreasing salt levels in bread and mass education campaigns( Reference Rubinstein, García Martí and Souto 62 ). Cappuccio et al.( Reference Cappuccio, Capewell and Lincoln 63 ) stressed that in low- and middle-income countries, with very limited budgets, policies could be related to communication, reformulation, monitoring and regulation.
In a recent systematic review of salt reduction around the world, Trieu et al.( Reference Trieu, Neal and Hawkes 64 ) found that national salt reduction strategies are implemented in countries at all income levels (income level by the World Bank) and the strategies adopted are food reformulation, consumer education, front-of-package labelling and interventions in public settings such as schools, workplaces, public hospitals and other public institutions.
Furthermore, the increase of UPF in the Brazilian diet will inevitably bring an increase in saturated fats and trans-fats. Reduction of saturated fats has been a traditional strategy for prevention of CHD( Reference Mozaffarian, Micha and Wallace 24 ) and certainly the proposed scenarios in the present study could contribute to such reduction. However, most of the saturated fats in the Brazilian diet come from foods in G3 (i.e. processed foods, see Fig. 1), meaning that this group cannot be ignored and needs considerable policy focus. Mozaffarian et al. showed in a meta-analysis that increasing the consumption of PUFA as a replacement for saturated fat could reduce CHD events by 19 %( Reference Mozaffarian, Micha and Wallace 24 ).
Trans-fat has a substantial effect on CHD risk as it increases harmful LDL cholesterol( Reference Mozaffarian, Katan and Ascheria 65 – Reference Willett 67 ). In 2003, the WHO set the target of reducing trans-fats consumption to 0·8 % of daily energy intake after the overwhelming evidence of its harms( 40 ). In Brazil, the consumption of trans-fats is just above that target (an average consumption of 1·1 %, see online supplementary material). Our study suggests that by reducing the consumption of UPF by more than 25 % will help Brazil to keep its levels of trans-fats consumption below the WHO target.
Conclusion
The current study shows there is potential for substantially reducing the CVD burden through overall improvements of the Brazilian diet. Reducing consumption of saturated fat, trans-fat, salt and added sugar in processed and ultra-processed foods could result in a 6–29 % decrease in deaths from CVD. This requires reducing the penetration of ultra-processed products by means of regulatory policies, as well as improving access to and promotion of fresh and minimally processed foods that are still part of Brazil’s traditional diet.
Acknowledgements
Financial support: This work was supported by the National Council of Technological and Scientific Development (Conselho Nacional de Desenvolvimento Científico e Tecnológico (CNPq); grant number 245501/2012-6). CNPq had no role in the design, analysis or writing of this article. Conflict of interest: None. Authorship: The authors contributed as follows. Formulating the research question: P.V.L.M., S.C., M.O.F. and M.G.C. Designing the study: P.L.V.M., S.C., M.O.F. and M.G.-C. Analysing the data: P.V.L.M., M.O.F., M.G.-C., A.P.B.M., L.G.B. and J.-C.M. Writing the article: P.V.L.M., L.H., A.P.B.M., L.G.B., J.-C.M., M.G.-C., H.B., S.C. and M.O.F. Ethics of human subject participation: Not applicable.
Supplementary material
To view supplementary material for this article, please visit https://doi.org/10.1017/S1368980017002063


