


Diet and health vary between social classes all the way from childhood to adulthood(Reference Gissler, Rahkonen and Järvelin1, Reference Hupkens, Knibbe and Drop2). Several chronic disease risk factors such as short duration of breast-feeding, unhealthy diet, inactivity and obesity are clustered in the lower socio-economic groups(Reference James, Nelson and Ralph3). In industrialized countries, children of older, well-educated and non-smoking mothers come closest to following the recommended food habits(Reference Cooke, Wardle and Gibson4–Reference Fisk, Crozier and Inskip7).
In addition to creating the physical and social environment for their children's early experiences with food and eating, parents also influence children's eating directly through their own eating behaviours, taste preferences and food choices(Reference Kral and Rauh8, Reference Patrick and Nicklas9). Children's food preferences and food consumption are strongly influenced by the social, demographic and lifestyle factors of the whole family and as a result, so is their nutrient intake. Earlier studies have assessed the associations between different sociodemographic characteristics of the family and food consumption among infants and pre-schoolers(Reference Laitinen, Räsänen and Viikari10) focusing in particular on the consumption of fast foods(Reference Bowman, Gortmaker and Ebbeling11), soft drinks(Reference Harnack, Stang and Story12) as well as fruits and vegetables(Reference Cooke, Wardle and Gibson4, Reference Cockroft, Durkin and Masding13). The associations of sociodemographic characteristics of the family with the child's nutrient intake(Reference Erkkola, Kronberg-Kippilä and Kyttälä5, Reference Rogers and Emmett14) and use of dietary supplements(Reference Briefel, Hanson and Fox15, Reference Räsänen, Kronberg-Kippilä and Ahonen16) have been studied as well.
Daily diet is composed of numerous food items, which together determine the person's nutrient intake. However, when it comes to evaluating the overall quality of a diet, a more holistic approach works better than the traditional nutrient- or food-based approach. Dietary indices, clusters and patterns have been developed to characterise the overall diet quality in children(Reference Northstone and Emmett6, Reference Fisk, Crozier and Inskip7, Reference Ovaskainen, Nevalainen and Uusitalo17–Reference Lazarou and Newby19) and have been used in several previous studies. For instance, maternal characteristics such as higher age, education and income, as well as non-obesity and non-smoking, have been associated with a better diet quality in the offspring(Reference Northstone and Emmett6, Reference Fisk, Crozier and Inskip7, Reference Ovaskainen, Nevalainen and Uusitalo17–Reference Lazarou and Newby19). Further, it has been shown that younger children and girls tend to have a healthier diet(Reference Lazarou and Newby19).
The idea of dietary indices is to grade the consumption of specifically chosen foods or nutrient intakes with scores. The final index score is the sum of these food groups or nutrient-specific scores. Three approaches have been used to measure the dietary quality of children using indices: (i) to use an index created for adults(Reference Manios, Kourlaba and Kondaki20, Reference O'Neil, Fulgoni and Nicklas21); (ii) to modify an index created for adults and tailor it to specific child populations(Reference Garriguet22, Reference Feskanich, Rockett and Colditz23); or (iii) to develop a new index specifically for children(Reference Cox, Skinner and Carruth24, Reference Kranz, Findeis and Shrestha25). The construction of such an index should take into account the national dietary guidelines and the local food culture in question.
The first aim of the present study was to develop a Finnish Children Healthy Eating Index (FCHEI) based on the main indicators for Finnish children's diet: increasing consumption of vegetables, fruits, fish and vegetable-based fats, and decreasing sugar consumption. The second aim was to determine the relative validity of the index against nutrient intakes. The final aim was to examine associations between the index and sociodemographic and lifestyle characteristics of the family.
Materials and methods
Participants
The Type I Diabetes Prediction and Prevention (DIPP) Nutrition Study(Reference Kupila, Muona and Simell26) is part of the larger, population-based DIPP birth cohort(Reference Virtanen, Kenward and Erkkola27) and is implemented in the Oulu University Hospital in northern Finland and the Tampere University Hospital in southern Finland. This study was conducted according to the guidelines laid down in the Declaration of Helsinki and all procedures involving human subjects were approved by the local ethics committees of the participating university hospitals in Turku, Oulu and Tampere. Written informed consent was obtained from all the families.
Questionnaires on several background factors and structured dietary questionnaires with 3 d food records were collected at the ages of 3, 6 and 12 months, and annually thereafter. The present study series comprised 1-year-old (n 455), 3-year-old (n 471) and 6-year-old (n 713) children born in 2003, 2001 and 1998–1999, respectively. All food records were completed in 2003–2005. Breast-fed children (n 112) were excluded from 1-year-olds because it was impossible to estimate their energy intake from breast milk.
Characteristics of the study population (Table 1) were obtained from a questionnaire completed 3 months after delivery. Maternal weight, used in calculating BMI, was measured at the first visit to the maternal welfare clinic. If the mother had her first clinic visit after the 10th week of pregnancy, her weight for the 10th week was estimated based on the difference between her weight at the first and last maternal clinic visit assuming linear weight gain during the second and third trimesters of pregnancy(Reference Fattah, Farah and Barry28, Reference Rasmussen and Yaktine29). Information on paternal weight and height was not collected from fathers of the 6-year-olds. Information regarding child-care facility used was obtained from the food records.
Table 1 Characteristics of the study population by age group; Finnish children, Type I Diabetes Prediction and Prevention (DIPP) Nutrition Study, 2003–2005
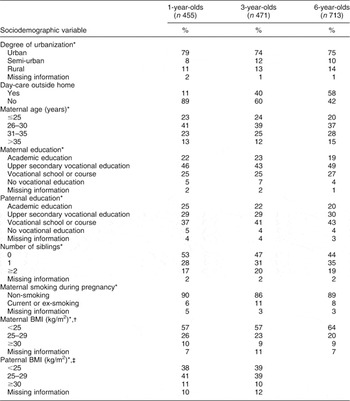
*Asked at the time of birth of the child.
†Maternal weight, used in calculating BMI, was measured at the first visit to the maternal welfare clinic. If mother had her first clinic visit after the 10th week of pregnancy, weight at week 10 was estimated based on the difference between weight at the first and last maternal welfare clinic visit and assuming linear weight gain during the second and third trimesters of pregnancy(28,29).
‡Weight and height information was not collected from the fathers of 6-year-old children.
Dietary methods
Food records were completed for three consecutive days (two weekdays and one weekend day) close to the child's birthday(Reference Virtanen, Nevalainen and Kronberg-Kippilä30). Food records comprised two parts: one was completed at home by the parents and, where relevant, the other at the day-care facility by the day-care personnel. The parents and the day-care personnel were instructed to record all foods and drinks the children consumed during the recording days including the amount, brand, recipe and preparation method used. Portion size was estimated either with household measures (e.g. spoons, cups, glasses, decilitres) or using a picture booklet of food portions(Reference Paturi, Nieminen and Reinivuo31). Vitamin and mineral supplements were recorded by their brand names and the amounts used were entered as tablets, drops, spoonfuls or millilitres. During the family's visits to their local study centre, trained nurses checked the food records. When necessary, missing information was requested for and added. The study nurses and physicians received continuous education on how to complete and check food records.
The food records were entered into the Fineli Dietary Database using the Finessi software program that retrieves information from the national food composition database(Reference Reinivuo, Hirvonen and Ovaskainen32). The Finessi software program and the databases were developed, and are being continuously updated, by the Finnish National Institute for Health and Welfare(33). The national food composition database contains standard recipes that are based on those available in contemporary Finnish cookery books. The DIPP Nutrition Study has recently added commercial baby foods and infant formulas to the existing food selection of the national food composition database. In the case of the parents or caregivers including recipe information in the food records, a personalized recipe was entered into the Finessi software program by nutritionists. Reported food consumption was converted into average daily food consumption.
Finnish Children Healthy Eating Index (FCHEI)
The food groups (Table 2) of the FCHEI were chosen based on the known dietary concerns among Finnish children: the low consumption of vegetables, fruits, fish and vegetable oil-based fats, and the high consumption of foods containing sugar and of poor-quality drinks(Reference Kyttälä, Erkkola and Kronberg-Kippilä34). The food group ‘vegetables, fruits and berries’ contained both fresh and cooked (including commercial baby foods) vegetables, fruits and berries, but not vegetable or fruit juices. The ‘oils and margarine (fat ≥55 %)’ food group contained oils and vegetable-based margarines used in cooking as well as fat spreads. The group ‘foods containing high amounts of sugar’ contained foods (soft drinks, sweetened fruit drinks, fruit juice, added sugar, chocolate, sweet, pastries, biscuits and dairy desserts) that contribute most to the intake of added sucrose among 3-year-old Finnish children(Reference Erkkola, Kronberg-Kippilä and Kyttälä5). Fish and skimmed milk are considered good indicators of a healthy diet and were therefore included in the FCHEI. As 1-year-old children are still commonly given infant formulas and as only 30 % of them drank skimmed milk(Reference Kyttälä, Erkkola and Kronberg-Kippilä34), the food group ‘skimmed milk’ was not included in the FCHEI score of this age group.
Table 2 Items and score range of the Finnish Children Healthy Eating Index (FCHEI)
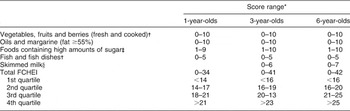
*Food consumption closest to the recommendations(35,36) gets most points. Energy-adjusted consumption of food groups was graded with scores according to deciles. Non-consumers in food groups get a score of 0 points.
†Commercial baby foods were included in the food group.
‡Includes soft drinks, sweetened fruit drinks, fruit juice, added sugar, chocolate, sweet, pastries, biscuits and dairy desserts.
§Skimmed milk was not included in the FCHEI score of 1-year-old children.
Food consumption was expressed in relation to energy intake (per MJ). Among the food variables, only energy-adjusted consumption of ‘vegetables, fruits and berries’ was normally distributed in all age groups. There were substantial proportions of non-consumers in the ‘fish and fish dishes’ and ‘skimmed milk’ food groups. Energy-adjusted consumption of food groups was graded with scores of 0–10 according to deciles, with the food consumption closest to the recommendation(Reference Hasunen, Kalavainen and Keinonen35) receiving the most points. Those in the highest consumption decile received the highest scores. As all non-consumers of food groups received a score of 0 points and there were considerable proportions of non-consumers in the ‘fish and fish dishes’ and ‘skimmed milk’ food groups, the maximum score in these groups was less than 10 points (Table 2). For the food group ‘foods containing high amounts of sugar’, the scoring was inversed with the lowest consumption decile and the non-consumers receiving the highest scores. The final FCHEI score was the sum of the food-group-specific scores.
To validate the FCHEI, daily intake of energy, energy-adjusted intakes of SFA, MUFA, PUFA, dietary fibre and sugars, as well as absolute intakes of vitamin D and E, were calculated based on the 3 d food records. Total nutrient intake was the sum of intakes from both foods and dietary supplements. When adjusting nutrient intakes for energy consumption, a conversion factor of 17 kJ/g was used for sugars and 37 kJ/g for fatty acids. The nutrients chosen to validate the FCHEI were mainly those that did not agree with the recommendations in earlier studies among Finnish children(Reference Kyttälä, Erkkola and Kronberg-Kippilä34, 36) (SFA, sugars, PUFA, vitamin D and vitamin E) or those that were considered significant in measuring diet quality (energy, MUFA and dietary fibre). Energy density (kJ/g) was calculated by dividing the total energy intake with the total weight of all foods and drinks consumed by the child.
Statistical methods
Correlations between food group scores of the FCHEI were assessed using Spearman correlation coefficients. Either the Pearson correlation coefficients or the Spearman correlation coefficients (for variables not normally distributed) were used to examine the correlations between the total FCHEI score and the energy, energy density and nutrient intakes.
Children were divided into quartiles based on the total FCHEI scores. The associations between the FCHEI quartiles and energy, energy density and nutrient intakes were tested with one-way ANOVA or alternatively with Welch ANOVA for groups with unequal variances. Nutrient variables that were not normally distributed (vitamin D and PUFA in 1-year-olds, vitamin D in 3-year-olds, sugars and dietary fibre in 6-year-olds) were log-transformed prior to analysis. The Kruskal–Wallis test was used for those variables (sugars in 1-year-olds, vitamin D in 3-year-olds and vitamin D in 6-year-olds) that did not meet the assumptions of normal distribution even after log transformation.
Cross-tabulations of family characteristics and the lowest FCHEI quartile were performed with the Pearson χ 2 test. Logistic regression was used to assess associations between family characteristics and the lowest FCHEI quartile. All family characteristics used in the logistic regression analysis together with their categorization are presented in the online supplementary material, Supplemental Table A. Paternal BMI was not included in the models because weight and height information was not collected from the fathers of the 6-year-old children. In addition, backward stepwise logistic regression was performed. The results are reported as adjusted odds ratios and 95 % confidence intervals. All the analyses were carried out using the statistical software package IBM SPSS Version 19·0. The level of significance used was P < 0·05.
Results
Validity of the FCHEI
Some of the food-group-specific scores correlated positively with each other. The score of ‘foods containing high amounts of sugar’ correlated positively with the scores of ‘vegetables, fruits and berries’ (1-year-olds: r = 0·107, P = 0·022; 3-year-olds: r = 0·172, P < 0·001; 6-year-olds: r = 0·113, P = 0·002), ‘oils and margarine (fat ≥55 %)’ (3-year-olds: r = 0·110, P = 0·017; 6-year-olds: r = 0·078, P = 0·038) and ‘skimmed milk’ (3-year-olds: r = 0·167, P < 0·001; 6-year-olds: r = 0·181, P < 0·0 0 1). In addition, the score of ‘fish and fish dishes’ correlated positively with the scores of ‘vegetables, fruits and berries’ (r = 0·127, P = 0·006) among the 3-year-olds and ‘oils and margarine (fat ≥55 %)’ (r = 0·083, P = 0·026) among the 6-year-olds.
There was no difference in energy intake between FCHEI quartiles of the 1-year, 3-year and 6-year-old children (Table 3). However, the intake of energy correlated inversely with the FCHEI score among the 1-year-old and the 3-year-old children (Table 3). In all age groups, energy-adjusted intakes of SFA and sugars decreased across ascending quartiles of the FCHEI scores (P for all <0·001). Further, the energy density of the diet was lower among those 3- and 6-year-old children who belonged to the higher FCHEI quartiles (P for all <0·001). Strong inverse correlations of SFA, sugars and energy density of the diet with the FCHEI scores (Table 3) indicate that a higher FCHEI reflects a healthier diet. Compared with the Nordic Nutrition Recommendations(36) the average intake of SFA was high in all FCHEI quartiles in each age group (Table 3). Similarly, the mean intake of sugars was above 10 % of energy in all FCHEI quartiles among the 3- and 6-year-old children (Table 3).
Table 3 Intakes of selected nutrients and energy density (mean and standard deviation) by quartile of the Finnish Children Healthy Eating Index (FCHEI) among 1-, 3- and 6-year-old Finnish children, Type I Diabetes Prediction and Prevention (DIPP) Nutrition Study, 2003–2005
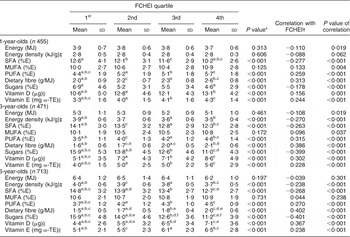
%E, percentage of energy; α-TE, α-tocopherol equivalents
*The associations between the FCHEI quartiles and energy, energy density or nutrient intakes were tested with ANOVA or the Kruskal–Wallis test. Statistically significant correlations between FCHEI quartiles are marked with superscript letters a–f.
†Correlations between energy, energy density or nutrient intakes and FCHEI scores were evaluated by Pearson correlation coefficients or Spearman correlation coefficients.
‡Energy density = energy (kJ) divided with all foods and drinks (grams) the child had consumed.
§Nutrient intake is the sum of intakes from food and dietary supplements.
Energy-adjusted intakes of PUFA and dietary fibre, as well as absolute intakes of vitamins D and E, increased across ascending quartiles of the FCHEI scores in all age groups (P for all <0·001). Energy-adjusted intakes of PUFA and dietary fibre had strong positive correlations with the FCHEI scores (Table 3). Absolute intakes of vitamin D and vitamin E correlated positively with the FCHEI (Table 3). The mean intake of PUFA met the recommended range of 5–10 % of energy in the three highest quartiles of the FCHEI among the 1-year-olds but in none of the quartiles among the 3- and 6-year-olds (Table 3). The mean daily intake of vitamin D was higher than the recommended 10 μg in all FCHEI quartiles among the 1-year-olds, but lower than the recommended 7·5 μg in the first three FCHEI quartiles among the 3-year-olds and in all quartiles among the 6-year-olds (Table 3). The two lowest FCHEI quartiles among the 1- and 3-year-olds, and the lowest FCHEI quartile among the 6-year-olds, had lower than the recommended intake for vitamin E (Table 3).
Associations of family characteristics with the lowest quartile of FCHEI
Proportions of children with different family characteristics in the lowest FCHEI quartile of each age group are shown in Supplemental Table A (online supplementary material). Among the 1-year-old children, none of the characteristics were associated with the lowest FCHEI quartile. The proportion of children in the lowest FCHEI quartile was significantly (P < 0·05) higher among the 3-year-old children who lived in rural or semi-urban areas, who were cared for at home and whose father had none or little vocational education, and among the 6-year-olds who lived in rural areas, who were cared for at home, whose mother had no or lower vocational education and whose mother smoked during pregnancy (Supplemental Table A).
In the multivariate logistic regression analysis none of the characteristics were associated with the lowest FCHEI quartile in the 1-year-olds (Table 4). Among the 3-year-olds, the strongest determinants of belonging to the lowest FCHEI quartile were being cared for at home and living in a semi-urban (v. urban) area (Table 4). Among the 6-year-old children, being cared for at home, maternal vocational school/course or upper secondary vocational education (v. academic education) as well as maternal smoking during pregnancy were associated with the lowest FCHEI quartile (Table 4). Results of the backward stepwise logistic regression were very similar to the results received from the model in which all characteristics were included at the same time (results not shown). Logistic regression was used to assess associations between the same family characteristics and the highest FCHEI quartile (v. the three other quartiles): being cared for at home was the only characteristic that was associated with the highest quartile of the FCHEI (3-year-olds: OR = 0·331; 95 % Cl 0·317, 0·893, P = 0·017; 6-year-olds: OR = 0·383; 95 % Cl 0·244, 0·601, P < 0·001).
Table 4 Associations of family characteristics with the first quartile (diet which deviates most from the recommendations) of the Finnish Children Healthy Eating Index (FCHEI) in logistic regression models among 1-, 3- and 6-year-old Finnish children, Type I Diabetes Prediction and Prevention (DIPP) Nutrition Study, 2003–2005
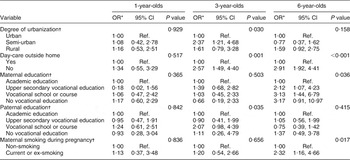
Ref., referent category.
*Results of logistic regression are reported as adjusted odds ratio and 95% confidence intervals. All variables shown in the table and also sex of the child, maternal age, number of siblings and maternal BMI in each age group were included in the model simultaneously.
†Asked at the time of birth of the child.
Discussion
In the validation study, intakes of SFA and sugars and energy density of the diet decreased across ascending quartiles of the FCHEI whereas the intakes of PUFA, dietary fibre, vitamin D and vitamin E increased. Thus, a higher FCHEI score reflects a healthier diet and the FCHEI can be considered to be a useful tool for describing the diet quality of pre-school aged children. The FCHEI varied significantly between some sociodemographic groups. Being cared for at home was associated with the lowest FCHEI quartile (diet that deviates most from the recommendations) among the 3- and 6-year-olds. Additional determinants of belonging to the lowest FCHEI quartile included residence in a semi-urban area among the 3-year-old children, and low maternal education and smoking during pregnancy among the 6-year-old children.
Guided by earlier studies we selected vegetables, fruits and berries, oils and margarine, sucrose-rich foods, fish and fish dishes as well as skimmed milk for inclusion in the FCHEI(Reference Erkkola, Kronberg-Kippilä and Kyttälä5, Reference Kyttälä, Erkkola and Kronberg-Kippilä34, Reference Lehtisalo, Erkkola and Tapanainen37). To improve the quality of the diet of Finnish pre-school children, the use of fat-free milk, oils and margarine with high fat content, two fish meals per week and five portions of vegetables and fruits per day are being recommended(Reference Hasunen, Kalavainen and Keinonen35). The FCHEI was kept simple as it contains only four (in 1-year-olds) and five (in 3- and 6-year-olds) food group components with both quantity and quality aspects. Further, it is recommended that children be introduced slowly to the diet of the whole family after 10 months of age(Reference Hasunen, Kalavainen and Keinonen35). Hence, the same Finnish Dietary Recommendations(Reference Hasunen, Kalavainen and Keinonen35) that apply to pre-schoolers are also valid for 1-year-old children. The exception is the use of milk: some 1-year-olds are still partially breast-fed and some use infant formulas(Reference Kyttälä, Erkkola and Kronberg-Kippilä34).
In the present study, despite the fact that the higher FCHEI scores were associated with nutrient intakes closer to the recommended levels(36), the dietary recommendations were not fully met, especially among older children. The nutrient intakes of the 1-year-olds met the recommendations better than those of the older age groups. This is in accordance with a review on the use of dietary indices among children in Western countries in which it was concluded that younger children have a better dietary quality than older ones(Reference Lazarou and Newby19).
The 3 d food records give an accurate estimate of the usual intake for the most frequently consumed foods such as porridge, milk and bread spreads. However, more recording days are required for some foods that are consumed less frequently. Most food groups in the FCHEI included foods most commonly consumed by Finnish children(Reference Kyttälä, Erkkola and Kronberg-Kippilä34), with the exception of fish and fish dishes, for which three food recording days may not have been sufficient to categorize all children correctly. We did not exclude potential under-reporters from the analysis as the day-to-day variation in the diet during childhood tends to be high(Reference Erkkola, Kyttälä and Takkinen38) and hence reliable identification of under-reporters is difficult. In a Norwegian validation study among 2-year-old children, the food items typically under-reported were sucrose-rich foods such as cakes, soft drinks and sweets, while the consumption of healthier foods such as bread, fruits and potatoes were over-reported(Reference Andersen, Lande and Trygg39).
The FCHEI was validated against the intakes of selected nutrients from the same data. There was a significant inverse correlation of the FCHEI with both the energy density of the diet and with the intakes of nutrients that, compared with the Nordic Nutrition Recommendations(Reference Kyttälä, Erkkola and Kronberg-Kippilä34), are excessive in the diet of Finnish children (SFA and sugars). The FCHEI was further positively correlated with nutrients that are scarce in the diet of Finnish children (PUFA acid, vitamin D, vitamin E) or are considered good indicators of a healthy diet (dietary fibre). There are only a few quantitative aspects of food consumption in the Finnish Dietary Recommendations for children(Reference Hasunen, Kalavainen and Keinonen35) and thus it would be difficult to develop an ideal menu for Finnish children. For these reasons it was not possible to assess all aspects of content and construct validity(Reference Garriguet22, Reference Guenther, Reedy and Krebs-Smith40) for the FCHEI. Some aspects of construct validity were determined however: the FCHEI did not correlate positively with energy intake and the FCHEI scores varied significantly between some sociodemographic groups (smoking/non-smoking, parental education level) known from earlier studies to have differences in diet quality(Reference Northstone and Emmett6, Reference Fisk, Crozier and Inskip7, Reference Manios, Kourlaba and Kondaki20). The score of food group ‘foods containing high amounts of sugar’ correlated positively with the scores of other food groups.
Although both food and dietary supplement sources were included in vitamin D intake and a large portion of vitamin D was derived from dietary supplements(Reference Kyttälä, Erkkola and Kronberg-Kippilä34), the total intake of vitamin D correlated positively with the FCHEI. This may be explained by the accumulation of good health behaviours such as recommended use of vitamin D supplements and healthy eating habits in the highest sociodemographic groups(Reference James, Nelson and Ralph3). It is important to adjust for total energy when calculating the diet quality index to ensure that children, and especially boys who have a higher overall intake, are not falsely scored and as a result categorized as having a better diet quality. We have reported earlier that while the mean intake of energy is higher among boys than girls, there are only a few differences between the sexes in energy-adjusted food consumption(Reference Kyttälä, Erkkola and Kronberg-Kippilä34). In the present study, we observed a slight inverse correlation between the FCHEI score and energy intake among the 1- and 3-year-old children.
In order to prevent wider dietary differences that stem from sociodemographic characteristics, the major sociodemographic and lifestyle determinants of the children's diet should be assessed and defined. Among the 1-year-olds none of the characteristics was associated with the lowest FCHEI quartile. The impact of sociodemographic characteristics on the diet quality of the 1-year-olds may be reduced by lesser variability of the index points, which was caused the fact that there were fewer numbers of food groups in the FCHEI within this age group. Further, there is not much variation in the diet of 1-year-old Finnish children because of the high consumption of commercial baby foods in Finland(Reference Kyttälä, Erkkola and Kronberg-Kippilä34).
The results of the present study are in accordance with our earlier studies in which day care outside the home has been inversely associated with the intake of added sucrose in 3-year-old children(Reference Erkkola, Kronberg-Kippilä and Kyttälä5) and with the ‘ready-to-eat baby foods’ cluster in 1-year-old children(Reference Ovaskainen, Nevalainen and Uusitalo17). A snack-dominating meal pattern may be more frequent among children cared for at home, whereas eating occasions in day-care centres are more regulated. The quality of the food served in day-care centres should also follow the Finnish Dietary Recommendations(Reference Hasunen, Kalavainen and Keinonen35) and the Nordic Nutrition Recommendations(36).
The current study further demonstrated that those 3-year-old children who resided in semi-urban areas had a poorer diet quality than those living in urban areas. In an earlier study in Finland, the consumption of traditional Finnish foods, such as rye, potatoes, milk, butter and sausages, was more common among Finns living in rural areas while the more health-conscious food choices were more common in urban areas(Reference Mikkilä, Räsänen and Raitakari41). Previous studies in the USA and Greece have demonstrated that children living in urban areas had lower original Healthy Eating Index (HEI) scores(Reference Manios, Kourlaba and Kondaki20) and higher soft drinks consumption(Reference Harnack, Stang and Story12) than children in rural areas.
In general, many previous studies have revealed results similar to ours on the impact of maternal education level on the child's diet. Higher maternal education has consistently been associated with a higher HEI score(Reference Manios, Kourlaba and Kondaki20) and healthier dietary patterns(Reference Northstone and Emmett6, Reference Fisk, Crozier and Inskip7), dietary clusters(Reference Gubbels, Kremers and Stafleu18) and food intakes(Reference Cockroft, Durkin and Masding13, Reference Rogers and Emmett14), as well as with higher intakes of most vitamins and minerals in the child(Reference Rogers and Emmett14). In the few past studies that have included information on paternal education, high paternal education has been inversely associated with a high-sucrose diet(Reference Erkkola, Kronberg-Kippilä and Kyttälä5) and the consumption of sweets and pastries(Reference Brekke, van Odijk and Ludvigsson42). Some studies have used the parents’ combined education level: high parental education level was associated with high scores in the Canadian adaptation of HEI-2005(Reference Garriguet22) and with high consumption of fish, fibre-rich bread and main meals in Finnish children(Reference Eloranta, Lindi and Schwab43). In one further Finnish study, low parental education level was associated with a child's ‘traditional dietary pattern’ whereas a ‘health-conscious pattern’ was more common in children whose parents had high education level(Reference Mikkilä, Räsänen and Raitakari41). Poor lifestyle habits are usually clustered in the same socio-economic groups(Reference James, Nelson and Ralph3). Maternal current smoking status(Reference Fisk, Crozier and Inskip7) and smoking during pregnancy(Reference Brekke, van Odijk and Ludvigsson42) have both been associated with less healthy eating habits in the child but no associations have been seen at the nutrient level(Reference Rogers and Emmett14).
The FCHEI score used in the present study was not associated with the child's sex, number of siblings, maternal age or maternal BMI. In an earlier study, we found that a higher number of siblings increased the risk for a high-sucrose diet(Reference Erkkola, Kronberg-Kippilä and Kyttälä5). Studies from the UK and the Netherlands have reported associations between a healthier diet in children and older maternal age, lower maternal BMI and fewer siblings(Reference Northstone and Emmett6, Reference Fisk, Crozier and Inskip7, Reference Gubbels, Kremers and Stafleu18). In most of the studies, female sex has been associated with better dietary quality(Reference Lazarou and Newby19) but the study using the original HEI reported better dietary quality in boys(Reference Manios, Kourlaba and Kondaki20).
Conclusion
In conclusion, the FCHEI serves as a valid indicator of the quality of Finnish children's diet. Public health programmes aimed at improving the dietary behaviours of pre-school children should aim to improve the quality of food served at home. Families with a history of lower parental education, maternal smoking during pregnancy or non-urban place of residence may require special attention.
Acknowledgements
Sources of funding: This study was supported by the Ministry of Social Affairs and Health, Academy of Finland (grant numbers 63672, 79685, 79686, 80846, 201988, 210632, 129492, 126813, 139391), the European Foundation for the Study of Diabetes, the Finnish Diabetes Research Foundation, the Finnish Paediatric Research Foundation, the Juho Vainio Foundation, the Yrjö Jahnsson Foundation, the Competitive Research Funding of the Tampere University Hospital (grant numbers 9B099, 9C084, 9D081, 9E082, 9F089, 9G087, 9H092, 9J147, 9K149, 9L117, 9M114), Medical Research Funds of Turku and Oulu University Hospitals, the Juvenile Diabetes Research Foundation (grant numbers 197032, 4-1998-274, 4-1999-731, 4-2001-435), the Novo Nordisk Foundation and EU Biomed 2 (BMH4-CT98-3314), Doctoral Programmes for Public Health, and the Jalmari and Rauha Ahokas Foundation. None of the funders had a role in the design, analysis or writing of this article. Conflicts of interest: None of the authors had financial or personal interests in any company or organization sponsoring the research at the time of the research. Authors’ contributions: S.M.V. designed the DIPP Nutrition Study and is responsible for the study. S.M.V., M.-L.O., M.E., S.L.-J., L.U. and P.K. designed the present study. P.K. drafted the manuscript and did statistical analysis. M.K. is the principal investigator of the DIPP Study in Oulu and Tampere, and O.S. in Turku. R.V. is the senior investigator of the DIPP Study in Oulu. All co-authors participated in the evaluation of the results and in editing the final manuscript. Acknowledgements: The authors express their gratitude to the children and parents who participated in the DIPP Study. They are grateful to the DIPP research nurses, doctors, nutritionists and laboratory staff for their collaboration over the years.


