


The main objective of dietary surveys is to assess nutritional intakes of a given population. Their analysis allows identifying public health issues regarding food and nutrition, and if necessary, to establish actions aimed at improving food and nutrition education in this population. Diet is essential for growth and development during the first years of life and also in the medium and long term determines risk of non-communicable diseases( Reference Barker 1 – Reference Simeoni, Bocquet and Briend 3 ).
The Secteur Français des Aliments de l’Enfance (SFAE) has conducted and funded a national survey on eating behaviours and food consumption of infants and young children every 8 years for more than three decades (1981, 1989, 1997 and 2005)( Reference Boggio, Lestradet and Astier-Dumas 4 – Reference Fantino and Gourmet 7 ). Over the years, the study population has been modified to include children from birth to 35 months of age, and the methodology has gradually become refined. The specific features of the latest survey in 2013 were the inclusion of breast-fed (BF) infants as well as children receiving ‘growing-up milk’ (GUM); an increased sample size in each age group to improve the statistical power of the survey; and a direct measurement of the children’s weight.
The objectives of the Nutri-Bébé SFAE 2013 study were to:
-
1. study the eating behaviours and food, macro- and micronutrient consumption of infants and young children living in France; and
-
2. compare the observed feeding practices with existing European and French recommendations.
The purpose of the present paper is to describe the methodology, the population and the sampling procedure of the 2013 survey, as well as the feeding practices of infants and young children in 2013 compared with 2005.
Methods
Nutri-Bébé 2013 is the fifth edition of a survey conducted every 8 years since 1981 by the SFAE. Overall, the methodology and the procedures followed are in line with the guideline set by the European Food Safety Authority (EFSA) Expert Group on Food Consumption Data and the Institut Français de Nutrition (IFN)( 8 , 9 ).
Sample design
The Nutri-Bébé 2013 survey is an observational cross-sectional study conducted in children living in France aged 15d to 35 months. It includes a section on eating behaviours and a section on food consumption. The present survey is based on a randomly selected sample with sociodemographic characteristics similar to the general population living in mainland France (i.e. excluding Corsica, overseas departments, regions and communities, and New Caledonia). A quota sampling method was used: sampling was stratified by residential area, size of the urban agglomeration, infant gender, mother’s professional activity (active or inactive before any maternity leave), occupational and socio-occupational status (in French, ‘professions et catégories socio-professionnelles’ (PCS); classified into three categories: PCS+, PCS– and inactive, as detailed in Table 1) and adjusted for these different characteristics. This stratification was based on the population characteristics of the 2002 census of the National Institute for Statistics and Economic Research (in French, Institut National de la Statistique et des Études Économiques (INSEE); https://www.insee.fr/fr/ffc/docs_ffc/IP857.pdf).
Table 1 Description of the socio-occupational categories according to PCS (‘professions et catégories socio-professionnelles’) classification and prevalence of each category in the French and the survey populations

Inclusion criteria were as follows: (i) informed parental consent to participate in the study; (ii) absence of intercurrent or chronic disease; and (iii) birth weight above 2·5 kg. To ensure comparability with the 2005 survey, the same age-group definitions were used. Eleven age groups that took account of the previous surveys and the key stages of child development were defined: 15 d to 3 months, 4, 5, 6, 7, 8–9, 10–11, 12–17, 18–23, 24–29 and 30–35 months. Eighty children were planned to be enrolled in each age group, totalling 880 children for the main sample. For the current survey 164 additional non-breast-fed (NBF) children were added (‘oversampling’) for comparison with previous studies. The final number of children enrolled in each group is described in Table 2, which also specifies the recruitment method (main sample or oversample). Only BF children were included in the ‘eating behaviours’ component of the study. In the absence of information on the volume and composition of ingested breast milk, only data for NBF children were used for the ‘food consumption’ component of the study. To analyse the consumption of children receiving GUM in age groups older than 1 year, an additional recruitment of ninety-four children consuming GUM and thirty-two who did not consume it was done (Table 2). A total of 1192 children were recruited and 1184 finally enrolled in the study (Fig. 1).
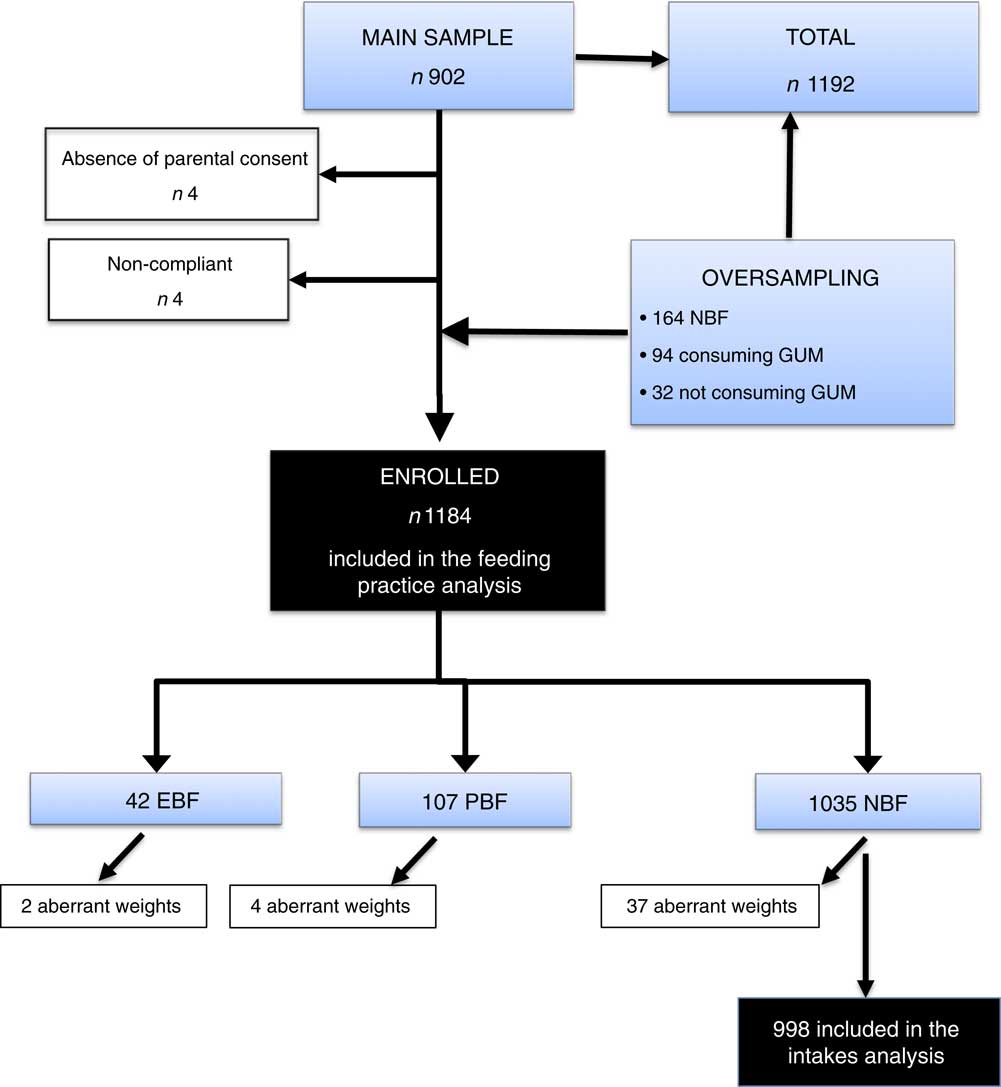
Fig. 1 Flowchart of the study sampling for the French national survey on food consumption of children under 3 years of age (Nutri-Bébé 2013); for details see text and Table 2 (NBF, non-breast-fed; EBF, exclusively breast-fed; PBF, partially breast-fed; GUM, growing-up milk)
Table 2 Sample distribution by age group, recruitment method and breast-feeding prevalence in the French national survey on food consumption of children under 3 years of age (Nutri-Bébé 2013)

EBF, exclusively breast-fed; PBF, partially breast-fed; NBF, non-breast-fed, GUM, growing-up milk.
Conducting the survey
The study was conducted from 3 January to 21 April 2013, by an official polling institute, the TNS Sofres.
After the selection of families by the quota sampling method and obtaining their consent, a first home visit was conducted. An information letter from TNS Sofres explained the objectives of the study, presented the questionnaire and invited the caregivers to take part in the survey. The following information was collected during a face-to-face interview: date of birth and birth weight, verification of inclusion criteria, eating habits, lifestyle and physical activity, mother’s age, parity, past or current breast-feeding, number of people in the household, occupation (PCS) and level of education of the reference person in charge of the child, socio-economic status and source of advice regarding the child’s diet. The employment status of the reference person was classified as ‘working’ or ‘not working’ (student, unemployed, without a profession, retired). The level of education included three levels: (i) no education or primary and/or early secondary school; (ii) up to the baccalauréat; and (iii) upper education including university. The respondent could refuse to answer certain questions or discontinue participation in the study at any time.
To measure food consumption, a diary, a measuring jug (Curver 1 litre; gencod 3253920404008), a photographic tool kit to assess food portions, kitchen measuring tools and scales were provided and their use explained to the caregiver. Parents completed the child’s consumption diary over a period of three non-consecutive days (two weekdays and one weekend day). A second visit occurred 7 d later to verify and complete the diary if necessary, and to conduct a face-to-face interview with the mother about eating habits over the survey period. Both interviews were recorded using CAPI® software (Computer Assisted Personal Interviews; http://www.soft-concept.com). During this visit, the child was weighed (naked, with a clean diaper or underwear) using a Tefal PREMISS PP1000VO scale with a precision of 100 g. If parents did not allow the investigator to weigh the child, a recent record (<15 d earlier for infants, <1 month earlier for children over 12 months of age) could be provided; otherwise the child was not included in the study. The weight was compared with WHO standards( 10 ). Weights that were found to be totally inconsistent with the child’s age (>3 sd or <3 sd), presumably due to a measurement error or report, were considered ‘aberrant’ and are shown in Fig. 2. They were not taken into account in the calculation of mean weight (Fig. 3) or in that of the weight-based nutritional intakes.
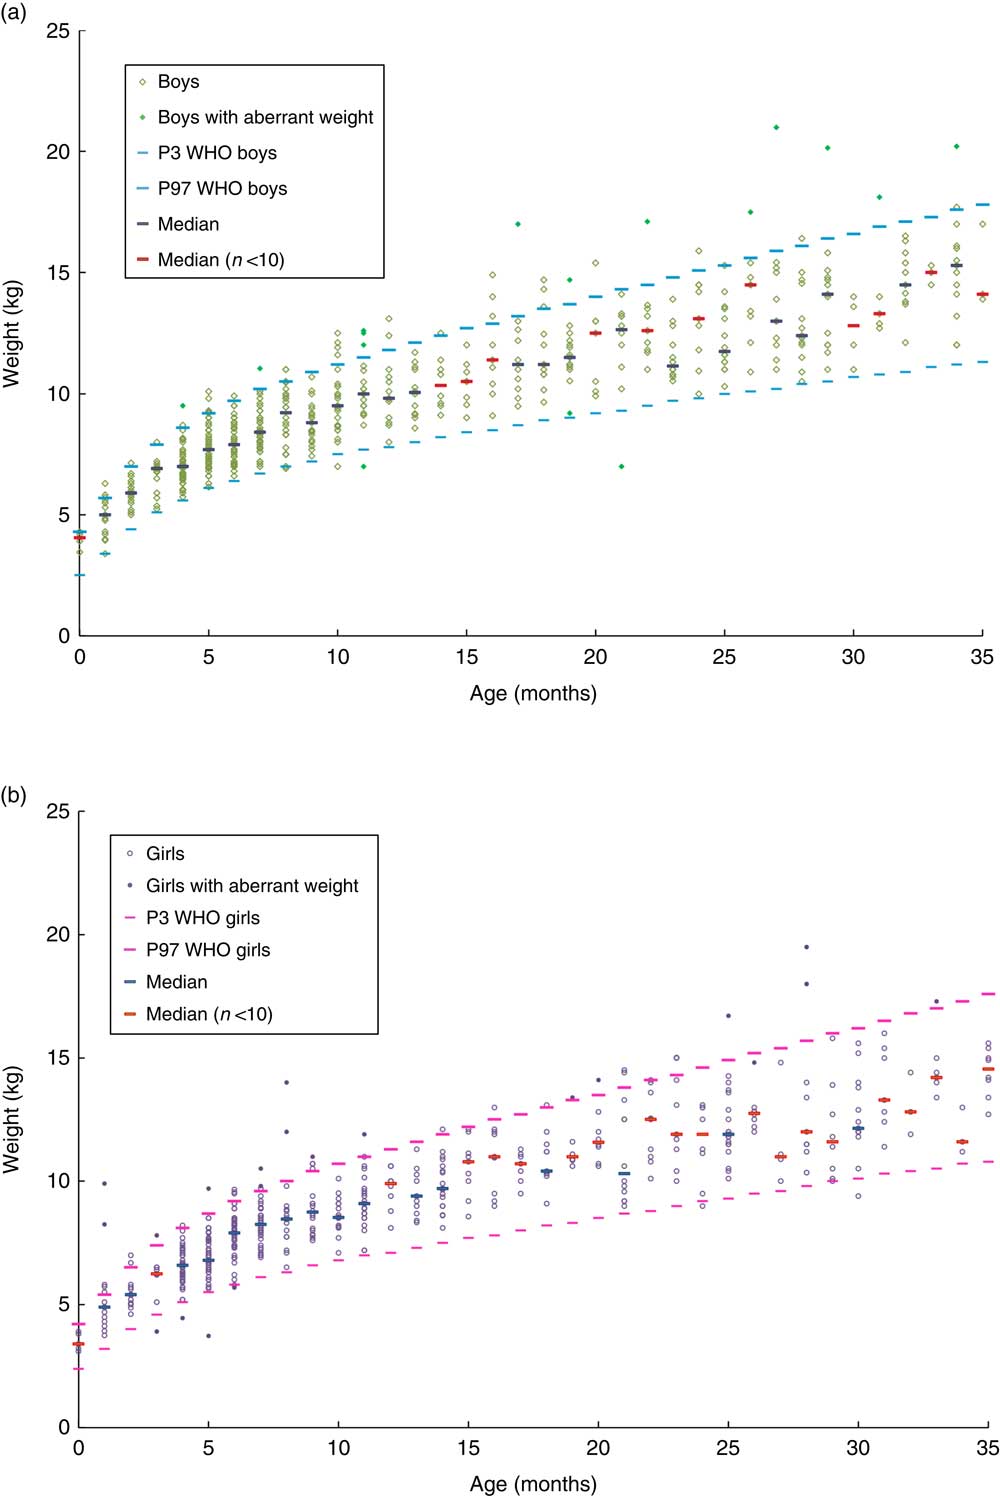
Fig. 2 Distribution of weight by age and gender, relative to the 3rd percentile (P3) and 97th percentile (P97) curves of the WHO Child Growth Standards, among 1035 non-breast-fed children in the French national survey on food consumption of children under 3 years of age (Nutri-Bébé 2013): (a) boys (n 541); (b) girls (n 494)
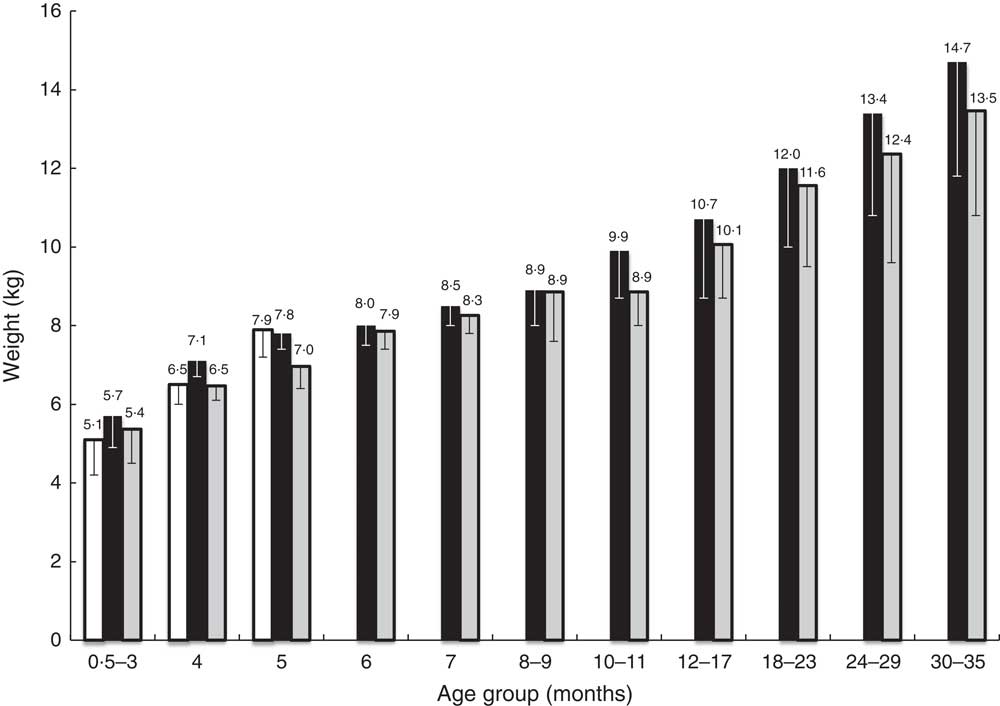
Fig. 3 Mean weight by age of the exclusively breast-fed infants (n 42; ![]() ) and of the non-breast-fed children (n 1035) by age and gender (
) and of the non-breast-fed children (n 1035) by age and gender (![]() , boys;
, boys; ![]() , girls; for the number in each age group, see Table 2), with the standard deviation represented by vertical bars, in the French national survey on food consumption of children under 3 years of age (Nutri-Bébé 2013)
, girls; for the number in each age group, see Table 2), with the standard deviation represented by vertical bars, in the French national survey on food consumption of children under 3 years of age (Nutri-Bébé 2013)
Food diaries for the ‘consumption’ component
The child’s food consumption diary was completed between the two visits of the TNS Sofres investigator. The person in charge of the child was trained to qualitatively and quantitatively report all liquid and solid foods consumed and all drinks, by specifying the exact name of the product, its potential trademark or whether it was ‘home-made’. The type of water consumed was noted as being either ‘bottled’ or ‘tap’. For each food type consumed, it was requested that the quantity served (in grams, millilitres or dose) and remaining after the meal be noted, and their ingredients, as far as possible, be weighed using a kitchen scale, or with the help of a measuring cup or packaging information and/or photographs of reference portion sizes. The type (breakfast, morning snack, lunch, afternoon snack, dinner, nocturnal food intake) and timing of food consumption were collected. If applicable, vitamin, mineral or medicine supplements were noted. During the second visit, the investigator reviewed thoroughly the record with the caregiver and checked the way of reporting the quantities as well as the interpretation of the photographic tool kit to be as close as possible to reality.
Analysis of food diaries
The Research Centre for the Study and Observation of Living Conditions (in French, Centre de Recherche pour l’Etude et l’Observation des Conditions de Vie (CREDOC)) analysed the food intake diaries. For common foods, ‘not specific for babies’, the 2012 CIQUAL (Centre for Information on Food Quality) composition table elaborated by the French Agency for Food, Environmental and Occupational Health & Safety (in French, Agence nationale de sécurité sanitaire de l’alimentation, de l’environnement et du travail (ANSES)) was used (after correction of errors), representing 1439 food codes( 11 ). For ‘foods specific for babies’, nutritional composition was obtained from manufacturers who are members of the SFAE, from product labelling or by calculation based on the average composition of the foods included in the product( 9 ), representing 1223 food codes. The diaries were analysed by two dietitians who attributed a food code to each food, after verifying all data (consistency check). The actual quantity consumed was calculated for each food. For simple foods containing a single ingredient, the amount consumed (Q c) corresponded to the amount served (Q s) minus the amount remaining (Q r) once the meal was over. For complex foods or dishes, the amount of each ingredient was calculated using the following formula: Q c=(Q s−Q r)×p, where p is the relative weight of the ingredient in the food. A duplicate data entry was performed to prevent any forgetting or mistake in data entry. To use the data, foods were divided into forty-six food categories, including seventeen for ‘foods specific for babies’ and twenty-nine for common foods (see online supplementary material).
Statistical analysis
Results were expressed as means and sd. The mean food consumption values were calculated as follows:
 $$A_{a} \,{\equals}\,{{\mathop{\sum}\limits_{k \in a} {{{\left( {A_{{k1}} {\plus}A_{{k2}} {\plus}A_{{k3}} } \right)} \mathord{\left/ {\vphantom {{\left( {A_{{k1}} {\plus}A_{{k2}} {\plus}A_{{k3}} } \right)} 3}} \right. \kern-\nulldelimiterspace} 3}} } \over {N_{{\rm a}} }},$$
where A a is the mean daily intake of food a in the age group; A k1, A k2 and A k3 are the contributions of each individual on the first, second and third days of the survey; and N a is the size of the age group. The statistical analysis was performed using the statistical software package SAS® version 9·2 (http://support.sas.com/documentation/installcenter/922/). A Pearson’s χ 2 test was used for comparisons of categorical data either within the 2013 survey or whenever possible with the 2005 survey. Analysis of quantitative data was based on ANOVA and Student’s t test. A significance level of 0·05 was used, with 95 % CI.
Results
Characteristics of the study population
A total of 1192 children were recruited, 1188 of whom were enrolled due to their parent’s consent to participate in the study. Age range was 15 d to 3 years, and 50 % of children were male. Mean birth weight was 3329 (sd 480) g. Birth weight ranged from 2500 to 3000 g in 27 % of children, from 3001 to 3500 g in 41 %, from 3501 to 4000 g in 25 %, and was above 4001 g in 7 %.
Among the 1188 enrolled children, four could not be considered in the food consumption analysis due to non-compliance with the study protocol. The NBF children’s weights measured during the second visit were distributed as shown in Fig. 2 and their mean value by age as well as that of BF infants is given in Fig. 3. No difference was seen between BF and NBF infants or between genders. The weights of forty-three children, including six who were BF, were considered aberrant for their age. Among the 1141 children whose weight was considered compatible with their age, 5·4 % were overweight, with a weight-for-age greater than or equal to the 97th percentile of the WHO Child Growth Standards( 10 ), and 7 % were underweight, with a weight-for-age less than or equal to the 3rd percentile of the same charts.
Sociodemographic context
The mothers of the 1184 children included in the food consumption survey had a mean age of 30·8 (sd 5·4) years, similar to that described in 2005 (30·3 years); 12 % of them were under 25 years old v. 13 % in 2005, 32 v. 31 % were between 25 and 29 years of age, 33 v. 35 % between 30 and 34 years, and 23 v. 21 % were over 35 years (NS). Thirty-eight per cent were primiparous while 39 % were in 2005 (NS); 89 % lived with a partner whereas 92 % did in 2005 (P=0·006). In 2013, 96 % of households v. 98 % in 2005 contained at least three people (P=0·019), with a mean of 4·1 (sd 1·3); 60 % of mothers v. 61 % in 2005 had an occupation at the time of the survey (NS). Forty-one per cent were PCS+, 53 % were PCS– and 6 % were inactive (Table 1), compared with 39, 53 and 8 %, respectively, in 2005 (NS); 46 % of mothers had level 3 postgraduate education; 8 % had no education or primary and/or early secondary school (level 1). Depending on the situation, 39 % of mothers relied on their previous experiences and 60 % on their instincts to feed their child; 31 % asked for advice from their relatives and 58 % sought the advice of a paediatrician, a general practitioner or a health-care professional specialised in early childhood; 22 % took into consideration media advice (Internet, specialised journals) and 2 % considered advice from food manufacturers. Mothers were more likely to seek advice from medical sources if they were primiparous (P=0·003), less than 30 years old (P=0·047) or if the child was under 12 months of age (P=0·0009). Multiparous, inactive mothers and those over 35 years of age favoured instinct and previous experience.
Feeding practices
Milk intake
At the time of the survey (Table 2), a total of forty-two infants were exclusively breast-fed (EBF); twenty-three were younger than 4 months and none was older than 5 months. On average, they had seven feedings per day with a mean duration of 21 min (95 % CI 18, 23 min) each; 21 % of mothers used sometimes a breast pump. Another 107 infants were partially breast-fed (PBF), with four breast-feedings per day of 18 (95 % CI 14, 21) min mean duration each; 73 % of them were previously EBF. Breast-feeding prevalence, whether exclusive or partial, was 31 % before 4 months of age, 24 % at 4 months of age, 10 % at 5 months, 8 % between 12 and 17 months, 5·5 % between 18 months and 2 years, and 1·6 % after 2 years, with no more BF children after 30 months (Fig. 4).

Fig. 4 Prevalence of the consumption of each category of milk (![]() , exclusively breast-fed;
, exclusively breast-fed; ![]() , partially breast-fed;
, partially breast-fed;![]() , infant formula;
, infant formula; ![]() , follow-on formula;
, follow-on formula; ![]() , growing-up milk;
, growing-up milk; ![]() , cow’s milk) by age among the children (n 1184) in the French national survey on food consumption of children under 3 years of age (Nutri-Bébé 2013)
, cow’s milk) by age among the children (n 1184) in the French national survey on food consumption of children under 3 years of age (Nutri-Bébé 2013)
One thousand and thirty-five children were bottle-fed (Table 2). Among them, 41 % were previously EBF and 15 % PBF. Breast-feeding was stopped in 29 % of the EBF children before the age of 2 months, in 27 % between 2 and 4 months of age and in 44 % after 4 months. Mean age at this weaning was 17·8 (sd 17·9) weeks. Respectively 26, 25 and 49 % of the PBF children were weaned at the same time (NS). The prevalence of present or past breast-feeding in the main sample (without the oversample) was 67 %. Mothers who breast-fed or who did it previously were more likely to belong to the PCS+ group (70 v. 60 % in PCS– and 46 % in inactive group; P=0·001); there was no difference between primiparous and multiparous. The type of milk consumed according to age by NBF children is detailed in Fig. 4. It was mainly infant formula (IF) before the age of 6 months. IF was continued in 86 % of cases beyond the age of 6 months; the mean age of abandonment of this IF was 6·1 v. 4·7 months in 2005 (P<0·0001). For 91 % of infants the IF was relayed by a follow-on-formula (FOF), which was continued on average until the age of 13 months (v. 12·5 months in 2005; NS). Sixty-three per cent of children subsequently received a GUM until a mean age of 31·2 months. At the time of the survey, 32 % of the overall NBF children consumed GUM v. 24 % in 2005 (P=0·0004). GUM was consumed by 17 % between 8 and 11 months of age and 53 % between 12 and 17 months. Thirty-two per cent of the nursing mothers gave GUM v. 25 % of mothers who never breast-fed (P=0·005). Mothers who used GUM did so in 66 % of cases on advice from a health professional. Compared with the 2005 results, there was a tendency to introduce FOF later (6–7 v. 4–5 months). GUM was consumed more often, with a gain of 8 % for all ages at the expense of the consumption of cow’s milk (CM). Between 1 and 2 years, most of the children received GUM. Five per cent of the children were already given CM at the age of 5 months. CM was consumed by 15 % at 10–11 months, more than 34 % after 1 year and more than 65 % after 2 years of age. The average age of changing to CM was 13·8 months in 2013 v. 12 months in 2005 (P=0·0001). Mothers who had breast-fed their baby introduced CM later than the NBF ones (15·1 v. 12·9 months; P=0·0003). Mothers who used CM did so in 75 % of cases according to their instinct or experience; 42 % of them justified their choice by a more interesting price. In 88 % of cases the CM used was a semi-skimmed one, as it was in 2005. Only two children between 12 and 17 months were drinking goat’s milk, and two others of the same age group were drinking vegetable commercial beverage. Up to 1 year of age about half of children drunk their milk warm, 40 % at room temperature and 10 % drank cold milk. The mean quantities of milk and dairy products/cheese consumed are given in Table 3. On average, milk consumption (IF, FOF, GUM or CM) was about 840 ml/d before 3 months of age, reached a maximum of about 900 ml/d at 4 months, then decreased to a little bit less than 500 ml/d at 8–9 months and to less than 350 ml/d after the age of 2 years. At the same time, the consumption of dairy products increased gradually but was insufficient to reach a total of 500 g of milk plus dairy products (including cheese) daily at the age of 3 years. Cheese contributed significantly (about 10 g/d on average) to dairy products from the age of 1 year.
Table 3 Average quantities (g/d) of milk, milky drinks, dairy products and cheese consumed by age by non-breast-fed children (n 1035) in the French national survey on food consumption of children under 3 years of age (Nutri-Bébé 2013)
IF, infant formula; FOF, follow-on formula; GUM, growing-up milk; CM, cow’s milk; MD, milky drinks.
Complementary feeding
The mean age for the introduction of solid foods other than milk was 5·4 (sd 2·1) months, while it was between 4 and 5 months in 2005 (P=0·032); 6 v. 13 % of children were introduced to solids before the age of 3 months; 31 v. 33 % at 4 months; 23 v. 32 % at 5 months; and 31 v. 16 % at 6 months (P<0·0001). Solid foods were introduced after 7 months of age in 10 % of children, v. 6 % in 2005. The mean age for consuming a full meal with solids and without milk was 9·9 (sd 5·5) months. In chronological order, the first three food types consumed, apart from milk, were fruits by 68 % of the infants, vegetables by 77 % and dairy products by 42 %. The numbers were similar in 2005. Among the first foods introduced, cereals were consumed by 31 % of infants, potatoes by 20 %, meat or fish by 13 %, and rice or pasta by 7 %. On average vegetables were consumed for the first time at 5·6 months, fruits at 5·9 months, dairy products at 5·9 months, cereals at 5·6 months, potatoes at 6·7 months, and meat or fish at 7·3 months. The relative quantitative proportion of each food category is indicated in Table 4. Specific baby foods were mainly used between 6 and 9 months, thereafter non-specific adult foods were mainly consumed. Only 4 % of the mothers gave specific baby foods exclusively, and only 0·2 % of them gave only home-made foods. The different steps of introduction of food textures are described in Fig. 5. Until 8 months of age, a fine homogenised texture was used by more 90 % of infants. Soft lumps were introduced after 8 months in half of the infants and pieces after 12 months. The percentage of children who occasionally or regularly consumed the same food as their parents was 26 % from 8 months of age, 81 % between 1 and 2 years of age, and 95 % after 2 years of age. Overall, 54 % of mothers reported that their child sometimes refused certain foods, mainly vegetables (54 %) or meat/fish (29 %). The same refusal rate was observed whether the child had been breast-fed or not.
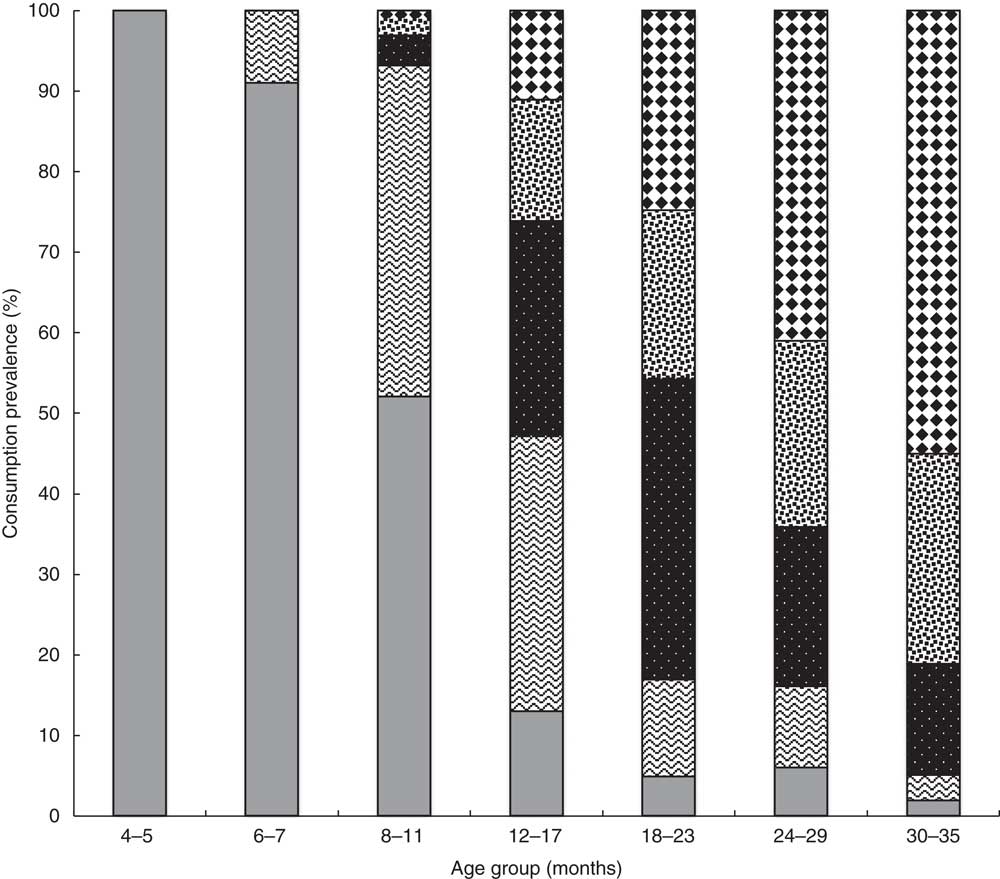
Fig. 5 Different steps of introduction of food textures (![]() , fine homogenised;
, fine homogenised; ![]() , curdled;
, curdled; ![]() , mashed with small lumps;
, mashed with small lumps; ![]() , soft pieces;
, soft pieces; ![]() , pieces), represented by the percentage of children (n 894) consuming each of them according to age, once the solids have been introduced, in the French national survey on food consumption of children under 3 years of age (Nutri-Bébé 2013)
, pieces), represented by the percentage of children (n 894) consuming each of them according to age, once the solids have been introduced, in the French national survey on food consumption of children under 3 years of age (Nutri-Bébé 2013)
Table 4 Contribution of the different categories of foods consumed by non-breast-fed children (n 1035) according to age, expressed as a percentage of the quantity ingested daily, in the French national survey on food consumption of children under 3 years of age (Nutri-Bébé 2013)
IF, infant formula; FOF, follow-on formula; GUM, growing-up milk.
Modality of meals
Eighty-six per cent of mothers fed their child themselves and 89 % prepared their child’s meals. Multiparous mothers were more prone to feed their child (P<0·0001) and to prepare their meals (P<0·002), as multiparous mothers are more often housewives (49 v. 22 %; P<0·0001), but there was no difference between BF and NBF mothers. Twelve per cent of children had some of their meals at a nursery or with their child-minder; this was more likely to occur when it was the first child. After 1 year of age, more than half of the children regularly ate their meals at the same time as their parents. Twenty-nine per cent of all children ate their meals in front of the television or any screen, which was already the case for 15 % of children under 4 months. This habit was less frequent when the mother was PCS+ (12 %) than with PCS– (31 %) or inactive mothers (35 %; P<0·0001).
Physical activity
Fifty-three per cent of the children watched a screen every day. On average, children were in front of a screen 4·3 d/week, with a weekly time of 195 min. The mean screen time was 43·0 (sd 40·4) min/d; before the age of 1 year, the average time was approximately 30 min and reached 58 min after 30 months. After the age of 1 year, 40 % of children moved by walking independently and 90 % after 2 years. Other children were either carried or used a stroller.
Discussion
The national Nutri-Bébé 2013 study is the fifth food consumption and eating behaviour survey conducted in children under 3 years old in France by the SFAE since 1981 with an equivalent methodology( Reference Boggio, Lestradet and Astier-Dumas 4 – Reference Fantino and Gourmet 7 ). They are the only French surveys for that age range, thus complementing the INCA surveys (Individuelle et Nationale sur les Consommations Alimentaires), which concern adults and children aged 3 years and over( Reference Lioret, Dubuisson and Dufour 12 ). The analysis of data provided by these successive surveys has helped identify public health issues regarding food and nutrition, notably included in official reports aimed at defining nutrition policy( 13 , Reference Hercberg 14 ). Changing lifestyles and the evolution of commercial products require regular information updates. Other countries such as the UK( Reference Bates, Lennox and Prentice 15 ) and Portugal( Reference Marques-Vidal, Ravasco and Dias 16 ) in Europe, the USA( Reference Fein, Labiner-Wolfe and Shealy 17 – Reference Johnson, Dohrmann and Burt 19 ) and Canada( 20 ) in North America, and fifteen different countries in Asia (Cambodia, China, India, Indonesia, Japan, Malaysia, Mongolia, Nepal, Pakistan, Philippines, Singapore, South Korea, Taiwan, Thailand, Vietnam)( Reference Song and Song 21 ) have taken the same approach. Their results cannot be directly compared with the French situation, given the different products available and lifestyles.
The Nutri-Bébé 2013 study has recruited a large cohort of children under 3 years of age, with a participation refusal rate of only 0·34 %. A total of 1184 infants and young children from 15d to 3 years old were recruited, 1035 of whom were NBF. The population size was greater than that included in previous SFAE surveys, thereby helping to increase the robustness of the current study, and fully complying with the EFSA recommendations( 8 ). In 1981, the first survey included 649 children from 0 to 24 months of age( Reference Boggio, Lestradet and Astier-Dumas 4 ); in 1989, 499 children from 0 to 18 months were enrolled( Reference Boggio and Fantino 5 ); and in 1997, 660 children from 0 to 30 months were included( Reference Boggio, Grossiord and Guyon 6 ). In 2005, 713 non-breast-fed children from 1 to 35 months were recruited( Reference Fantino and Gourmet 7 ). The inclusion number of the current survey is also notably higher than that of many other surveys that enrolled children of the same age in other countries, which have been conducted under different conditions and methods( Reference Bates, Lennox and Prentice 15 , Reference Curtin, Mohadjer and Dohrmann 18 , Reference Johnson, Dohrmann and Burt 19 , Reference Kudlova and Rames 22 – Reference Zhou, Gibson and Gibson 24 ). However, other surveys have enrolled a larger sample( Reference Fein, Labiner-Wolfe and Shealy 17 , Reference Coimbra, Ventura Santos and Welch 25 – Reference Friel, Hanning and Isaak 27 ).
Like previous French surveys and the vast majority of other studies( 13 , Reference Marques-Vidal, Ravasco and Dias 16 , Reference Fein, Labiner-Wolfe and Shealy 17 , 20 – Reference Coimbra, Ventura Santos and Welch 25 ), Nutri-Bébé 2013 is an observational cross-sectional study. To our knowledge, only one study longitudinally observed the food consumption of infants from birth to 1 year old( Reference Fein, Labiner-Wolfe and Shealy 17 ). Thanks to its robustness and recruitment based on the quota sampling method, our study can be considered a faithful representation of the mainland French population with respect to age, gender, mother’s activity, PCS of the person responsible for the family, geographic distribution and size of the urban agglomeration. The perfect comparability of the populations studied in 2013 and 2005, combined with the similarity of the methodology employed, allows us to make a historical comparative analysis. Contrary to other countries, particularly the USA( Reference Fein, Labiner-Wolfe and Shealy 17 – Reference Johnson, Dohrmann and Burt 19 , Reference Butte, Fox and Briefel 26 ), it is not allowed to disclose the ethnic origin of the population living in France. The quota sampling method has already been used in previous studies( Reference Boggio, Lestradet and Astier-Dumas 4 – Reference Fantino and Gourmet 7 ) and is considered the best option in non-probabilistic sociodemographic studies of this type, as it provides the necessary statistical power( Reference Bornstein, Jager and Putnick 28 ). A high-quality sample, with well-controlled quotas, has a negligible impact on the bias and precision of the estimates compared with simple random sampling( Reference Raab 29 ). The internal and external validity of the survey can therefore be considered satisfactory( Reference Bruemmer, Harris and Gleason 30 ). Unlike previous studies( Reference Boggio, Lestradet and Astier-Dumas 4 – Reference Fantino and Gourmet 7 ), the eleven age groups were strictly defined, thereby increasing the accuracy of age determination for key recommendation time points such as the introduction of solids( 31 , Reference Turck, Dupont and Vidailhet 32 ) and different formulas (recommendations from the Directive of the European Commission on IF and FOF)( 33 ).
As proposed by the EFSA expert group( 8 ), children were weighed specifically for the survey; this was not the case in previous studies, in which the reported weight by parents was considered sufficient( Reference Boggio, Lestradet and Astier-Dumas 4 – Reference Fantino and Gourmet 7 ). Few studies have measured children’s weights and thus have been able to provide an evaluation of intake relative to actual weight( Reference Bates, Lennox and Prentice 15 , Reference Fein, Labiner-Wolfe and Shealy 17 , Reference Zhou, Gibson and Gibson 24 , Reference Coimbra, Ventura Santos and Welch 25 ). These studies also included the report of children’s height and allowed to determine their BMI, which unfortunately could not be performed in our study. The results regarding the measured weights confirmed the normality of the study population, since 93·9 % of children included had a weight-for-age between the 3rd and the 97th percentile of the WHO Child Growth Standards( 10 , Reference de Onis, Garza and Onyango 34 ).
In terms of both sociodemographic and nutritional results, the quality of the survey is reinforced by the fact that it combined a three non-consecutive days record and two face-to-face interviews, performed before and after data collection. The good relationship established between the interviewer and the caregiver improved compliance to the study protocol as well as the relevance of the answers( 8 ). The interview was computer-assisted (CAPI), as with the British surveys that occurred between 2008 and 2012( Reference Bates, Lennox and Prentice 15 ). The investigator could thus verify the correspondence between what was reported in the food consumption diary and the labelling of the food consumed. This practice, like the use of photographs of reference portion sizes and a measuring cup, were already used in 2005( Reference Fantino and Gourmet 7 ). They are recommended for surveys conducted in Europe among pre-school children (4–6 years old)( Reference Andersen, Lioret and Brants 35 , Reference Nelson, Atkinson and Darbyshire 36 ) and are in line with the methods highlighted by the EFSA and the IFN( 8 , 9 ). No gold standard exists for the estimation of portion size. The EFSA expert group stressed the importance of using different age-appropriate tools and portion size aids to obtain best estimates for different foods. Error variability seems to be reduced when photographs and food models are used together, compared with using household measures alone( 8 ).
Data collection over three days provides a better estimate of daily intake compared with data collected in one single day( Reference Marques-Vidal, Ravasco and Dias 16 , Reference Curtin, Mohadjer and Dohrmann 18 , Reference Johnson, Dohrmann and Burt 19 , Reference Butte, Fox and Briefel 26 ). The British and Canadian surveys took place over four days( Reference Bates, Lennox and Prentice 15 , Reference Friel, Hanning and Isaak 27 ). Our complete survey was conducted over a 4-month period including much of the winter and the early spring. This made it possible to avoid the difficulties associated with variations related to changes in recommendations and trends, which may occur in surveys carried out over long periods with smaller samples( Reference Marques-Vidal, Ravasco and Dias 16 , Reference Curtin, Mohadjer and Dohrmann 18 , Reference Johnson, Dohrmann and Burt 19 ). However, apart from the consumption of home-made fruits and vegetables, it can be sustained without factual certainty that the seasons have relatively little influence on eating habits for the age groups concerned. Nevertheless, this is just a snapshot of the study population’s habits, thereby limiting the potential associations between the results obtained and a possible impact on long-term health( Reference Bruemmer, Harris and Gleason 30 ). It is of note that the majority of mothers relied primarily on instinct and personal experience, which does not prevent more than half of them from consulting a health-care professional as well, mainly the youngest mothers, the primiparas or those having a child less than 1 year old.
Breast-feeding prevalence in our survey is quite low compared with that described in other countries and even other surveys performed in France. In the ELFE Study (Etude Longitudinale Française depuis l’Enfance) based on 17 562 births in 2011, 59·5 % of the newborns were EBF and 10·2 % were PBF in the maternity ward( Reference Wagner, Kersuzan and Gojard 37 ). At 1 month of age, EBF and PBF prevalence were respectively 43·2 and 10·6 %; at 4 months, 10·0 and 33·0 %; and at 6 months, 9·9 and 10·0 %. Among 2806 infants included in the Epifane study (Épidémiologie en France de l’alimentation et de l’état nutritionnel des enfants pendant leur première année de vie) in 2012–2013, the prevalence of EBF and PBF at birth was 58·7 and 15·0 %, respectively( Reference Salanave, De Launay and Boudet-Berquier 38 ). It was respectively 21·4 and 17·8 % at 3 months, 10·5 and 12·0 % at 6 months, and 5·0 and 4·6 % at 1 year. Median duration for exclusive or predominant breast-feeding was 24 d. In any case, breast-feeding duration in France is far from the 6 months of EBF recommended by WHO.
For the formula-fed infants, there was in 2013 a trend to introduce FOF later than in 2005 and to consume more often GUM at the expense of the consumption of CM. Between 1 and 2 years of age most of the children were given GUM, and this was more frequent in the previously breast-fed children. Nearly one-third of the children above 1 year of age and two-thirds above 2 years of age consumed semi-skimmed milk.
Concerning complementary feeding, the feeding practices were consistent with the European and French recommendations( 31 , Reference Turck, Dupont and Vidailhet 32 ), since for 54 % of infants, introduction of solid foods began between 4 and 6 months, and an additional 31 % began solids in the seventh month. This was different from the 2005 results when this introduction was made more readily before 6 months, and was consistent with those of the Epifane survey( Reference Boudet-Berquier, Salanave and de Launay 39 ). Younger mothers were more prone to introduce solid foods before 4 months or after 8 months. Of more concern is the number of children who, as young as 8 months old, consumed the same food as their parents and the number of children who had meals in front of a screen.
Conclusion
The Nutri-Bébé SFAE 2013 survey adds to the series of studies conducted since 1981 on the food consumption of infants and young children living in France. Compared with previous studies, its statistical power, robustness and reliability have all improved, while maintaining a very good sociodemographic representation of children under 3 years of age living in mainland France. These qualities should make it possible to obtain an accurate analysis of the eating habits and nutritional intake in that population. Even if somewhat modified in its methodology, the data collection will allow us to assess time trends in feeding and eating practices especially by comparison with the 2005 survey. This survey highlights the low rate of breast-feeding in France but shows an improvement in the observance of the recommendations concerning the use of IF, FOF and GUM. Some progress still needs to be made, particularly concerning the excessive use of semi-skimmed milk. With regard to the introduction of complementary foods, the current recommendations are rather correctly followed. We may be challenged by the frequency of consumption of meals intended for adults and the importance of screen time in these very young children. Once established, the data will be essential for the medical and scientific community, the French and European authorities, and manufacturers specialised in nutrition for young children. These data will allow improved identification of nutritional deficits and excesses, in parallel to the analysis of behaviours and practices of parents regarding the nutritional intake of their children. Finally, the Nutri-Bébé 2013 study will provide a database to update children’s level of exposure to pesticides, additives and contaminants according to the ANSES methodology( 40 ), which has already been done on the 2005 data( 41 ).
Acknowledgements
Acknowledgements: The authors thank the families participating in the survey, who gave up their time to be interviewed, and who welcomed interviewers and nurses into their homes. They would also like to acknowledge the professionalism and commitment of interviewers who worked on the survey and were so important to the survey’s success. The authors wish to thank everyone who contributed to the survey, especially in its design and supervision. Financial support: The survey was fully funded by the SFAE (Secteur Français des Aliments de l’Enfance, 9 boulevard Malesherbes, Paris 75008, France). Conflict of interest: Y.E. is employed by TNS Sofres, and G.T., A.F. and P.H. are employed by the CREDOC. Both companies received funding from the SFAE to carry out the present study. J.-P.C. contributed as a scientific consultant and received an honorarium from the CREDOC for his participation in the survey management and the result interpretation. M.B. is employed by the SFAE. R.H. and D.T. declare that they have no competing interest. Authorship: J.-P.C. was involved in the study design, data collection, analysis and interpretation of data, as well as writing of the paper. G.T. conceived the study, participated in its design and coordination, collected the data, performed the statistical analysis and helped draft the manuscript. Y.E. and A.F. collected the data and contributed to their analysis. P.H. was involved in the study design. M.B. designed, coordinated and supervised the survey and helped draft the manuscript. R.H. participated in the design of the study and helped draft the manuscript. D.T. reviewed, edited and provided comments on drafts of the manuscript. All authors saw and approved the final version. Ethics of human subject participation: This study was conducted according to the guidelines laid down in the Declaration of Helsinki. The study was conducted by TNS Sofres, an official polling institute which fulfils the following standards and industry requirements: ESOMAR professional code of conduct and standards; ISO 20252:2012 international standard for market, opinion and social research; and the French data protection act (Loi ‘Informatique et Libertés’). TNS Sofres ensured to conduct the survey in accordance with the regulation on personal data protection and that respondents’ personal identity is withheld. Moreover, TNS Sofres appointed a data protection officer, the ‘Correspondant Informatique et Libertés’, who was the point of contact between the French data protection authority (Commission Nationale de l’Informatique et des Libertés (CNIL)) and the company. The company was thus exempted of the notification process to the CNIL as far as the data processing is concerned, which is the data protection officer’s responsibility. Given the type of survey conducted, namely a survey of consumption, and the characteristics developed above, the study did not require any opinion of the ethics committee. Verbal informed consent of parents was witnessed and formally recorded.
Supplementary material
To view supplementary material for this article, please visit https://doi.org/10.1017/S1368980017002518


