


Many high-income countries are facing an epidemic of overweight and obesity( 1 ) that starts in childhood( Reference Daniels 2 , 3 ). The National Child Measurement Programme (NCMP) shows that over a fifth of children aged 4–5 years in the UK are overweight or obese, increasing to over a third of children aged 10–11 years( 4 ). Poor diet is a core factor affecting childhood obesity( Reference Conrad and Capewell 5 ).
Globally, there is increasing evidence that the local food environment is a determinant of both diet and weight status( Reference Engler-Stringer, Le and Gerrard 6 – Reference Holsten 8 ). Among adults and children, greater access to unhealthy food outlets is associated with higher levels of overweight and obesity and poorer dietary behaviours( Reference Caspi, Sorensen and Subramanian 7 , Reference Cetateanu and Jones 9 , Reference Fraser and Edwards 10 ). However, despite a surge in studies assessing relationships between food outlet access and health outcomes in recent years, several gaps and methodological limitations exist. A recent review concluded that measuring the food environment is complicated and there is an ongoing need for further research using more robust measures( Reference Lytle and Sokol 11 ).
There is continued interest in understanding how the food environment impacts health-related outcomes, especially the risk of obesity and its contributing health behaviours( Reference Vandevijvere, Dominick and Devi 12 ). Current evidence indicates that the association between local food environment exposures and childhood dietary quality is stronger in the USA, with trends less evident in other developed countries( Reference Engler-Stringer, Le and Gerrard 6 , Reference Caspi, Sorensen and Subramanian 7 ). There are significant differences between the USA and the UK in neighbourhood design( Reference Black, Moon and Baird 13 , Reference Cummins and Macintyre 14 ) that may lead to differences in how the food environment affects the health of communities. In addition, studies among children are less abundant than those among adults despite recognition that these two populations relate differently to their food environments( Reference Brembeck, Johansson and Bergstrom 15 ). Therefore, to inform public health policy and intervention design, more UK studies among children are needed( Reference Cetateanu and Jones 16 ).
In children, the majority of studies have assessed relationships between access to food outlets and BMI( Reference Cetateanu and Jones 9 , Reference Fraser and Edwards 10 , Reference Williams, Scarborough and Townsend 17 ) as opposed to diet. In addition, studies have focused on access to one type of food outlet (usually fast-food outlets) rather than examining a range of ‘healthy’ and ‘unhealthy’ outlets. Reviews have recommended that future studies include exposure to a range of outlets( Reference Black, Moon and Baird 13 , Reference Charriere, Casey and Salze 18 ) and there is increasing acknowledgment of the need to use relative exposure measures( Reference Clary, Ramos and Shareck 19 ) (which consider an outlet type relative to all outlets in the area) in addition to absolute count measures. In 2015, a systematic review concluded that indices including multiple food outlets were most consistently associated with obesity in adults( Reference Cobb, Appel and Franco 20 ). The evidence relating to children remains limited.
The childhood food environment literature shows that residential neighbourhood food environments are more strongly associated with weight and dietary outcomes than school neighbourhood food environments( Reference Williams, Scarborough and Townsend 17 , Reference Van Hulst, Barnett and Gauvin 21 ). However, to provide a more nuanced representation of children’s daily food outlet exposure, activity space measures including both home and school are needed. Activity space can be defined as the subset of locations that an individual comes into contact with as a result of his/her daily mobility( Reference Perchoux, Chaix and Cummins 22 ). For young children, home and school represent two sites in which children typically spend the vast majority of their time( Reference Harrison, Burgoine and Corder 23 ). Activity space measures may also improve the specificity between exposure and health behaviour or health outcome( Reference Perchoux, Chaix and Cummins 22 ). Studies in adults that account for exposures from multiple locations, including both residential and non-residential settings, are more strongly associated with health outcomes than estimates based on exposures in one setting only( Reference Cobb, Appel and Franco 20 , Reference Kestens, Lebel and Daniel 24 ). To date, few published studies have used an activity space approach to assess this relationship in young children( Reference Van Hulst, Barnett and Gauvin 21 , Reference Timperio, Ball and Roberts 25 , Reference An and Sturm 26 ).
The majority of food environment studies have applied proxy dietary measures, measuring only one aspect of diet, rather than assessing overall diet quality( Reference Engler-Stringer, Le and Gerrard 6 , Reference Kirkpatrick, Reedy and Butler 27 , Reference Bornhorst, Huybrechts and Ahrens 28 ). Measuring dietary quality provides a more comprehensive understanding of overall patterns of dietary behaviour and is preferable to single nutrient or food measures when quantifying non-communicable disease risk( Reference Jacques and Tucker 29 , Reference Hu 30 ).
The present study aimed to address the limitations of the current evidence. Its aims were to: (i) examine the relationship between counts of supermarkets, healthy specialty stores (greengrocers, health food stores, farm shops and butchers), fast-food outlets (chains and takeaway outlets) and total number of retail and fast-food outlets in children’s combined residential and school neighbourhood with their dietary quality at 6 years; and (ii) explore the relationship between a relative measure of healthy outlets, as a proportion of total outlets, in children’s combined residential and school neighbourhood with their dietary quality at 6 years.
Materials and methods
Participants
Participants were children of women participating in the Southampton Women’s Survey (SWS). The SWS is a prospective cohort of 12 583 non-pregnant women recruited between 1998 and 2002 when aged 20–34 years. Assessments of smoking status and highest educational qualification were made at study entry for all participants. Each woman’s height and weight were measured by trained research nurses and used to derive BMI. Those who subsequently became pregnant were followed up; the growth and development of the SWS children were assessed periodically during infancy and childhood, and the children continue to be followed-up. The study was conducted according to the guidelines laid down in the Declaration of Helsinki and all procedures involving participants were approved by the Southampton and South West Hampshire Local Research Ethics Committee. Written informed consent was obtained from all parents of participants. A full description of the SWS is published elsewhere( Reference Inskip, Godfrey and Robinson 31 ).
The present study used data from the 6-year follow-up assessment for children conducted between 2007 and 2014, and mother’s SWS study entry assessment data. At the 6-year follow-up, height (in centimetres) was measured using a portable stadiometer (Leicester Height Measure; Seca). Child’s diet over the previous three months was assessed using an interviewer-administered eighty-item FFQ completed by each child’s parent or guardian. Average frequency of consumption (ten options from never, to number of times per day) of all listed foods was recorded. Daily volumes, types and amounts of milks were recorded as well as any sugar added to food. A prudent diet score (dietary quality score) was calculated for each child. The FFQ items were categorised into fifty-one groups based on similarity of type of food or nutrient composition. The reported standardised frequency of each group was then multiplied by corresponding coefficients identified from a principal components analysis and the results summed. The dietary quality scores were standardised to have a mean of 0 and sd of 1. Higher scores represented better dietary quality and a dietary pattern consistent with the dietary recommendations, characterised by frequent consumption of fruit, vegetables and fish. A full description of FFQ delivery and analysis, as well as creation of the dietary quality score, has been published elsewhere( Reference Okubo, Crozier and Harvey 32 ). School and home postcodes were also collected at the 6-year assessment. Home postcode was used to determine the level of neighbourhood deprivation for each child using quintiles of the 2010 English Index of Multiple Deprivation.
Exposure area: activity space (home and school)
The exposure area applied was an activity space around home and school. This method involves drawing boundaries around a number of individualised points to create activity spaces( Reference Chaix, Merlo and Evans 33 ). An activity space for each child was created using geocoded home and school postcode centroids as midpoints buffered by an 800 m radius. If these home and school boundaries overlapped, the overlapping area was merged to ensure that food outlets in these areas were not duplicated. The 800 m buffer has been frequently applied in the literature( Reference Burgoine, Alvanides and Lake 34 ) and corresponds approximately to a 10 min walk for children( Reference Williams, Scarborough and Townsend 17 , Reference Williams, Scarborough and Matthews 35 ). Euclidean distance (straight line) was used to buffer locations instead of road network distance because the two measures are highly correlated at 800 m in urban settings( Reference Burgoine, Alvanides and Lake 34 ). The decision not to measure exposure in home and school environments separately was taken due to the urban setting and the fact that fewer than 100 children had activity spaces within which their home and school address did not overlap.
Exposure variable: food stores
Food environment data were collected as part of the process evaluation of the Southampton Initiative for Health (SIH)( Reference Barker, Baird and Lawrence 36 ). A list of 1682 food retail stores and fast-food outlets and their postcodes in six council boundaries (Southampton, Eastleigh, Fareham, Gosport, Havant, Portsmouth) within Hampshire, UK, was compiled in July and August 2010 using information from each Council’s Food Safety Register. We used the directories Yellow Pages and yell.com to supplement the local authority registers in an effort to obtain a complete picture of food outlet locations across the study area. Between July 2010 and June 2011, trained fieldworkers ‘ground-truthed’ the study area and confirmed the existence and type of all food retail stores and takeaway outlets; 245 were no longer present and 350 additional outlets were identified, making a total of 1787 outlets in the study area at the time of data collection. A great proportion of the study area was assessed; however, not all streets within the study area were checked for food outlets. It is therefore possible that some food outlets were missed. The food outlets were geocoded using ArcGIS version 10.1 (2012; ESRI, Redlands, CA, USA) and data about the location of food outlets were overlaid on to each child’s home and school activity space.
Exposure variables included the count of three categories of outlets: (i) supermarkets, including high-range, large, discount and small supermarkets; (ii) fast-food outlets, including fast-food chains and takeaway outlets; and (iii) healthy specialty stores, including greengrocers, health food stores, farm shops and butchers. These categories are similar to those used in previous research( Reference Black, Ntani and Inskip 37 , Reference Rundle, Neckerman and Freeman 38 ) and the healthy specialty category included outlets aligned with previous work( Reference Thornton and Kavanagh 39 ). In addition to the total counts, a relative measure was created, representing the number of healthy food outlets as a proportion of all food retail stores and fast-food outlets with each child’s activity space which included convenience stores, newsagents, bakers, confectioners and ‘world’ food stores as well as supermarkets, healthy specialty stores and fast-food outlets.
Statistical analysis
Participants’ characteristics were summarised using means and sd for normally distributed continuous variables, medians and interquartile range for non-normally distributed continuous variables, and numbers and percentages for categorical variables.
All analyses investigating the research questions were cross-sectional. Diet scores were standardised; thus the units of the outcome measure are sd. Multilevel linear regression models were used to assess the relationship between the outcome measure, namely diet score, and five predictor variables: (i) count of supermarkets; (ii) count of healthy specialty stores; (iii) count of fast-food and takeaway outlets; (iv) total number of outlets; and (v) relative measure of healthy outlets as a proportion of total food outlets. These multilevel models accounted for clustering within schools (ρ=0·05–0·06). The count models were not mutually adjusted due to the high correlation between fast-food outlets and healthy specialty stores (r=0·8).
We used the directed acyclic graph approach( Reference Greenland, Pearl and Robins 40 ) to select suitable confounders for linear regression models. Potential confounding variables considered for the directed acyclic graph comprised age the child was last breast-fed, maternal BMI, child’s height, child’s sex, maternal educational attainment and home neighbourhood deprivation. Ethnicity was not considered to be a confounder because of little variability: 96 % of the women participants who had a live singleton birth were white and 94 % of their children were also white. A directed acyclic graph identifies that a variable is a confounder when it is causally associated with at least two variables already included in the model. The directed acyclic graph for the present study identified two confounding variables that should be included in our analyses: mother’s educational attainment and level of neighbourhood deprivation (see online supplementary material, Supplemental Fig. 1). Results are presented for the adjusted and unadjusted models.
All statistical analyses were conducted using the statistical software package Stata version 14.1. Geoconvert™ software was used to geocode home, school and food outlet addresses, and ArcGIS version 10.3.1 was used to create the activity spaces and food outlet exposure variables.
Results
Characteristics of participants and food environment exposures
The study included 1173 children (590 boys and 583 girls) from the SWS 6-year assessment whose home and school were both located in the food environment exposure area. Table 1 presents the characteristics of the children and their mothers. Girls were slightly shorter than boys and had better mean diet scores. Mothers had a median pre-pregnancy BMI of 24·3 (interquartile range 21·9–27·5) kg/m2, which is at the higher end of the healthy weight range. Approximately 14 % of mothers smoked during pregnancy, and 60 % had qualifications higher than GSCE or equivalent (at 16 years of age). Most children lived in neighbourhoods of medium-level deprivation (70 %), with 17 % in the least deprived quintile and 13 % in the most deprived quintile.
Table 1 Characteristics of participating children and their mothers, by child’s sex, Southampton Women’s Survey, Hampshire, UK, 2007–2014
IQR, interquartile range; GCSE, General Certificate of Secondary Education.
Figure 1 shows the distribution of supermarkets, healthy specialty stores and fast-food outlets in children’s activity spaces. Nine per cent of children had no supermarket in their activity space and 27 % had no healthy specialty store. More than half (52 %) of the children were exposed to ≥10 fast-food and takeaway outlets in the area surrounding their home and school. Three children in the study had ≥50 fast-food and takeaway outlets in their activity spaces.
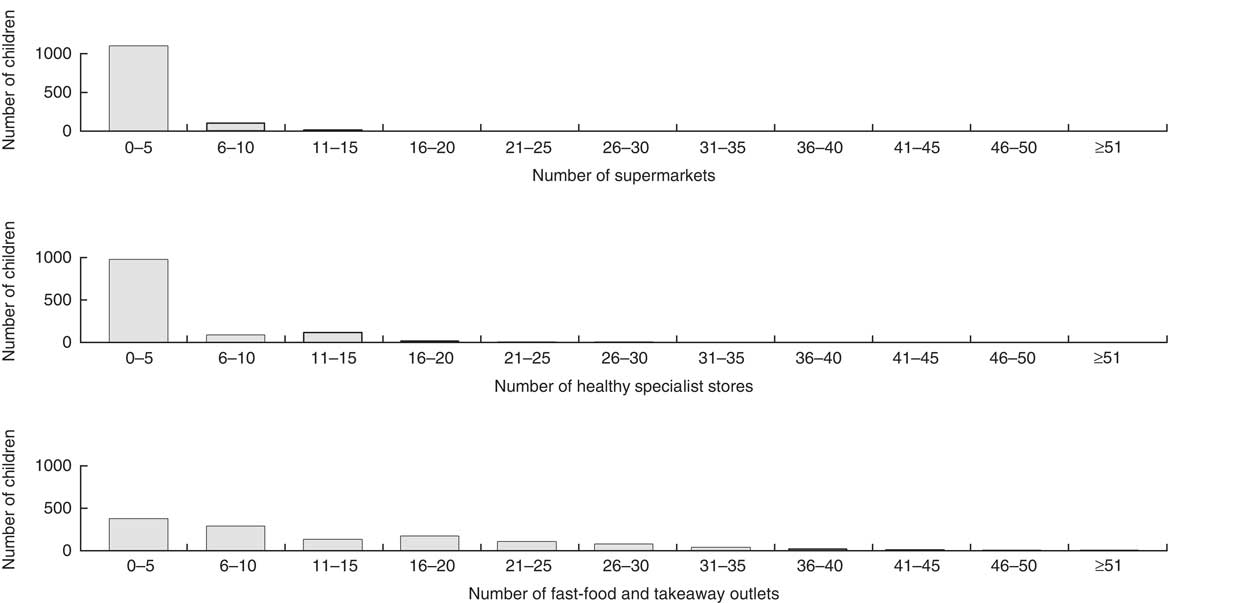
Fig. 1 Frequency of different outlet types within home and school activity spaces of 6-year-olds, Southampton Women’s Survey, Hampshire, UK, 2007–2014
Relationship between food environment and dietary quality
Table 2 shows that increasing counts of healthy specialty stores in children’s activity spaces were associated with better diet scores. A greater number of healthy specialty stores was associated with higher diet score in both the univariate multilevel linear regression model (β=0·025 sd/store, 95 % CI 0·007, 0·044; P=0·008) and in the model adjusted for educational attainment and level of neighbourhood deprivation (β=0·024/store, 95 % CI 0·009, 0·040; P=0·002; Fig. 2). Children with an additional two healthy specialty stores around home and school had dietary quality scores 0·04 sd greater than other children. This difference could for example be achieved by eating approximately one extra serving of green vegetables each week.
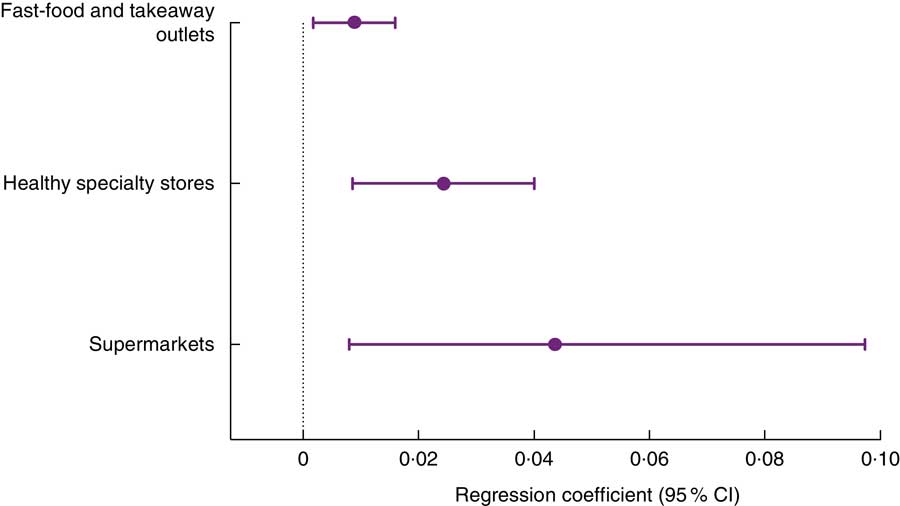
Fig. 2 Multilevel regression coefficients, with their 95 % CI represented by horizontal bars, expressing the relationship between dietary quality at 6 years and different food outlet types within home and school activity space after adjustment for confounding variables, Southampton Women’s Survey, Hampshire, UK, 2007–2014
Table 2 Multilevel regression analysis assessing the relationship between food environment exposures and dietary quality among 6-year-olds, Southampton Women’s Survey, Hampshire, UK, 2007–2014
* Confounding variables included: maternal educational attainment and level of neighbourhood deprivation.
Increasing counts of supermarkets, fast-food outlets and total number of retail and fast-food outlets were also positively associated with better diet scores, but only in the adjusted multilevel models (β=0·044/store, 95 % CI 0·008, 0·079, P=0·017; β=0·009/outlet, 95 % CI 0·002, 0·016, P=0·014; β=0·005/outlet, 95 % CI 0·001, 0·007, P=0·005, respectively). The effect sizes for total outlets and fast-food outlets were smaller than for healthy specialty stores and supermarkets.
The relative number of healthy outlets as a proportion of total outlets showed a strong positive association with diet score in the unadjusted multilevel linear regression model (β=0·068 sd/10 % increase in healthy outlets as a proportion of total outlets, CI 0·018, 0·117, P=0·008). This effect weakened after adjusting for educational attainment and neighbourhood deprivation (β=0·037 sd/10 % increase, 95 % CI −0·064, 0·081, P=0·095).
Discussion
Summary of findings
To our knowledge, the present study is the first to examine how both absolute and relative exposure measures of different types of food outlets in activity spaces relate to overall dietary quality among primary school-aged children. We found that children were exposed to more unhealthy than healthy outlets in their home and school environments. Greater access to healthy specialty stores including greengrocers and health food stores was consistently associated with better dietary quality. Greater access to supermarkets and fast-food outlets was also associated with better diet after adjustment for socio-economic demographics, suggesting that exposure to more food outlets per se was better for diet. However, consideration of healthy outlets as a proportion of total outlets showed a tendency for greater exposure to more healthy food outlets and better dietary quality.
Comparison with previous research
Previous research examining the relationship between the local food environment and children’s health outcomes has largely focused on weight and body composition, rather than diet. This may be because large data sets such as the UK’s NCMP provide data on BMI for very large numbers of children at two time points (age 4–5 and 10–11 years) during primary school. The challenges of dietary assessment, as opposed to measuring weight or BMI, may indicate why diet has been considered less frequently than body composition in the childhood food environment literature( Reference Caspi, Sorensen and Subramanian 7 , Reference Kirkpatrick, Reedy and Butler 27 ). Yet diet is a key determinant of weight status and empirical evidence exploring the relationship between diet and spatial access to different food outlet types is paramount to understanding the complexity of how the food environment influences obesity in children.
Our findings provide empirical evidence for a relationship between greater access to healthy outlets such as greengrocers, which sell predominantly healthy minimally processed food products, and better dietary quality among younger primary school-aged children. This finding is consistent with previous research from the UK which has shown a range of health outcomes to be associated with increased local access to healthier food outlets among younger children. One study found that children with one or more greengrocers or supermarkets around their home had lower fizzy drink intake and percentage body fat than children with no access to these outlets( Reference Jennings, Welch and Jones 41 ). Another study showed that having greater access to healthy specialty stores in the home neighbourhood was associated with better bone health in children aged 4 years( Reference Vogel, Parsons and Godfrey 42 ). Furthermore, a large national study observed that higher counts of healthy specialty stores, supermarkets and cafés in the home neighbourhood related to a lower prevalence of overweight and obesity among young children (aged 4–5 years) but not older children (aged 10–11 years)( Reference Cetateanu and Jones 9 ). Research from Australia involving 5–6- and 10–12-year-olds identified no association between fruit and vegetable intake and access to greengrocers around the home but did observe that lower fruit intake related to greater access to fast-food outlets and convenience stores( Reference Timperio, Ball and Roberts 43 ). These Australian findings differ from the UK evidence, but it may be that the larger numbers of children aged 10–12 years involved in the Australian study were driving the overall results and that differential age effects may have been observed had those analyses included younger children.
Collectively, the results of the studies described above indicate that food retailing influences the dietary patterns of children differently depending on their age. Older children are likely to have greater independent purchasing opportunities than younger children whose diets are more likely to be under greater influence of parental food decisions( Reference Engler-Stringer, Schaefer and Ridalls 44 ). Parents may be more inclined to shop at conveniently located greengrocers or farm shops as part of household grocery shopping habits, while older children may have pocket money and greater independence than younger children, enabling them to purchase less healthy food items from convenience stores or fast-food outlets for immediate consumption. Current strategies to improve the food retail landscape are focused predominantly on reducing access to fast-food and takeaway outlets( 45 ). However, it may be pertinent to also explore opportunities to increase access to healthy specialty stores, which have diminished in number in recent years( Reference Burgoine, Lake and Stamp 46 ), in order to improve the diets and weight status of younger children.
The results of the current study showed that, like healthy specialty stores, higher numbers of supermarkets and fast-food outlets in home and school neighbourhoods were associated with better dietary patterns. These findings could indicate that increased access to food outlets per se may improve diet. However, they could also be indicative of collinearity of different types of food outlets, which often are co-located in retail precincts. Empirical evidence from the USA showed that because fast-food outlets and banks are often co-located in areas of high commercial density, both access to fast-food outlets and access to banks were independently positively associated with obesity prevalence( Reference Bader, Schwartz-Soicher and Jack 47 ). Having greater access to areas of high commercial density may enhance behavioural and health outcomes through mechanisms of increased employment and increased concentration of community services and resources( Reference Cummins, Macintyre and Davidson 48 ). The use of relative measures of food outlet exposure is a methodological strategy that endeavours to somewhat account for outlet co-location and overcome issues of multicollinearity occurring during statistical analyses( Reference Clary, Ramos and Shareck 19 ). Our results for the relative measure showed that more healthy outlets relative to the proportion of total outlets in home and school environment was associated with better dietary quality, although the relationship weakened after adjustment for socio-economic variables. These results are similar to a Canadian study which found that an increased ratio of ‘unhealthful’ to ‘healthful’ outlets in the school neighbourhood only was weakly associated with higher intake of sugar-sweetened beverages and lower daily fruit and vegetable intake( Reference Van Hulst, Barnett and Gauvin 21 ). The results of the relative measure and the larger effect sizes for associations between diet and exposure to supermarkets and healthy specialty stores than fast-food outlets identified in the current study suggest that more can be done to improve the balance of healthy and unhealthy food outlets in retail precincts.
Supermarkets sell a large variety of both healthy and unhealthy products ranging from fresh fruit and vegetables to ultra-processed foods that are high in saturated fat, sugar and salt, making it difficult to classify supermarkets as healthy or unhealthy( Reference Caspi, Sorensen and Subramanian 7 ). Our findings are consistent with findings from a previous UK study among children aged 9–10 years which found that greater density of supermarkets was associated with an increased intake of both healthy and unhealthy foods( Reference Skidmore, Welch and van Sluijs 49 ). More recent UK research has also shown that the volume of unhealthy food product sales from a supermarket within the home neighbourhood was associated with prevalence of overweight and obesity among children aged 4–5 and 10–11 years( Reference Howard Wilsher, Harrison and Yamoah 50 ). Future research considering both the density of different types of food outlets and the marketing activities within supermarkets is necessary to better understand the multiple environmental determinants of children’s diet and weight status( Reference Caspi, Sorensen and Subramanian 7 ).
Strengths and limitations
Two main strengths of the present study are the ‘activity space’ approach covering both home and school environments, and the use of absolute (count) measures as well as a relative measure of access to a range of food outlets. Relative measures are more comprehensive, but absolute measures help policy makers and practitioners interpret results( Reference Clary, Ramos and Shareck 19 ). A further strength of the study was the use of an FFQ administered by trained research nurses that enabled calculation of an overall measure of children’s dietary quality rather than the proxy dietary measures seen in much of the literature. The focus on younger children in the UK is a further strength because food environment research has focused predominantly on adults and adolescents and has mainly come from the USA.
The study also has some limitations, many of which are common to research assessing food outlet access. Measuring dietary quality accurately is challenging and response bias in FFQ is possible. However, interviewer-administered questionnaires have generally shown greater accuracy than self-administered questionnaires( Reference Cade, Burley and Warm 51 ). FFQ capture data from a higher proportion of the population than other dietary measures, thus increasing the likelihood of a more representative sample. The study was observational and cross-sectional in design and results therefore could be due to residual confounding. However, a directed acyclic graph approach was used to identify appropriate confounding variables and adjustments made accordingly (Supplemental Fig. 1). Dietary data were collected at a different time from the food outlet data and it is therefore possible that the number and location of food outlets may not be an accurate representation for some children. However, this is a recognised limitation of much food environment research( Reference Charriere, Casey and Salze 18 ). The sample comes from a pre-conception cohort study where attrition over time means the sample may not be entirely representative of children aged 6 years in the UK.
Geographical analysis using GIS (geographic information system) software has recognised limitations, including assumptions made about food choices being primarily determined by people’s proximity to food outlets. In addition, it does not account for factors such as taste preferences, social norms or affordability( Reference Lytle and Sokol 11 ). While the geocoding of addresses can also introduce bias, very few locations were not matched in the present study (<3 %) and this small number is most likely due to the overlap between the study period and the Geoconvert data (both 2011). The use of GPS (Global Positioning System) technology might have allowed for a more accurate measure of food environment exposure, but the use of such measures is still in its infancy and poses a number of difficulties, not least technical challenges including signal loss, delay in acquiring satellite signal, precision of the device, battery power, or participants forgetting to switch the device on( Reference Cetateanu and Jones 16 , Reference Thornton, Pearce and Kavanagh 52 ). These are perhaps reasons why very few food environment studies to date have used GPS technology, especially in young children.
Public health implications
The present study contributes to the empirical evidence supporting government action to improve the nutritional quality of food outlets that children have access to in their home and school environments in order to improve their diets and health. In the UK, the National Planning Policy Framework includes the requirement for planning departments to promote healthy communities, taking into account and supporting local Joint Health and Wellbeing Strategies( 53 ). Outcomes identified in the Public Health Outcomes Framework include a specific indicator about excess weight in 4–5- and 10–11-year-olds( 54 ), giving local public health teams the opportunity to work strategically with planning and environment colleagues in local authorities to meet these joint objectives.
Prompted by the guidance in 2014 from Public Health England and the Local Government Association, an increasing number of local authorities are responding by introducing planning laws to ban outlets selling hot takeaway foods within 400m of schools as well as placing general restrictions on the clustering of takeaway outlets( 55 ). This recommendation has not been implemented in the study area. The findings of our study support action to increase access to healthy food outlets, especially healthy specialty stores such as greengrocers, in both home and school environments. Financial constraints on local authorities may prevent the introduction of such policies or laws. However, robust evaluation of these policies, to demonstrate health and/or financial benefits from making changes, or support from central government grants could provide further impetus for councillors to take action. A common-sense approach, implemented over a period of time, could allow for increased access to stores selling predominantly healthy foods.
Recent reviews indicate that more longitudinal evidence is needed and that more attention needs be given to the reliability and validity of food environment exposure measurement tools( Reference Lytle and Sokol 11 , Reference Gebremariam, Vaque-Crusellas and Andersen 56 ). In addition, qualitative research and community-based methods with children and families would enhance our understanding of how children interact with their local food outlets and could help them to advocate for changes to their local food environment( Reference Sheats, Winter and Romero 57 ). Building knowledge of the different accessibility issues for younger and older primary school-aged children as well as adolescents could offer additional support for action by local authorities to improve the imbalance in the current retail food environment.
Conclusion
Our findings suggest that the food environment around home and school to which young children are exposed is associated with their diet quality, with access to greater numbers of all food outlets being associated with better diet quality. However, the effect size for healthy outlets is greater than for other outlet types, suggesting there is an opportunity for local authorities to use their powers to increase the numbers of healthy stores that families with young children have access to. Further evidence from intervention, longitudinal and qualitative research is needed to support the case for action.
Acknowledgements
Acknowledgements: The authors are grateful to the mothers and children who participated in the SWS, and thank the dedicated team of research nurses and ancillary staff for their contributions to the study. They also thank Miss Jamie Lawrence for her assistance ground-truthing the neighbourhood food environment and Ken Cox and Vanessa Cox for computing support. Financial support: This work was supported by grants from the Medical Research Council; British Heart Foundation; Arthritis Research UK; Dunhill Medical Trust; Food Standards Agency; National Osteoporosis Society; International Osteoporosis Foundation; NIHR Southampton Biomedical Research Centre, University of Southampton and University Hospital Southampton NHS Foundation Trust; and the European Union’s Seventh Framework Programme (FP7/2007-2013), project EarlyNutrition (grant agreement number 289346). C.V. was supported by a National Institute for Health Research (NIHR) Doctoral Research Fellowship. The National Health Service, the NIHR, the Department of Health and other funders had no role in the design, analysis or writing of this article. Conflict of interest: M.B., C.V., S.C., D.L. and S.R. have no conflicts of interest to declare. J.B. has received grant research support from Danone Nutricia Early Life Nutrition; however, the study in this manuscript is not related to this relationship. K.G. has received reimbursement for speaking at conferences sponsored by companies selling nutritional products and is part of an academic consortium that has received research funding from Abbott Nutrition, Nestec and Danone. C.C. has received consultancy, lecture fees and honoraria from AMGEN, GSK, Alliance for Better Bone Health, MSD, Eli Lilly, Pfizer, Novartis, Servier, Medtronic and Roche. While not directly receiving the funds herself, members of H.I.’s team have received funds from Abbott Nutrition, Nestec and Danone. Authorship: M.B. and C.V. conceived the study and wrote the first draft of the manuscript. H.I., S.R., K.G. and C.C. participated in the design and management of the SWS, oversaw data collection and helped draft the manuscript. M.B. and C.V. cleaned the 6-year dietary data and school data. C.V. collected and cleaned the food environment data. D.L. provided methodological advice and conducted the ArcGIS analyses. M.B. and S.C. conducted the data analysis in discussion with C.V. All authors read and approved the manuscript. Ethics of human subject participation: This study was conducted according to the guidelines laid down in the Declaration of Helsinki and all procedures involving participants were approved by the Southampton and South West Hampshire Local Research Ethics Committee. Written informed consent was obtained from all parents of participants. Data from this study cannot be made openly available because of ethical concerns about the potential to identify individuals through demographic and multiple postcode information within the data set. Postcode denotes a very small geographical area in the UK. These postcode variables cannot be removed as they are fundamental to the development of the exposure variables. The data set can be made available upon request, subject to appropriate approvals. Researchers wishing to use the data can make a formal application to the Southampton Women’s Survey Oversight Group by emailing mrcleu@mrc.soton.ac.uk. Subject to approval that the intended purpose is compatible with the study’s ethical requirements and formal agreements regarding confidentiality and secure data storage being signed, the data would then be provided.
Supplementary material
To view supplementary material for this article, please visit https://doi.org/10.1017/S1368980017002075


