


Studies indicate that stunting is highly prevalent in developing countries undergoing nutritional transitionReference Popkin, Richards and Montiero1, Reference Mukuddem-Petersen and Kruger2. Stunting is defined as height-for-age below the 5th percentile on the Centers for Disease Control/World Health Organization (WHO) reference growth charts or a height-for-age Z-score (HAZ) of − 2.0 standard deviation (SD) or less, and is traditionally used as an indicator of nutritional status3, Reference Lewit and Kerrebrock4. It should be noted that reasons for any given growth impairment may be complex. The literature suggests a complex interaction of nutritional, environmental and socio-economic factorsReference Allen5, but other contributing factors include chronic or recurrent infectionsReference Mukuddem-Petersen and Kruger2. Stunted children tend to gain more fat than their non-stunted counterparts during the adolescent growth phaseReference Mukuddem-Petersen and Kruger2, Reference Martins, Hoffman, Fernandes, Nascimento, Roberts and Sesso6, Reference Jinabhai, Taylor and Sullivan7, but on the other hand it is known that in addition to both nutritional habits and puberty, the individual's genetic make-up also plays a role in this phenomenon.
Despite it being known that obesity is related to unbalanced energy intake and energy expenditure, there is a paucity of data about energy expenditure and habitual physical activity (PA) of black adolescent children, especially those who are stuntedReference Hoffman, Sawaya, Coward, Wright, Martins and de Nascimento8. PA in itself includes a spontaneous component, such as fidgeting, sitting, standing and walking; an obligatory component, such as occupation, household and daily living activities; and a voluntary component, such as participation in sportsReference Levine, Scheleusner and Jensen9. Childhood stunting has been implicated as a factor contributing to high rates of adult obesity in developing countriesReference Popkin, Richards and Montiero1. Recently evidence has been accumulating that stunting in children is accompanied by fat deposition especially in the abdominal region, which may predispose them to obesity in adulthoodReference Kruger, Margetts and Vorster10. The aim of the present study was to assess the associations between physical development, body composition and habitual PA in stunted and non-stunted adolescent children from a township in the North West Province of South Africa.
Methods
Study design and subjects
This cross-sectional research design forms part of the multidisciplinary Physical Activity in Youth (PLAY) study carried out on a group of high-school children in the North West Province of South Africa in 2003. Two schools were purposefully selected from a total of five schools, because they are situated in those areas in the township where most stunted children were likely to be found. The selection of the schools was carried out bearing the distance between the two in mind so as to avoid spilling over from the experimental school to the control school. Grade 8 children in the two township schools were invited to participate in the study. The aims and procedures of the study were explained to both the children and their parents, who subsequently signed informed consent forms before the children could take part in this study. The school principals also gave permission for the study to be undertaken at their schools, while the study protocol was approved by the Ethics Committee of the North-West University.
Three-hundred and eighteen out of a total of 336 black grade 8 adolescents aged 12–18 years gave consent to participate in the study and were present on measurement days. Of these, complete datasets for 313 (134 boys and 179 girls) representing 93.2% of the initial available group were included in this study. The five exclusions were due to missing data on some of the variables analysed or subjects being older than 18 years.
Anthropometric measurements
All anthropometric measurements were done according to the standard procedures described by the International Society for the Advancement of KinanthropometryReference Norton and Olds11. Anthropometric measurements of the boys and girls were performed separately in private rooms. Weight was measured on a portable electronic scale (Precision Health Scale; A&D Company) to the nearest 0.1 kg. Height was measured to the nearest 0.5 cm with a stadiometer (IP 1465; Invicta), with the subjects standing upright with their heads in the Frankfort planeReference Norton and Olds11. Body mass index (BMI) was calculated as weight divided by height squared (kg m− 2) and the subjects classified according to the age- and sex-adjusted BMI cut-offs for overweight and obesity described by Cole et al. Reference Cole, Bellizzi, Flegal and Dietz12. HAZs were calculated using EPIINFO 2002 software, version 2 based on the WHO criteria13.
Circumferences were measured with the cross-hand technique, with the tape at right angles to the body segment that was being measured and with no indentation of the skinReference Cole, Bellizzi, Flegal and Dietz12. The waist circumference was measured to the nearest 0.1 cm with a 7 mm wide flexible steel tape (Lufkin; Cooper Tools), at the midpoint between the lower rib margin and the iliac crest; the hips were measured to the nearest 0.1 cm at maximum extension of the buttocks. Waist-to-hip ratio was calculated from waist and hip circumferences. Mid-upper arm circumference (MUAC) was measured with the same tape at the midpoint between the acromion process of the scapula and the olecranon process of the ulna. Triceps skinfold (TSF), subscapular skinfold (SSF), calf and supraspinal skinfolds were measured to the nearest 0.5 mm using a Harpenden calliper. The anthropometric measurements were conducted by trained Level 1 Anthropometrists. The Pearson product moment correlations (r) were used to test for the reliability for each anthropometric variable. The mean intra-tester values for anthropometric components ranged from r = 0.89 to r = 0.92.
Body composition assessment
Body volume was evaluated by air displacement plethysmography, and weight by the BODPOD scale (Life Measurement, Inc.). Measurements were performed according to the manufacturer's instructions and recommendations, with each subject wearing a tight-fitting swimsuit and swim cap Reference Dewit, Fuller, Fewtrell, Elia and Wells14, 15. The BODPOD body composition system is a reliable and valid method which makes use of the basis of total body density to determine the amount of body fat and lean body massReference Fields16, Reference Pompei17. Fat mass and percentage fat mass were calculated by using the equation of Siri (1993) for comparison between normal and overweight subjects, and the Brozek (1966) equation for comparison between underweight and obese subjectsReference Lohman18, Reference Roche, Heymsfield and Lohman19.
Maturity
Sexual maturity was assessed by using the five-stage Tanner scale for breast development in females and for pubic hair in malesReference Tanner20. Based on their stage of development, the children were grouped into three categories: those in stages I and II, those in stages III–IV and those who had already reached stage V.
Physical activity and demographic factors questionnaires
The Previous Day Physical Activity Recall (PDPAR) questionnaire, compiled by Trost et al. Reference Trost, Pate, Ward, Saunders and Riner21, was administered by trained fieldworkers who recorded events for the previous weekday and one weekend day's PA. Each child was asked to give information regarding the activities he/she performed from 07.00 to 22.00 hours. This questionnaire has been validated and used in the assessment of PA of children from various ethnic groupsReference Weston, Petosa and Pate22. The reported activities were coded and each assigned a literature-based metabolic equivalents (METs) valueReference Ainsworth, Haskell, Leon, Jacobs, Montoye and Sallis23, of which the total was calculated for a weekday and weekend day. Demographic factors were assessed by a validated structured questionnaire which was administered by trained fieldworkers.
Statistical analyses
The data were processed with the aid of the computer program Statistica v.7 for Windows24. Descriptive statistics (means, SDs, and maximum and minimum values) summarised the data. Pearson's correlations were computed to assess associations between the variables. Depending on the distribution of data, comparisons between two independent groups were conducted using Mann–Whitney or Student t-tests. Analysis of variance was used to test for differences between three or more groups. The χ2 test was performed to assess differences between proportions.
Results
Table 1 presents demographic characteristics of the children. Fifty-four per cent of the adolescents stayed in brick houses and the other half resided in substandard houses (i.e. shacks, pre-fabricated/wood or traditional mud houses). Though from different sources, the children had access to clean water and 75% had flush toilets, with the remainder still using less hygienic types of toilet. Furthermore, a large percentage (95%) of the adolescents' households had access to electricity and electrical appliances such as a refrigerator (79%) and television (87%). Hence this shows that the area does not reflect a typical poor rural community in South Africa.
Table 1 Demographic characteristics of adolescents in the North West Province (n=313)

Table 2 presents comparison of age, Tanner stage, anthropometric characteristics and PA in stunted and non-stunted children. No significant age difference between non-stunted and stunted children was observed. Of the 313 children who participated in the study, 16.3% were stunted; of these a significantly higher proportion of boys were stunted than girls (21.6 vs. 12.3%; χ2 = 4.91, P = 0.027). When the children's BMI in the present study was categorised according to the age- and sex-specific BMI cut-off points developed by Cole et al. Reference Cole, Bellizzi, Flegal and Dietz12, 7.3% were found to be overweight and 1.3% obese. Due to the small numbers of obese children, both overweight and obese children were treated as one group. Of these obese children, more girls were overweight/obese than boys (13.4 vs. 1.6%, respectively; Yates corrected χ2 = 7.42, P = 0.006). In the stunted children, however, only four were overweight/obese, making up 7.8% of the stunted group, and all were girls, comprising 2.2% of the total girls.
Table 2 Comparison of Tanner, anthropometric characteristics and physical activity of stunted and non-stunted adolescent children by gender
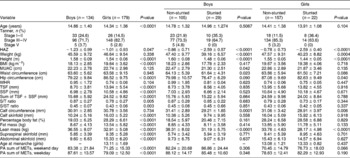
HAZ – height-for-age Z-score; BMI – body mass index; MUAC – mid-upper arm circumference; WHR – waist-to-hip ratio; TSF – triceps skinfold SSF – subscapular skinfold; S/T ratio – subscapular/triceps skinfold ratio; S/ST ratio – subscapular/subscapular + triceps skinfolds ratio; PA – physical activity; MET – metabolic equivalent.
The skinfolds ratios as measures of fat patterning showed no significant differences between the stunted and non-stunted children. Non-stunted children, however, exhibited significantly higher circumferences (MUAC, calf, waist and hip) than stunted children. Furthermore, in the non-stunted children, fat mass and percentage body fat were also higher. With regard to PA, in general stunted children were more active than their non-stunted counterparts. When the children were classified into Tanner stages of developments, stunted children were found to be highly concentrated at stages I–II and none were in stage V; on the other hand, non-stunted children were mainly concentrated at stages III–IV and with some already at stage V.
Looking at gender differences, boys were the more active group both during the week and on weekends (Table 2). Boys were more involved in tougher household chores such as gardening, and a significantly higher percentage of them were involved in sporting activities. Girls, on the other hand, were more involved in household chores such as cooking, washing dishes, cleaning and doing the laundry (Table 3). In boys, those who were not stunted had significantly higher values for MUAC, waist and calf circumferences as well as lean mass, whereas in girls those who were not stunted had higher hip and calf circumferences as well as lean mass. Though not statistically significant, stunted girls tended to be more active than their non-stunted counterparts on weekends (Table 2).
Table 3 Gender differences in physical activities undertaken by the adolescent children during weekdays and weekends
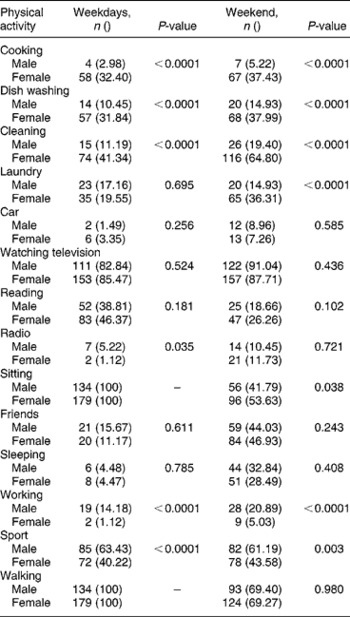
With respect to various PAs in boys during weekdays, more of the stunted boys performed household chores than their non-stunted counterparts (27.58 vs. 10.48%; χ2 = 4.15, P = 0.032) and over weekends a higher proportion of non-stunted boys tended to sleep during the day as opposed to the stunted boys (34.14 vs. 17.24%; χ2 = 4.08, P = 0.043). Conversely, stunted girls were more involved in sport during weekdays than non-stunted girls (68.18 vs. 36.31%; χ2 = 6.88, P = 0.008), whilst non-stunted girls did more cleaning (43.95 vs. 22.73%; χ2 = 13.82, P = 0.0002). Both during weekdays and over weekends a larger proportion of non-stunted girls watched television compared with stunted girls (72.73 vs. 87.26%; χ2 = 3.28, P = 0.070 and 72.73 vs. 89.81%; χ2 = 3.76, P = 0.034 on weekdays and weekends, respectively).
Subdividing the children into their various Tanner stages, differences in HAZ were found between Tanner stages I–II and III–IV, I–II and V, and III–IV and V, while with respect to BMI, differences were observed between stages I–II and III–IV, and I–II and V (Fig. 1). Lean mass showed significant differences amongst all the Tanner stage groups, while for TSF + SSF, fat mass and PA over the weekend, differences were observed between Tanner stages I–II and III–IV (Fig. 1).

Fig. 1 Measures of body composition and physical activity in the children based on Tanner stage. BMI – body mass index; TSF – triceps skinfold; SSF – subscapular skinfold; PA – physical activity; CI – confidence interval
Correlations
No associations between measures of PA and measures of body composition were observed when the children were divided according to gender. In boys, however, HAZ showed positive associations with BMI (r = 0.20, P = 0.030), TSF + SSF (r = 0.18, P = 0.05) and fat mass (r = 0.24, P = 0.010). No significant associations were observed between PA and body composition in the stunted children, while in the non-stunted children PA over weekends correlated negatively with BMI (r = − 0.14, P = 0.047), TSF + SSF (r = − 0.24, P = 0.001), percentage body fat (r = − 0.25, P < 0.0001) and fat mass (r = − 0.23, P = 0.001), while PA on weekdays was associated positively with both subscapular/triceps skinfold ratio (S/T ratio) and subscapular/subscapular + triceps skinfold ratio (S/ST ratio) (r = 0.18, P = 0.008 in both instances) and it was negatively associated with BMI (r = − 0.21, P = 0.003), TSF + SSF (r = − 0.22, P = 0.001), percentage body fat (r = − 0.25, P < 0.0001) and fat mass (r = − 0.25, P < 0.0001) (Tables 4 and 5) .
Table 4 Correlation matrix between physical activity levels and measures of body composition
BMI – body mass index; WC – waist circumference; WHR – waist-to-hip ratio; TSF – triceps skinfold; SSF – subcapsular skinfold; S/T ratio – subscapular/triceps skinfold ratio; S/ST ratio – subscapular/subscapular + triceps skinfold ratio; PA – physical activity.
Table 5 Correlation matrix between physical activity levels and measures of body composition in the stunted and non-stunted children
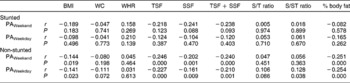
BMI – body mass index; WC – waist circumference; WHR – waist-to-hip ratio; TSF – triceps skinfold; SSF – subcapsular skinfold; S/T ratio – subscapular/triceps skinfold ratio; S/ST ratio – subscapular/subscapular + triceps skinfold ratio; PA – physical activity.
Discussion
The consequences of stunting accompanied by overweight/obesity in developing countries have been said to be adverse, and they include being prone to chronic diseases such as type 2 diabetes, hypertension and cardiovascular diseases later in lifeReference Popkin, Richards and Montiero1. Adolescence is known to be one of the four critical stages for human development as it constitutes the last possible growth spurtReference Dietz25. Also implicated in the development of chronic diseases is lack of sufficient PAReference Zimmet, Collins, Dowse, Alberti, Tuomilehto and Gareeboo26.
Against the background of the above reports, in this study we found negative associations between PA during both weekdays and weekends and BMI, TSF + SSF, percentage body fat and fat mass. This is taken as suggestive of a beneficial effect from being more active, as PA results in reduced fat deposits, congruent with previous researchReference Orbazanek, Schreiber, Crawford, Goldman, Barrier and Frederick27–Reference Treuth, Hou, Young and Maynard29. But when looking at boys and girls separately the associations disappeared, possibly due to the reduction in sample sizes as the groups were subdivided. This could also have been a result of the generally high activity levels observed in boys compared with girlsReference Deheeger, Cachera-Rolland and Fontveille30, Reference Monyeki, Koppes, Kemper, Monyeki, Toriola and Pienaar31, resulting in two groups which are homogeneous but each at the opposite end of the spectrum. Consequently, in the total group, there was a wider range of PA levels as well as body composition variables, with an increased probability of detecting possible associations.
The range of PA measured as the sum of METs over all the 30 min intervals in the girls was probably too small to show a significant correlation with body composition variables, which also had a relatively small range of values in both girls and boys. However, these gender differences might equally well be a result of the reported decline in PA in girls prior to pubertyReference Goran, Gower, Nagy and Johnson32. This decline was also found to occur irrespective of a continued gain in fat and fat-free mass, suggesting the possibility of an energy-conserving mechanism through reduced PA prior to puberty in girlsReference Goran, Gower, Nagy and Johnson32. The significantly lower PA in the children of Tanner stage III–IV compared with children in stages I–II found in this study is also an indication of this trend of decreased PA during later stages of physical maturation. These findings support reports that children are more active, during early life, with gradual decreases in their activity levels as they get olderReference Malina33, Reference McMurray, Harrell, Bangdiwala and Hu34. The decrease in PA was associated with an increase in body fat, confirming the inverse association between PA and percentage body fat as reported in other studiesReference Orbazanek, Schreiber, Crawford, Goldman, Barrier and Frederick27–Reference Treuth, Hou, Young and Maynard29.
Significantly greater differences between stunted and non-stunted children were observed in individual measurements (MUAC, waist circumference and calf circumference in boys, and hip and calf circumference in girls) than with body composition ratios (S/T and S/ST ratios), whereas there were no significant differences between skinfold thicknesses or percentage body fat between the stunted and non-stunted groups of children. In both gender groups, lean mass was also significantly lower in the stunted children. This is perhaps an indication that stunted children have impaired growth in terms of height and lean body mass, but they are not restricted in the accumulation of body fat; this confirms the results of a study on South African children carried out by Kruger et al. Reference Kruger, Margetts and Vorster10. Though not significant, stunted boys were more active on weekends; this observation is hard to explain but could be suggestive of factors related to the children's environmental exposuresReference Dufour35, Reference Monyeki, Kemper, Twisk, Toriola, Monyeki and Steyn36. In addition, the number of stunted boys was almost double that of girls. This result is congruent with findings by Friedman et al. Reference Friedman, Philips-Howard, Mirel, Terlouw, Okello and Vulule37 in their study carried out in Western Kenya. The pattern has been linked to the different growth patterns occurring during the various childhood growth phases, and in this study the effect of pubertal growth on the observed pattern cannot be ruled out.
Activities reported more often by boys included sport and harder chores such as gardening, including temporary manual labour, whereas girls were more involved with activities such as cleaning, cooking and doing the laundry. The findings from this study reveal that even in this era of both epidemiological and nutritional transition, some traditional gender roles for both males and females are still retained. However, there is evidence that the situation is changing gradually as evidenced (even though in small numbers) by the involvement of boys in some roles traditionally reserved for girls and the high number of girls participating in sporting activities.
HAZ levels improved gradually with advancement of Tanner stage. Although these data are cross-sectional, this in itself could be a reflection of the effects of the growth spurt wherein as it progresses the children are catching up in height, which could have faltered in the early yearsReference Adair38. Thus it is possible that the group of children who enter puberty stunted might have suffered an early insult during gestational life, in early infancy or during the period of adiposity rebound due to various factors known to affect these stages of critical growth development24, Reference Adair38, Reference Labayen, Moreno, Blay, Blay, Mesana and Gonzalez-Gross39. Indeed it is known that poor intrauterine environment, poor nutrition in early life, repeated infections as well as adverse socio-economic conditions during early growth affect stature and have a carry-over effect from birth to later adolescenceReference Pietilainen, Kaprio, Rasanen, Rissanen and Rose40, Reference Barker41. However, this cannot be ascertained in the present study, as no data are available on the conditions these children were exposed to early in life. However, studies in adolescents have shown that genetic and/or intrauterine environmental factors that influence foetal growth, and are themselves reflected in low birth weight, have long-term consequences for muscle mass in girls and for subcutaneous fat distribution in boysReference Labayen, Moreno, Blay, Blay, Mesana and Gonzalez-Gross39, Reference Singhal, Wells, Cole, Fewtrell and Lucas42.
Body composition measures (BMI, TSF + SSF, fat mass and lean mass) showed the same pattern as HAZ, with only lean mass differing significantly among all Tanner stage groups. The present findings suggest that with advancement in pubertal development, the children tended to reduce their PA levels and ended up accumulating more fat deposits. There was, however, a greater difference between the lean body mass of children in stage III–IV and children in stage V, than between the fat mass of sum of skinfolds of the two groups. The last group (Tanner stage V) comprised a small number of children, so it is possible that the lack of differences has more to do with the number of adolescent children in the group than it being an indication of no differences at all.
Of the studied children, 8.6% were overweight/obese, and a significantly higher number of girls than boys comprised this group. It should be noted that only 1.3% of the children studied were stunted and overweight/obese, and all these were girls. This lack of significant association between stunting and overt overweight/obesity in South African children and adolescents was previously reportedReference Jinabhai, Taylor and Sullivan7, Reference Kruger, Margetts and Vorster10. Evaluation of the body composition of the adolescents in the present study showed that stunted children had significantly lower values for anthropometric parameters indicating body size (i.e. height, weight, MUAC, calf circumference) and lean mass. Boys recorded lower HAZs than girls; possibly this could have resulted from a relative energy deficit in the boys, due to their higher levels of PA and, consequently, energy expenditure. Of note is that boys and girls presented with different types of fat patterning; boys tended to have significantly higher levels of fat being deposited centrally, indicated by a higher S/T ratio, while girls showed more gynoid deposition, reflected by a significantly greater hip circumference than the boys. This finding supports previous observations in black adolescents where it was found that during early growth boys and girls redistribute fat differentlyReference Monyeki43.
It is well documented that sociodemographic characteristics play a role in the nutritional status of children and adolescentsReference Jinabhai, Taylor and Sullivan7, but in this study the measured characteristics revealed no differences either in stunting levels or with the various body composition measures. This could have resulted from the homogeneity of the demographic characteristics in the township the adolescents came from and the small sample size.
Based on previous findingsReference Orbazanek, Schreiber, Crawford, Goldman, Barrier and Frederick27–Reference Treuth, Hou, Young and Maynard29, we thus speculate that low PA may be a contributing factor towards deposition of excess fat in the children in this study. Earlier studies have shown that the intensity of PA does not always explain weight gain and obesityReference Ekelund, Neovius, Linné, Brage, Wareham and Rössner44. The prevalence of stunting was high among the children studied, accompanied by higher PA, but not overweight/obesity, as also evidenced by the types of activities commonly performed by stunted children (harder household chores and more participation in sporting activities in stunted boys and girls, respectively). There was, however, a tendency towards similar body fat but less lean body mass among the stunted children. This shows a need for interventions to be initiated early since stunting is associated with adult fatnessReference Popkin, Richards and Montiero1, Reference Sawaya, Dallal, Solymos, de Sousa, Ventura and Roberts45. Interventions should be planned carefully to balance PA and dietary intakes, because excessive energy expenditure in PA may inhibit growth of children from low socio-economic groups.
Acknowledgements
Sources of funding: The study was supported by grants from the National Research Foundation, South Africa, the North-West University and the South African Sugar Association.
Conflict of interest declaration: The authors declare that there are no conflict of interests.
Authorship responsibilities: The authors contributed to the following: (1) design and concept of the study (H.S.K. and A.E.P); (2) acquisition of data (H.S.K., A.E.P., A.L., C.U., M.A.M. and M.C.-M.); (3) data analysis and interpretation (R.L.M., H.S.K. and M.A.M.); (4) manuscript draft (R.L.M., H.S.K., A.E.P., C.U., M.A.M. and M.C.-MM.); and (5) acquisition of funding (H.S.K. and A.E.P).
Acknowledgements: We acknowledge the assistance of Dr Cornelia Wessels, who supervised the collection of demographic data, and Dr Cilas Wilders, who was involved in supervision of the total study. The pivotal role of Professor H.H. Voster in the PLAY study is acknowledged. Students helped with data collection, computerisation and data cleaning.


