


High Na intake and low K intake are independently associated with an increased risk of developing high blood pressure(Reference Appel, Brands and Daniels1, Reference Cook, Obarzanek and Cutler2). To achieve dietary recommendations, most adults would need to decrease their Na intake and increase their K intake(Reference Cogswell, Zhang and Carriquiry3, Reference Drewnowski, Maillot and Rehm4), resulting in a decreased Na:K. An elevated Na:K is associated with higher blood pressure(Reference Hedayati, Minhajuddin and Ijaz5) and poor cardiovascular outcomes(Reference Yang, Liu and Kuklina6), and is attractive as a potential surveillance tool of population-level dietary habits. Although the USA has no formal recommendation for Na:K(7), the WHO defined an optimal Na:K as <1·0 mmol/mmol (i.e. <0·6 mg/mg)(8). The objectives of the current analysis were to present mean urinary Na:K values from a population-based sample and to report the percentage of New Yorkers meeting the WHO-defined optimal Na:K.
Methods
Data were obtained from the New York City (NYC) Heart Follow-Up Study (HFUS), a cross-sectional study conducted in 2010 to assess Na intake in a population-based, representative sample of NYC adults aged 18 years and older. Detailed study information has been described in a comprehensive Methods Report(Reference Sanderson, Yi and Bartley9). Study participants meeting the inclusion criteria were recruited from the Community Health Survey (CHS), an annual health survey conducted by the NYC Health Department. The CHS is designed after the national Behavioral Risk Factor Surveillance Survey (BRFSS) and includes questions either from national surveys or questions that have been validated by pre-testing in the NYC adult population. In 2010, more than 10000 New Yorkers were interviewed using a dual-frame, stratified random sample design consisting of random-digit dial of landline and cellular telephone exchanges that cover NYC(10). This recruitment design produces a sample that may be weighted to produce estimates that are representative of the NYC adult non-institutionalized population as a whole. Throughout the recruitment process, participation rates were closely monitored through daily and weekly reports by NYC Health Department survey staff.
Following the CHS questionnaire, participants meeting the three inclusion criteria (not pregnant, not breast-feeding or lactating, and not on current or past dialysis) were invited to participate in the HFUS. HFUS participants performed a 24 h urine collection; prior protocols were used as a basis for the design of the 24 h urine collection(Reference Elliott and Stamler11) but were modified to accommodate the unique needs of NYC and our study. Following the collection period, a home visit was scheduled with a medical technician. The home visit did not occur unless a signed informed consent was collected at the start of the visit. At the home visit, which followed a strict clinical protocol(12), an aliquot of the 24 h urine collection was collected. Two specimen tubes of aliquoted urine were included in case the first tube was damaged during shipment or the laboratory needed to redo the urinalysis. The urine samples were sent to a collaborating laboratory for the analysis of Na and K. The laboratory staff flagged any values that appeared to be incongruous with the volume of urine collected. No samples were flagged in this process. Results were sent via hard copy (laboratory values per participant) and via spreadsheet to the NYC Health Department, and were checked using double data entry from the original hard copy results. The Institutional Review Board of the NYC Health Department approved the study.
The 2010 CHS response rates were 17 % and 28 % for landline and cellular telephone exchanges, respectively. Cooperation rates among those who were reached were 77 % among landline contacts and 94 % among cellular contacts. Of the 2010 CHS participants screened for HFUS participation, 5830 eligible adults were identified. A total of 2305 agreed to provide a 24 h urine sample and of these, 1775 (30 %) provided a sample that could be analysed by the laboratory. The overall participant flow is displayed in Fig. 1. Those who agreed to participate were slightly more likely than those who did not to be Hispanic, <65 years of age, lower income and obese; however, there were no meaningful differences in self-reported high blood pressure or general health status between CHS and HFUS participants(Reference Sanderson, Yi and Bartley9). Incomplete samples were defined as those provided by participants who reported missing a collection and as those with a total urine volume <500 ml or urine creatinine <6·05 mmol creatinine in males and <3·78 mmol creatinine in females (both being biologically implausible; Elliott P & Stamler J, personal communication, 2011). The final analytic sample size was 1656.

Fig. 1 Heart Follow-Up Study (HFUS): participant flow and response rates
Measurement and definition of covariates
Na and K contents of 24 h urine samples were determined using the ion-selective electrode potentiometric method on the Roche DPP Modular analyser (Hoffman-La Roche, Ltd, USA). Laboratory values were normalized to a 24 h period prior to analysis. Results are presented in mg or mg/mg. BMI was calculated from measured weight in kilograms divided by the square of height in metres. Demographic (age, sex, race/ethnicity, poverty, education, nativity) and other characteristics (smoking, physical activity, fruit and vegetable intake, fast-food consumption, soda consumption) were either included in the CHS or in the questionnaire asked of only the subset of HFUS participants. Poverty was assessed as annual combined household income and was grouped according to federal poverty guidelines. Nativity (US-born v. foreign-born) was determined by asking state and country of birth. Because Na intake is related to diet, which in turn is heavily influenced by culture, those reporting being born in Puerto Rico or other US Territories were considered ‘foreign-born’. Physical activity was assessed using the validated question, ‘During the past 30 d, other than your regular job, did you participate in any physical activities or exercises such as running, calisthenics, golf, gardening, or walking for exercise?’. Fruit and vegetable intake was reported as servings/d and categorized (none, 1 to 4, 5+). Fast-food consumption was assessed as a continuous variable with the question, ‘How often do you eat something from a fast-food restaurant or chain such as: McDonalds, KFC, Taco Bell, Golden Krust or similar places?’, and was categorized as times/week (none, <1 (more than 0), 1 to <2, 2 to <3, 3 to <6). Per-day soda consumption was assessed as a continuous variable with the question, ‘How often do you drink sugar sweetened soda? Do not include diet soda or seltzer’, and categorized as a binary variable (two or more sodas daily, yes or no).
Statistical analysis
Differences in mean Na:K, Na intake and K intake by subgroups were assessed using t tests. The P trend across ordinal variable categories was assessed using Wald χ 2 tests. Multivariable linear regression models were used to understand factors associated with higher Na:K after adjustment for age, sex, race/ethnicity, poverty, education, nativity (foreign-born v. US-born), BMI, smoking status and physical activity. Comparisons of those with Na:K < 0·6 v. Na:K ≥ 0·6 by subgroup were assessed using χ 2 tests. Analyses were performed incorporating sampling weights to account for complex survey design and non-response. Data were analysed using the SUDAAN statistical software package version 10·0.
Results
The final sample of 1656 participants was weighted to be representative of the NYC population to estimate Na and K intakes in all NYC adults. Over 75 % of participants were between the ages of 25 and 64 years, and about half were male; half were Black or Hispanic; about half were foreign-born; 48 % had an income less than 200 % and 15 % had income between 200 and 399 % of the federal poverty level. The majority had less than a college education (69 %) and was US-born (58 %). The population was evenly distributed as normal weight, overweight and obese, and about 40 % were current or former smokers, 26 % were physically inactive over the past 30 d, 11 % reported no servings of fruits and vegetables the previous day, 49 % ate at a fast-food chain in the past week, and 10 % drank two or more sodas daily.
Mean Na:K in NYC adults was 1·7 mg/mg, with higher Na:K observed in: younger v. older adults; Black and Hispanic race/ethnic subgroups v. Whites; those with a higher v. a lower poverty level; those with a lower v. a higher educational attainment; US-born v. foreign-born; and obese v. normal BMI (Table 1). A higher Na:K was also associated with self-reported less healthy behaviours (high physical inactivity; low fruit and vegetable intake; high fast-food intake; and consumption of two or more sodas daily) compared with healthier behaviours. The observed patterns did not differ substantially in multivariable-adjusted analyses, but differences observed for poverty level and physical activity were no longer statistically significant (results not shown).
Table 1 Mean sodium:potassium, sodium and potassium intakes; 2010 Community Health Survey Heart Follow-Up Study (HFUS), New York City, USA
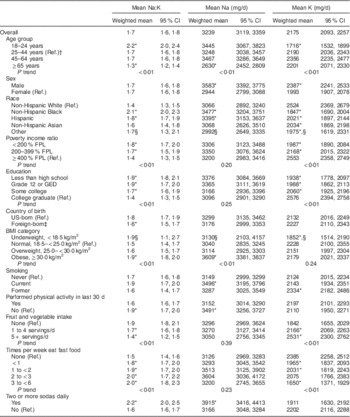
Ref., reference category; FPL, federal poverty level; GED, General Educational Development.
P value for trend is calculated for ordinal, categorical variables using the Wald χ 2 test.
* Statistical significance at P < 0·05, P value compares mean in subgroup to reference.
† Reference group is 25–44-year-olds due to smaller sample size in the 18–24-year-old group.
‡ Because diet and culture heavily influence Na and K intakes, those reporting being born in Puerto Rico or other US Territories were considered ‘foreign-born’.
§ Estimate’s relative standard error is greater than 30 % or the sample size is less than fifty, making the estimate potentially unreliable.
Only 5·2 % of New Yorkers had Na:K < 0·6 mg/mg. Being 45 years or older, White, engaging in healthier behaviours, having a higher income, having a college degree and being at a healthy weight were associated with Na:K<0·6 mg/mg (data not shown).
Discussion
In adult NYC residents, the mean Na:K assessed by biomarker data was 1·7 mg/mg, due to both high Na intake and low K intake. Only 5·2 % of the NYC population had an optimal Na:K, suggesting there are very few who meet dietary recommendations for Na and K intakes. These findings are consistent with national data from the National Health and Nutrition Examination Survey 2003–2008 using 24 h dietary recall(Reference Drewnowski, Maillot and Rehm4).
In our analysis, young adults (age 18–25 years) had the highest Na:K. Further, a less-than-optimal Na:K was associated with obesity and physical inactivity, both independent risk factors for CVD. The association with younger age raises concerns about poor dietary behaviours in early adulthood, which could increase the risk of premature CVD(Reference Biro and Wien13).
Adhering to the daily recommended Na limit for most adults (2300 mg) and the daily recommended K intake (4700 mg) would result in an Na:K of <0·5 mg/mg. Even fewer NYC adults would meet this lower ratio. The main dietary recommendation to increase K is to increase fruit and vegetable consumption; this was corroborated in our study, since a lower Na:K was associated with five or more daily servings of fruits and vegetables. A lower Na:K was also associated with lower fast-food and sugary drink consumption, suggesting that environmental changes to lower consumption of these foods, while increasing access to fruits and vegetables, could help shift the population Na:K.
Although 24 h urinary Na excretion is the gold standard measure of Na and K intake, it reflects ~97 % of Na consumed but only ~80–85 % of K intake(14). Thus, the urinary Na:K used in the current analysis may overestimate the true ratio. While the current study used the gold standard methodology of estimating Na intake through the measurement of rigorously collected 24 h urine, limitations to this methodology exist. The potential for incomplete collection of urine by the participant is a primary limitation of this methodology. From study design to implementation, to laboratory and data analysis, the HFUS investigators took this into consideration and has been previously described(Reference Angell, Yi and Eisenhower15). Another limitation is that one 24 h collection may not be representative of an individual’s typical intake given the high intra-person variability of Na excretion, although this is less problematic when assessing estimates at the population level. As an additional note, the units of Na:K differ depending on the measurement method (mg v. mmol). This affects the magnitude of the effect of a one-unit change, and should be considered when interpreting results across studies. Lastly, the results presented are only representative of the non-institutionalized adult population. While participation of different subgroups in the HFUS was similar to the overall CHS sample, there may be a slight over-representation of younger, lower-income and/or Hispanic adults. Expansion of the random digit-dial methodology to include cellular telephone users broadened the reach of the survey to those who do not have landline access, and improved representativeness. Similar methods have since been implemented at the national level(Reference Hu, Balluz and Battaglia16).
Improvements in meeting both Na and K daily intake recommendations could decrease risk of CVD, the leading cause of death. Na:K is a potential surveillance tool that can assess dietary changes over time in a single marker and can identify populations at high risk for nutrition-related chronic disease.
Acknowledgements
Financial support: The study was made possible by funding from the Robert Wood Johnson Foundation, the New York State Health Foundation, the National Association of County & City Health Officials and the Centers for Disease Control and Prevention (grant number 5U38HM000449-02), the W.K. Kellogg Foundation, the US Department of Health and Human Services, and New York City tax levy dollars. This funding is administered by the Fund for Public Health in New York, a private non-profit organization that supports innovative initiatives of the NYC Department of Health and Mental Hygiene. The funders had no role in the design, analysis or writing of this article. Conflict of interest: None. Authorship: S.S.Y. formulated the study question, conducted the literature search and all analyses. S.S.Y., S.Y.A. and C.J.C. were involved in the study design and implementation. All authors contributed to editing and finalizing the text of the manuscript. Ethics of human subject participation: The Institutional Review Board of the NYC Health Department approved the study.


