The alcohol guideline of the Dutch Health Council states: ‘do not drink alcohol, or at least no more than one glass per day’( 1 ). In 2015, it was estimated that on average 45 % of the total Dutch population aged 19–79 years adhered to this guideline; approximately 36 % of the men and 53 % of the women drank no more than one glass of alcohol per day on average( Reference van Rossum, Buurma and Vennemann 2 ).
Accurate estimates of energy and nutrient intakes of individuals and populations rely on information obtained about dietary intake, food composition and portion size( Reference Young and Nestle 3 ). Portion sizes of alcoholic beverages are often estimated in terms of standard drinks. In the Netherlands, one standard drink of alcohol corresponds to 10 g (12 ml) alcohol, which is approximately the amount of alcohol in 250 ml beer (5 % alcohol), 100 ml wine (12 % alcohol), 50 ml fortified wine (15 % alcohol) and 35 ml straight spirits (35 % alcohol)( 1 ). Noteworthy is that The Netherlands Nutrition Centre recently published different drink sizes based on consumer practices: 150 ml for wine, 75 ml for fortified wine and 50 ml for straight spirits( 4 ). The standard drink sizes are used for dietary monitoring and to make recommendations about alcohol consumption in relation to health. Furthermore, most surveys assessing alcohol levels, such as the Dutch National Food Consumption Survey, rely on the assumption that respondents use these standard drink sizes. However, knowledge of the term ‘standard drink’ by respondents is shown to be poor in self-reports of alcohol consumption( Reference Carruthers and Binns 5 – Reference Devos-Comby and Lange 7 ). As a result, the amount of self-reported drinks (given in standard servings) might not match the actual amount of alcohol consumed, leading to misreporting of alcohol consumption in the Netherlands.
To date, most of the research on the practice of pouring alcoholic beverages has focused on drink size variation in relation to pouring on-premises. Across these studies, drinks typically contained greater volumes of alcohol than one standard drink( Reference Banwell 8 – Reference Kerr, Patterson and Koenen 11 ), even when alcoholic beverages were poured by professional bartenders( Reference Wansink and van Ittersum 10 ). This effect was demonstrated in wine and in (mixed) straight spirits, whereas volumes of alcohol in beer and shots (unmixed spirits) were relatively similar to standard drink volumes. Fewer studies have investigated drink size variation in relation to self-serving off-premises. In a study in which the mean alcohol content of beer, wine and spirits was estimated in a national sample of US drinkers, a weighted mean alcohol content of 15·6 g overall, 13·1 g for beer, 15·4 g for wine and 20·8 g for spirits was revealed( Reference Kerr, Greenfield and Tujague 12 ), suggesting that the US alcohol drink standard (14 g alcohol per drink) underestimates the average alcohol content in glasses of wine and spirits poured at home. In Europe, a study in a Scottish population showed a considerable variation in the amount of wine or spirits that was poured. On average, the amount poured equalled approximately two UK standard units instead of one (8 g per drink)( Reference Gill and Donaghy 13 ). In 65- to 74-year-olds from Western Australia, larger volumes of wine and spirits were poured in comparison to a standard drink (10 g); 32 % more for men and 16 % more for women( Reference Wilkinson, Allsop and Chikritzhs 14 ). A study conducted in 1994 among Dutch participants found that drink sizes varied off-premises and that they were on average larger than a standard drink( Reference Lemmens 15 ). The deviation from the presumed standard (10 g per drink) was highest for spirits (+26 %), followed by fortified wine (+14 %) and least for wine (+4 %)( Reference Lemmens 15 ). Thus, errors in drink size likely contribute to the under-reporting of alcohol consumption. This is specifically relevant for beverages that do not come in drink-size containers( Reference Dawson 16 ), since not all individuals use the same type of glassware to pour alcoholic beverages at home. In fact, elongation of glasses has been shown to influence how much alcohol people pour: tall, slender glasses lessen the tendency and short, wide glasses increase the tendency to overpour( Reference Wansink and van Ittersum 10 , Reference Wansink and van Ittersum 17 ).
The last study in the Netherlands focusing on portion sizes of alcoholic beverages off-premises was more than 20 years ago( Reference Lemmens 15 ). The aim of the present study was to provide an update of the portion sizes of wine and straight spirits poured at home and compare them with the Dutch standard drink sizes and the drink sizes based on consumer practices. In addition, the study evaluated whether gender, age, BMI and level of education, and different glass types have an association with poured portion sizes. Beer and pre-mixed drinks were excluded because, at home, consumers mostly use standard units such as bottles and cans of which the contents are known.
Methods
Study design and participants
The present study was a cross-sectional observational study, designed to obtain information on the portion sizes of wine, fortified wine and straight spirits poured at home in a sample of adults living in the Netherlands. Between July and September 2017, adult men and women were recruited: (i) from the ‘EetMeetWeet’ research panel( 18 ); (ii) via a call on social media (Facebook, LinkedIn); and (iii) via direct approach from the researchers at a local supermarket and at a local public event, both in Wageningen. Inclusion criteria were a minimum age of 18 years old, living in the Netherlands, wine and/or straight spirits consumption at home at least once per week, and willing to measure wine and/or straight spirits poured at home on several days. No ethical approval was required for the present study. The Medical Ethics Committee of Wageningen University concluded that this research does not fall within the remit of the ‘Medical Research Involving Human Subjects Act’, because participants are not subject to procedures or required to follow rules of behaviour. In addition, it does not concern medical scientific research. All participants declared to have read and understood the goal of the study.
Procedure
Participants of the study were asked to measure the portion size (in millilitres) of wine, fortified wine and straight spirits in glasses they normally use at home. They received instructions by email, supported by a short video on how to measure the content of a glass. After pouring their drink into their usual glass, participants used a measuring cup for the measurements, which was provided by the researchers. The total duration of the study was different for each participant, as they could choose when to measure their alcoholic beverages within a period of two months (August and September 2017). Participants were requested not to change their habits of alcoholic beverage pouring and drinking.
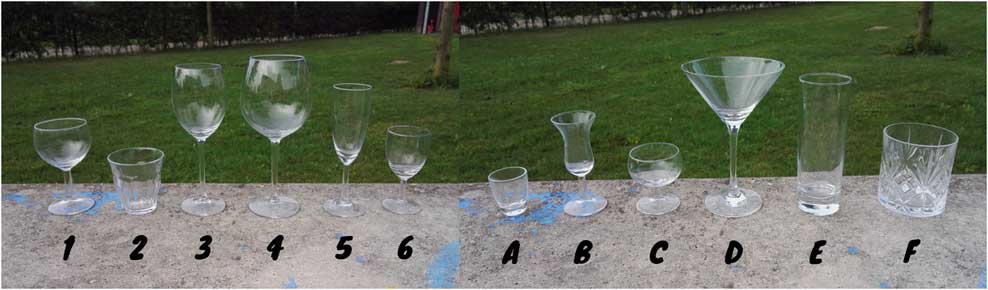
Participants filled out an online survey created in LimeSurvey( Reference Limesurvey 19 ) asking for the following information: the date of measurement, type of beverage, portion size in millilitres, alcohol content of the beverage indicated on the bottle (volume percentage) and the type of glass (relevant number or letter) in which they had poured their drink (see Fig. 1). Participants placed wine in one of the following categories: white wine, red wine, rosé, sparkling wine, dessert wine, port, sherry and other. The type of straight spirits was identified with an open question. Measurements of the same types of beverages were repeated up to a maximum of three times, each measurement made on a different day. In addition, gender, age, height and weight (in order to calculate BMI) and highest level of education completed (elementary, secondary, higher professional or scientific education) were asked to compare portion sizes between specific subgroups.

Fig. 1 (colour online) Glass types 1 to 6 for wine and fortified wine (left) and glass types A to F for straight spirits (right), as presented in the survey. Participants could indicate that they had used another glass type than those presented
Data analysis
All data were analysed in the statistical software package IBM SPSS Statistics for Apple Mac version 24. The average portion sizes (in millilitres) of white wine, red wine, rosé, other wine (sparkling wine and dessert wine), fortified wine (port and sherry) and straight spirits poured at home were calculated per participant. The fortified wine category included the average portion sizes of both port and sherry, based on similarities between standard drink size and alcohol content. Straight spirits were analysed in total and by alcohol volume percentage (<30 %, 30–40 % or >40 %). By inspection of boxplots, outliers were perceived in the data of white wine, red wine and rosé. Data were analysed with and without outliers. Analyses without outliers resulted in slightly lower means for the average portion sizes of white wine, red wine and rosé, but did not affect statistical significance. Thirty-one and twenty-four participants performed only one measurement for white wine and red wine, respectively, but means and standard deviations for the portion sizes of wine and straight spirits were similar. Therefore, data of all 201 participants were included for analysis.
The average portion sizes per participant were normally distributed for white wine, red wine, rosé, other wine, fortified wine and for straight spirits, as assessed by inspection of Q–Q plots and histograms. One-sample t tests were run to determine whether the mean portion sizes of each single type of wine (white wine, red wine, rosé, other wine), of fortified wine and of straight spirits deviated significantly from the standard drink sizes: 100 ml for wine, 50 ml for fortified wine and 35 ml for straight spirits. One-sample t tests were also run to assess whether the mean portion sizes of the wines, fortified wine and straight spirits deviated significantly from the consumer-based drink sizes published by The Netherlands Nutrition Centre: 150 ml for wine, 75 ml for fortified wine and 50 ml for straight spirits( 4 ). All P values were two-sided; P<0·05 indicated statistical significance.
ANOVA tests were used to determine whether the distribution of mean portion sizes of the wines, fortified wine and straight spirits differed significantly across categories of gender (men v. women), age (≤50 v.>50 years), BMI (≤25·0 v. ≥25·1 kg/m2) and education (elementary or secondary education v. higher professional or scientific education).
To assess whether glass type (shape and size) was associated with portion size, a one-way ANOVA was used for all types of wine separately and for straight spirits. When significant main associations were found using ANOVA, post hoc comparisons were done using least significant difference tests. In all tests, P<0·05 indicated statistical significance.
Results
Participant characteristics
Table 1 shows the characteristics of the 201 participants, including seventy-eight members of the ‘EetMeetWeet’ research panel and 123 participants who were recruited via social media or via direct approach from the researchers. The majority were female (60·7 %), their mean age was 55 (sd 16) years and they were not overweight on average (mean BMI=24·0 (sd 3·1) kg/m2). The sample was relatively highly educated, with 69·7 % of the participants reporting to have completed higher professional or scientific education. The ‘EetMeetWeet’ participants did not differ from the other participants except for their age, which was higher (mean age=62 (sd 11) years v. 51 (sd 17) years, respectively). Therefore, results of both samples were combined.
Table 1 Characteristics of the 201 participants from Wageningen and surroundings, the Netherlands, July–September 2017

* N, number of participants.
† One missing value for BMI, N 200.
Portion sizes of wine and fortified wine
Reported alcohol contents varied across participants and types of wine, with means of 12·2 (sd 1·4) % vol. for white wine, 13·1 (sd 0·7) % vol. for red wine, 12·3 (sd 1·4) % vol. for rosé, 10·7 (sd 3·0) % vol. for other wine and 17·8 (sd 2·7) % vol. for fortified wine.
Table 2 shows that the mean portion sizes of white wine, red wine, rosé and other wine were significantly higher than the standard drink size of 100 ml. In addition, the mean portion sizes of white wine and red wine were significantly lower than the drink size of 150 ml of The Netherlands Nutrition Centre. The mean portion size of fortified wine (port and sherry) was significantly larger than both the standard drink size of 50 ml and the drink size of 75 ml.
Table 2 Measured portion sizes (in millilitres) of white wine, red wine, rosé, other wine and fortified wine, and differences as compared with reference drink sizes, in 201 participants from Wageningen and surroundings, the Netherlands, August–September 2017
N/A, not applicable.
* N, number of participants.
† n, number of measurements. When a single participant performed more than one measurement for the portion size of a certain type of wine, the average of all measurements was used.
‡ P<0·05 indicates a statistically significant difference between the mean and the reference drink size.
§ Means were compared with the standard drink sizes of 100 ml (wine) and 50 ml (fortified wine), and with the consumer-based drink sizes published by The Netherlands Nutrition Centre of 150 ml (wine) and 75 ml (fortified wine).
The mean portion sizes of white wine, red wine, rosé, other wine and port/sherry did not differ significantly across gender or BMI categories (data not shown). Only the mean portion size of rosé was significantly different across categories of education (P=0·007), with higher educated participants pouring on average smaller amounts of rosé (mean=124·6 (sd 23·4) ml, n 20) than lower educated participants (mean=169·8 (sd 61·7) ml, n 10; where n is number of measurements). In addition, only the mean portion size of other wine was significantly different across categories of age (P=0·03), with participants ≤50 years old pouring on average larger amounts of other wine (mean=176·1 (sd 34·7) ml, n 5) than participants >50 years old (mean=121·5 (sd 46·2) ml, n 13).
Portion sizes of straight spirits
The reported alcohol content in straight spirits ranged from 13 % vol. to 46 % vol., with a mean alcohol content of 35·7 (sd 6·6) % vol. Table 3 shows that the mean portion size of all straight spirits taken together was significantly higher than the standard drink size of 35 ml, but not significantly lower than the drink size of 50 ml of The Netherlands Nutrition Centre. The mean portion sizes of straight spirits with an alcohol content <30 % vol., between 30 and 40 % vol. and >40 % vol. were all significantly higher than the standard drink size of 35 ml, although the higher the alcohol volume percentage, the smaller the mean portion size. Only the mean portion size of strong spirits (>40 % vol.) was significantly lower than the drink size of 50 ml.
Table 3 Measured portion sizes (in millilitres) of total amount of straight spirits and of straight spirits grouped by alcohol volume percentage, and differences as compared with reference drink sizes, in 201 participants from Wageningen and surroundings, the Netherlands, August–September 2017
* N, number of participants.
† n, number of measurements. When a single participant performed more than one measurement for the portion size of straight spirits, the average of all measurements was used.
‡ P<0·05 indicates a statistically significant difference between the mean and the reference drink size.
§ Means were compared with the standard drink size of 35 ml and with the consumer-based drink size published by The Netherlands Nutrition Centre of 50 ml.
The mean portion size of all straight spirits taken together was not significantly different across gender, age, BMI or education categories (data not shown). The mean portion size of strong spirits (>40 % vol.) was significantly different across categories of age (P=0·038), with participants ≤50 years old pouring on average smaller amounts of strong spirits (mean=34·6 (sd 16·6) ml, n 13) than participants >50 years old (mean=45·3 (sd 14·9) ml, n 33).
Association of glass type with portion size
Table 4 shows that there was a significant mean difference in portion size between the different glass types used for white wine (P=0·001), for red wine (P≤0·0001) and for other wine (P=0·019). Significant differences in portion size were observed between glass type 4 and glass types 2 (P≤0·0001), 3 (P=0·001) and 6 (P=0·009) when comparing glasses used for white wine. Table 4 reveals a higher mean portion size of white wine in glass type 4, which represented the largest glass type for wine (see Fig. 1). Glasses used for red wine showed comparable results, with glass type 4 being significantly different from glass types 2 (P≤0·0001) and 6 (P=0·006), and glass type 3 (the second largest glass type for wine) differing significantly from glass types 2 (P=0·005), 6 (P=0·028) and other glass types (P=0·037). For other wine, glass type 4 was significantly different from glass types 2 (P=0·034), 3 (P=0·027), 5 (P=0·020) and 6 (P=0·001). No significant difference in mean portion size was seen between the different glass types used for rosé (P=0·455) and fortified wine (P=0·428).
Table 4 Portion sizes (in millilitres) of white wine, red wine, rosé, other wine and fortified wine compared by type of glass in 201 participants from Wageningen and surroundings, the Netherlands, August–September 2017

N/A, not applicable.
* Glass types 1 to 6 (see Fig. 1) were presented for wine. Participants could indicate that they had used another glass type than those presented.
† N, number of participants.
‡ n, number of measurements. When a single participant performed more than one measurement for the portion size of a certain type of wine, the average of all measurements was used.
§ A statistically significant mean difference was observed between the different glass types used for white wine (P=0·001), for red wine (P≤0·0001) and for other wine (P=0·019). Glass types were significantly different from aglass type 4, bglass type 3, cother glass types (P<0·05).
For each type of glass in which straight spirits was poured, the mean portion size with sd are provided in Table 5. Glass type D was excluded from analysis, since it was used by just one participant who used it for a type of sherry and not for straight spirits. There was no significant mean difference in portion size between the glass types used for straight spirits (P=0·112).
Table 5 Portion sizes (in millilitres) of straight spirits compared by type of glass in 201 participants from Wageningen and surroundings, the Netherlands, August–September 2017
* Glass types A to F (see Fig. 1) were presented for straight spirits. Participants could indicate that they had used another glass type than those presented.
† N, number of participants.
‡ n, number of measurements. When a single participant performed more than one measurement for the portion size of straight spirits, the average of all measurements was used.
§ No statistically significant mean difference was observed between the glass types used for straight spirits (P=0·112).
Discussion
The present study quantitatively explored the portion sizes of wine, fortified wine and straight spirits poured at home in a sample of adults living in the Netherlands. Results revealed that the participants’ portion sizes were on average larger than the Dutch standard drink sizes.
Participants poured about 30–40 % more wine than the standard of 100 ml and about 90 % more fortified wine than the standard of 50 ml. The participants’ portion sizes of wine remained on average smaller than the practice-based serving size of 150 ml used by The Netherlands Nutrition Centre( 4 ), but the portion sizes of fortified wine were on average larger than the practice-based serving size of 75 ml. The size and shape of glasses varied among wine types, with larger amounts of white wine and red wine poured into large glass types compared with smaller glass types. Participants poured on average 35 % more straight spirits than the standard of 35 ml, but not significantly less than the practice-based serving size of 50 ml used by The Netherlands Nutrition Centre( 4 ). In addition, the higher the alcohol volume percentage was in straight spirits, the smaller was the portion size, but amounts still exceeded the standard of 35 ml. No significant differences between glass types used for straight spirits were detected. Similar results manifested when converting portion sizes (in millilitres) to alcohol content per serving (in grams), using reported volume percentages and an alcohol density of 0·789 g/ml( Reference Haynes 20 ). In fact, a portion of wine, fortified wine or straight spirit contained about 20–35 % more alcohol than the standard amount of alcohol per serving (10 g), except in the beverage types with the fewest measurements: the alcohol content per serving of other wine (n 18) did not deviate significantly from 10 g, possibly due to lower statistical power.
These findings suggest that the use of the standard drink sizes in self-reporting methods might lead to an underestimation of alcohol consumption in the Netherlands. The current study supports the evidence of a previous study( Reference Mongan and Long 21 ) that considerable differences exist between people’s perceptions of a standard drink and the actual definition of a standard drink, especially in relation to wine and spirits. This might affect the accuracy and precision of dietary surveys as well as recommendations on alcohol consumption in relation to health outcomes. The question arises whether using millilitres, or grams of alcohol, or other weight-based measures instead of the term ‘glasses’ in surveys could reduce measurement error, but these alternatives do not seem to be useful in helping drinkers to monitor alcohol intake( Reference Kerr and Stockwell 22 – Reference Stockwell, Blaze-Temple and Walker 24 ). Rather, it seems more effective to correct for under-reporting by using updated (i.e. larger) standard drink sizes, although the question remains whether systematic overpouring of alcoholic beverages is proportional to the total amount consumed. The present study cannot clarify this, because it was focused on pouring and not on consumption of alcoholic beverages. However, earlier validation studies( Reference Willett and Lenart 25 ) and both laboratory and field studies( Reference Wansink 26 ) reveal relatively high associations, showing that what is typically poured is typically drunk. Instead of correcting for under-reporting it might be worthwhile to educate consumers on the use of standard glasses; for example, by making use of unit-marked glasses, which seems to be effective in improving people’s understanding and attitude towards unit-based guidelines to monitor their drinking( Reference de Visser, Brown and Cooke 27 ). This could result in both more precise data in dietary surveys and better follow-up of alcohol consumption recommendations.
Regarding participant characteristics, the present study showed differences in portion size between education levels for rosé only and differences in portion size between younger and older participants for other wine and strong spirits (>40 % vol.) only. These findings should, however, be interpreted with caution, because rosé, other wine and spirits of >40 % vol. were measured by relatively few participants. With respect to BMI, in a UK study investigating the association between sensitivity to food cues (sight and smell of food) and body weight, individuals’ weight status was significantly associated with the tendency to desire larger portions of a cued food( Reference Tetley, Brunstrom and Griffiths 28 ). However, the present research did not demonstrate differences between average portion sizes of wine or straight spirits across BMI categories. Hence, BMI might not influence the desire for larger portions of alcoholic beverages per se. However, participants with high BMI values could have under-reported portion sizes in the present study. In a Dutch study investigating the associations between basic determinants and misreporting of dietary intake, BMI was the only consistent determinant of misreporting( Reference Trijsburg, Geelen and Hollman 29 ).
Participants indicated in the survey which glass type was most similar to the glass that they used at home. Glass type seemed to be associated with portion size of wine, with larger amounts of white and red wine poured in larger glass types. However, the glasses that were provided as references differed in shape and size and could only be compared with each other visually. No details were given about the exact size of the glasses, because participants could have perceived this as a guide for pouring their beverages up to a certain amount.
Each participant was asked to do multiple measurements for the same type of alcoholic beverages, and although standard drink definitions were not provided, people could have become more aware of poured amounts after completing the first measurement. However, statistical analyses showed no significant difference between first and last measurements (data not shown).
The present study was conducted off-premises; participants measured portion sizes of wine and straight spirits at home rather than in a controlled environment. A limitation of this choice includes the inability to monitor the measurements and to check for compliance. However, monitoring is considered a time-consuming and costly process, and it may distract or influence participants in their actions. In addition, pouring at home is more likely to reflect a real-life situation, in which participants use their own beverages and glasses. Special attention was given to avoid social desirability bias. Since alcohol consumption is considered a sensitive topic where socially desirable responding is of concern( Reference Davis, Thake and Vilhena 30 ), participants were not asked about consumption patterns, but explicitly about poured amounts of alcoholic beverages. In addition, they received no information on standard drink sizes.
The present study included the use of identical measuring cups by the participants, maximizing internal validity. In addition, the present study is the first one in the Netherlands to address portion sizes of alcoholic beverages off-premises since Lemmens’ study in 1994( Reference Lemmens 15 ). In line with the present results, Lemmens’ study showed that self-reported drinks taken at home contained on average more than the presumed standard amount of alcohol (10 g), with the highest deviation for spirits (+26 %), followed by fortified wines (+14 %) and wine (+4 %)( Reference Lemmens 15 ). Comparison of both studies should be interpreted with caution because they used different study designs and study subjects. For instance, Lemmens’ study sample was drawn in 1985 from the general Dutch population and consisted of 863 participants, whereas the present study is limited by a smaller, more local and highly educated group of participants. Therefore, further research in a larger, nationally representative sample is recommended. Since alcoholic beverages are not only poured at home but also relatively often in restaurants( Reference van Rossum, Buurma-Rethans and Vennemann 31 ), complementary research could be carried out on-premises for a more comprehensive estimation of alcohol consumption in the Netherlands.
Conclusion
Portion sizes of wine, fortified wine and straight spirits poured at home in the Netherlands are on average larger than the Dutch standard drink sizes. This finding might indicate that at-home alcohol consumption of these beverages in the Netherlands is underestimated.
Acknowledgements
Financial support: This study was funded by the Dutch Beer Institute. Conflict of interest: M.L.J. and A.S. were employed by the Dutch Beer Institute during the study and during writing of the manuscript. They had no leading role in the design of the study, the analyses or in the decision to publish the results. M.F.A.d.B., J.H.M.d.V. and E.J.M.F. have no conflict of interest. Authorship: M.F.A.d.B. developed the research question and study design, analysed and interpreted the data, and drafted the manuscript. M.L.J. assisted in data cleaning and was, together with A.S. and J.H.M.d.V., involved in the data interpretation, manuscript preparation and supervision of the project. E.J.M.F. contributed to the manuscript preparation. All authors reviewed and approved the final manuscript. Ethics of human subject participation: For this study, no ethical approval was required as indicated by the Medical Ethics Committee of Wageningen University.